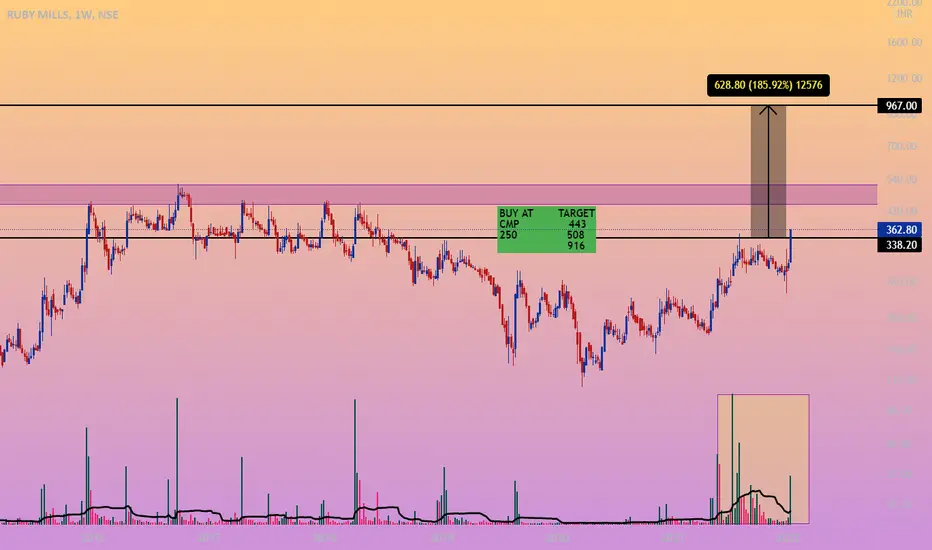
RuBY mills Ltd. may give multiyear break out -3X return on cardsThe share price consolidated for 15 years and then gave a breakout but again went into consolidation which again now going for the breakout. Entry at the present price looks good and but bit risky. So, take the entry above 335 weekly or monthly close to avoid stop-loss hitting
So Present entry 280-290 (bit risky)
entry after 335 weekly or monthly close (very little risk)
Pattern double bottom or cup and handle breakout
Ruby Mills Limited
No trades
What traders are saying


#RUBYMILLS on the weekly chart analysis#RUBYMILLS Weekly Chart Analysis 📊
◽️ Volatility Contraction : A tightening of price range has been observed.
◽️ Volume Surge : Recent increase in trading volume suggests growing interest.
◽️ Breakout Potential : Breakout with volume confirmed on both weekly and monthly timeframes.
◽️ Short-Term Target : Potential for a 25-30% move, with a target around 30%.
📌 Disclaimer : This analysis is for educational purposes only and is not a buy or sell recommendation.
Keep an eye on this one! 📈
Keep learning. All the best.

RUBYMILLS | Ascending Triangle Breakout | Swing TradeRUBYMILLS | Ascending Triangle Breakout | Swing Trade
Chart Analysis
1) Ascending Triangle Breakout
2) Swing trade for longtime

RUBY MILLS - Swing Trade Analysis - 3rd August #stocksRUBY MILLS (1W TF) - Swing Trade Analysis given on 3rd August, 2024
Pattern: ASCENDING TRIANGLE BREAKOUT
- Weekly Resistance Zone Breakout - Done ✓
- Weekly Volume Buildup at Resistance - Done ✓
- Demand Zone Retest & Consolidation (for a small SL and a better RR) - In Progress
* Disclaimer

Ruby Mills - Target 3000 - Sepf analysis CupidRuby Mills - Target 3000
1) Range yearly
2) Tried to breakout
3) LEts see

RUBY MILLS, Easy 75%From a technical standpoint, Ruby Mills appears robust. Touching the support line for the fifth time and experiencing a notable increase last week indicate signs of reversal. My target is to achieve a profit of 75-100% from the current market price. Although there was a false breakout previously, I am confident that this time it will result in a genuine breakout.
🚨 DYOR
🚨 SL must it depends on ur risk appetite

Ruby MillsLooks good for long
Every dip is a buy
Moving above all averages, weekly BO
Channel upwards

RUBYMILLS Swing TradeRUBYMILLS
Buy : 235.5
Target : 259
*DISCLAIMER*
This analysis is only for educational purpose. I am not a SEBI Registered Analyst/Advisor. Please consult your financial advisor before taking any position and please use a Stop Loss for any Investments/Trading Positions. It is your hard earned money so give risk management your highest attention. Do take this disclaimer seriously.

RUBYMILLS Bullish; above 249 on Wednesday 9 Aug for IntradayPlease check out the INTRADAY Trading Strategy in the COMMENTS section below during the live market hours:
---------------------------------------------------------------------------------------------------------------------
1) Impulse upmove stage: The strong upmove (nearly upto 2% from breakoutprice) happens within the first five to 15 minutes. "High Risk Traders" buys in hope of another 2% upmove intraday.
"High Risk Traders" may have to patiently wait through the Pullback-Consolidation stage to realize profits. High risk/High reward set up as breakouts may fakeout (reversal)also
2) Pullback-Consolidation stage: After the above "Impulse upmove stage"; the price may then pull back and move sideways (between "Open" price and "High" of the above "Impulse upmove stage").
Safe traders with minimum risk profile may Wait for a breakout from the consolidation to enter at this stage to relize high profits in the final intraday final "Breakout continuation" stage
3) Breakout continuation: Stocks often in the third stage breaks up above the "High" of the first "Impulse upmove stage" and continue to go higher again.
Both Safe Traders/High Risk Traders may book profits at this stage
Stop Loss: You may keep the stop loss @ "Open" price of the day OR "Breakoutprice"
The above information is not meant to be, and do not constitute, financial, investment, trading, or other types of advice or recommendation.

Ruby Mills Analysis Stock is near to BO zone on weekly TF, volume rising, follow chart for proper support and resistance levels.

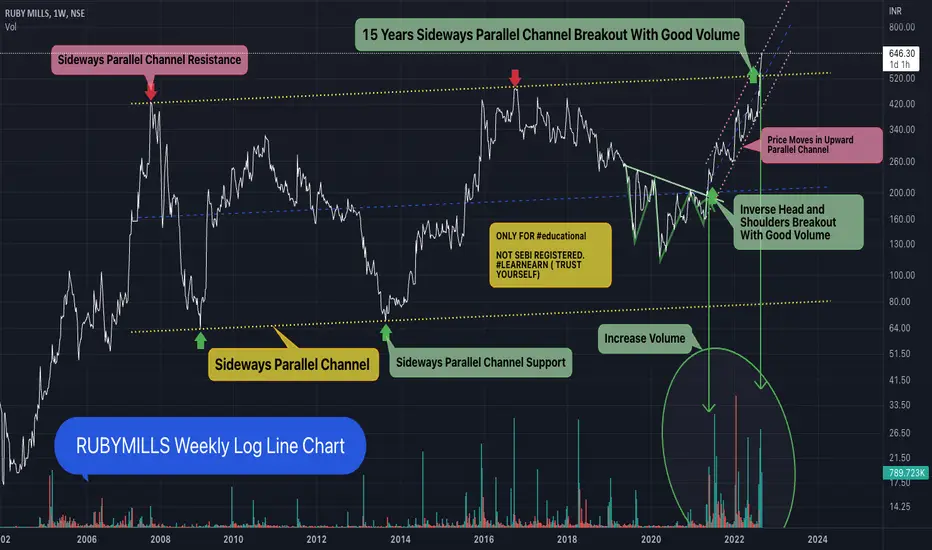
15 Years Sideways Parallel Channel Breakout at RUBYMILLS15 Years Sideways Parallel Channel #Breakout at #RUBYMILLS (Ruby Mills Ltd). Its #Outperformed #Nifty.
BSE: 503169 / NSE : RUBYMILLS
What Is the Inverse #headandshoulders ?
An inverse head and shoulders, also called a "head and shoulders bottom", is similar to the standard head and shoulders pattern, but inverted: with the head and shoulders top used to predict reversals in downtrends.
This pattern is identified when the price action of a security meets the following characteristics: the price falls to a trough and then rises; the price falls below the former trough and then rises again; finally, the price falls again but not as far as the second trough. Once the final trough is made, the price heads upward, toward the resistance found near the top of the previous troughs.
An inverse head and shoulders is similar to the standard head and shoulders pattern, but inverted.
It may be used to predict reversals in downtrends.
An inverse head and shoulders pattern, upon completion, signals a bull market
Investors typically enter into a long position when the price rises above the resistance of the neckline.
ONLY FOR #educational
NOT SEBI REGISTERED. #LEARNEARN (TRUST YOURSELF)
#nifty50 #sharemarket #BREAKOUTSTOCKS #Multibagger #sharemarket #sharemarketindia #sensex #technicalanalysis #Chartanalysis #headandshoulders #doubletop #doublebottom #parallelchannel #relativestrength
DISCLAIMER: I am not SEBI registered analyst. All posts are for educational purpose only. I am not responsible for your any loss or profit. Consult your adviser before taking any trade. I help people to learn technical analysis & charts reading.
15 YEARS OF CUP RUBY MILLSRuby Mills
Given multi year breakout with great volume'
one can buy for positional trade or long term investment
Cmp 616
SL 450
TG 700
750 , 800

53% returns in just 19 days fire 🔥🔥🔥This scrip was posted in this platform and so far it has given 53% returns in just 19 days. I hope our followers had benefited from this post. Thanks to all for your support 💪💪

Breakout in Ruby Mills...Chart is self explanatory. Levels of breakout, possible up-moves (where stock may find resistances) and support (close below which, setup will be invalidated) are clearly defined.
Disclaimer: This is for demonstration and educational purpose only. This is not buying or selling recommendations. I am not SEBI registered. Please consult your financial advisor before taking any trade.

Weekend pick: Ruby MillsWeekend time, weekend chart!
Chart -> Ruby Mills Weekly
518 to 450 was a 5-year-old resistance area, and this week stock has given closing above that resistance. Look at the volume buildups too!
CMP: 550
Good range: 450to500
Targets: 940
SL: 377
Disclaimer: This is for educational purposes only, not any recommendations to buy or sell. As I am not SEBI registered, please consult your financial advisor before taking any action.

15 years Channel breakout in Ruby Mills15 years Channel breakout in Ruby Mills.
Stock has a potential to reach 900 range in coming weeks.
For the further upside movement stock has to close above 587 range in a weekly chart.
Now, 500 range should act as support. 425 will be the ideal SL.
This is just a view not a recommendation to trade. Do your own analysis before making any trade.
Share your opinion in the comment section.
NSE:RUBYMILLS

20% returns in just 3 trading session 🔥🔥🔥🔥This scrip was posted on 1st Aug @390 and so far it has given 20% returns in just 3 trading session. I hope our followers had benefited from this post. Thanks to all 🙏🙏🙏

Made High of 11% returns in just one trading session 🔥🔥🔥This scrip was posted yesterday and today it made high of 11% returns in just one trading session... I hope our followers had benefited from this post.. Thanks to all 🙏🙏🙏

Good pattern - Don't miss it This scrip has been forming a good pattern . So traders keep on your radar to catch the momentum. Thanks to all 🙏🙏🙏

#RUBYMILLSALSO BUY MORE AT 338
The Company has been maintaining an effective average operating margins of 26.35% in the last 5 years.
The company has an efficient Cash Conversion Cycle of 68.34 days.
The company has a high promoter holding of 74.90%.
TRADE OR INVEST wisely.
WE CAN JUST PREDICT.
Disclaimer: I am not a SEBI registered advisor , so before entering on my view plz ask your SEBI Registered Advisor . Profit is your and loss is your.
PLEASE LIKE AND SHARE IF YOU AGREE WITH THE IDEA
RUBY MILLS- INVERTED HEAD & SHOULDERS PATTERN BREAKOUT.Swing Trade-Ruby Mills Inverted Head & Shoulder Pattern Breakout Daily Time Frame. Expect a Target-550/600 Stop Loss-405.only Education Purpose..

Ruby mills breakoutRuby mills horizontal line breakout. Also nearing it's all time high. Let's monitor how it behaves in coming days
