RUSTOMJEE: Structure Shift Pending Structure overview
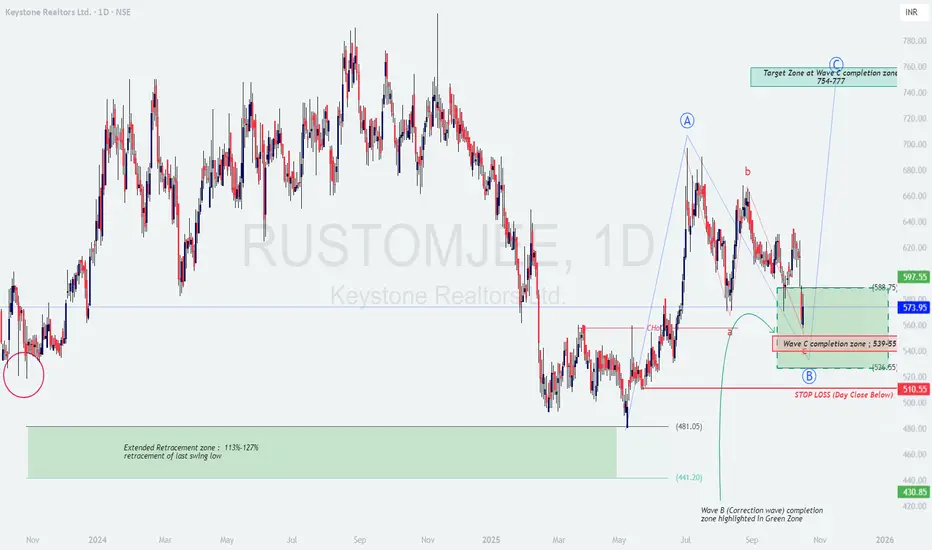
Price has completed a corrective downswing into a high-probability demand cluster marked as the Wave C completion zone 539–551 , aligning with prior structure support and the recent change‑of‑character (ChoCH) retest. The preceding upswing from May formed an impulsive leg (A), followed by a three‑leg pullback (a‑b‑c) that is now basing near the green box.
The broader thesis is a potential transition from correction to the next advancing leg (C) if the stock holds above the invalidation band and reclaims the upper boundary of the box with expanding volume.
Key levels
Buy zone: 551–539 (staggered entries).
Trigger confirmation: Daily close above 573–575 (ChoCH shelf) and then 588–590 (range high) to open momentum.
Targets: T1 597–605 (gap/structure), T2 654–675 (swing supply), Primary target 754–777 (projected Wave‑C completion).
Invalidation/Stop: Day close below 510–512 cancels the bullish swing; expect deeper retest into 481–441 if violated.
Momentum and pattern notes
The decline into 539–551 shows slowing downside and overlapping candles, consistent with completion of wave c. A higher low above 539 followed by a break of 588 would confirm a trend inflection.
Volume expansion on green days near 560–575 will strengthen the reversal case; weak bounce with fading volume would argue for more range before lift‑off.
Trade plan (cash/swing)
Entry 1: Accumulate small size within 551–539 with a tight stop under 535 intraday and core stop on day close below 510–512.
Entry 2 (confirmation): Add on a daily close above 573–575; raise stop to 545.
Entry 3 (breakout): Add on strong close above 588–590 with volume; trail under the breakout bar low.
Exits: Scale 30–40% at 597–605, another 30% around 654–675, and ride the rest toward 754–777 with a weekly trailing stop under higher lows.
Option tactics (if applicable)
Bull call spread when cash closes above 575: buy near‑ATM call, sell +80 to +120 OTM to reduce theta and cap risk. Consider a calendar call around 560 if expecting a slower grind higher. Exit or roll if the stock loses 575 on a closing basis after entry.
Risk management
Position sizing: Risk a fixed fraction of equity (0.5–1%) based on the 510–512 invalidation; avoid adding if price threatens the stop.
Respect daily/weekly closes for decisions; intraday spikes are common near base zones.
If the stock closes below 510–512, step aside and wait for a fresh base closer to 481–441.
Prediction
Base‑case scenario favors a swing advance from 551–539 toward 597–605, then 654–675 within 2–6 weeks, with the potential to extend into 754–777 if 590 holds post‑breakout and market breadth supports. Failure to reclaim 575–590 quickly would likely keep the stock range‑bound between 551 and 590 before the next directional move.
Disclaimer: This post is for education only and is not investment advice or a solicitation to buy/sell securities; I am not a SEBI registered analyst .
Keystone Realtors Ltd.
No trades
What traders are saying
Breakout soon in KEYSTONE REALTORSAscending Triangle Breakout Setup
RSI near 65 and rising
Trading above EMA50
Volume increasing
Testing ATH
Both FIIs & DIIs increased allocation in Jun
Disc: for study, not a recommendation

RUSTOMJEE Mega Breakout AheadHey Family, there is a one more stock Which is showing a great opportunity.
Key Points:-
* Formation of Ascending Triangle Pattern in Daily TF.
* From Jan 2024 to Aug 2024 Tested & Moving Near Resistance Many times.
* It's Near resistance Zone and trying to Break Resistance Zone with good volume.
* Volume Accumulation (Volume is Rising).
What is your view please comment it down and also boost the idea this help to motivate us. We are Certified. All views shared on this channel are my personal opinion and is shared for educational purpose and should not be considered advise of any nature.

Rustomjee .. waiting for breakout!!!Hello 👋
One more about to breakout stock..
The name of the stock is Keystone Realtors Ltd.
Stock is in uptrend.
Since Jan 24 till date stock is in consolidation.
It's made a triangle pattern on weekly chart. And about to break upside ..
It's previous high was 751.
It's my view. Please DYOA. No buy or sell recommendation 🙏
Thank you.

Rustomjee Looking good for longsRustomjee is risky bet but Looking good for longs. Daily chart is giving breakout from trendline. Good upmove can be seen. Levels given in chart

Keystone RealtorsPrice abv 20-50 on weekly
Huge Candle Volume break out.
Wait to cross the resistance levels
Indicator has given entry already
Entry above 20 points from CMP
Can go long as in investment
Pole & Flag Break out already happened

FLAT Correction in keystone realtors.Elliott Wave Analysis:-
FLAT correction
View1:-
a) wave correction was over and in b) wave correction c wave is pending either it should close above 658.75 then it will form expanding flat if it close below then it is a regular flat and it is expecting a break a) wave and it would reach the level of 533-549 .
View2:-
a) wave was completed and b) wave was completed and in c) wave formation I&ii wave was formed and iii, iv, v wave’s is expected to fall further directly from the current place.
Further we wait and watch
I’m not a sebi registered advisor.
Kindly do your own analysis before taking trade.

RUSTOMJEE - Bullish Consolidation with VolumesNSE: RUSTOMJEE is closing with a bullish consolidation candle supported with volumes.
Today's volumes and candlestick formation indicates strong demand and stock should move to previous swing highs in the coming days.
The stock has been moving along the horizontal support for the past few days which is indicating demand.
One can look for a 8% to 12% gain on deployed capital in this swing trade.
The view is to be discarded in the event of the stock breaking previous swing low.
#NSEindia #Trading #StockMarketindia #Tradingview #SwingTrade

Keystone Realtors (Rustomjee), BullishThe stock had been in downtrend since its listing. Had made Inverted Head & Shoulder Pattern
after listing but was unable to sustain, however continued the downtrend forming rounding
bottom pattern. Now, the stock has given 6month breakout. Even though earlier Inverted H&S
pattern is invalid, I have shown intermediate targets based on the same. All levels shown on the
chart, are only for educational purpose, not any trade recommendation.
