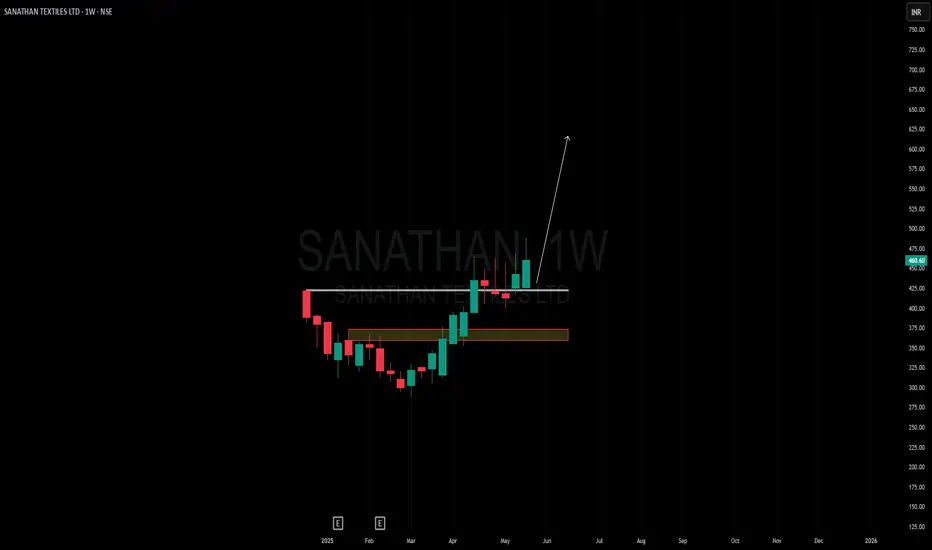
Trend Continuation in SANATHAN TEXTILES LTDNSE:SANATHAN
Timeframe - 4H CHART 📊
Base after Breakout 📈
An early entry above - @473 will make Good good RR.
Stock is maintaining clear HH HL structure.
And Recent Down candles are on very low Volume signals sellers getting absorbed.
Keep on radar. ⏳
Keep Learning, Happy Trading.
1.60 B INR
29.95 B INR
16.08 M
About SANATHAN TEXTILES LTD
Sector
Industry
Website
Headquarters
Mumbai
Founded
2005
ISIN
INE0JPD01013
FIGI
BBG01RGX5XG4
Sanathan Textiles Ltd. manufactures and supplies cotton, polyester yarn products, and yarn for technical textiles. Its associated products include clothes and apparels, towels, bath math and home furnishings, luggage, ropes, marine nets, sports and athleisure wear, umbrellas, personal protective equipment, firefighting equipment, pipes, optical cables, seat belts, and other related products. The company was founded on October 10, 2005 and is headquartered in Mumbai, India.
4.0%
4.5%
5.0%
5.5%
6.0%
Q2 '24
Q3 '24
Q4 '24
0.00
2.00 B
4.00 B
6.00 B
8.00 B
Revenue
Net income
Net margin %
Revenue
COGS
Gross profit
Op expenses
Op income
Non-Op income/ expenses
Taxes & Other
Net income
0.00
2.00 B
4.00 B
6.00 B
8.00 B
Revenue
COGS
Gross profit
Expenses & adjustments
Net income
0.00
2.00 B
4.00 B
6.00 B
8.00 B
Q2 '24
Q3 '24
Q4 '24
0.00
3.00 B
6.00 B
9.00 B
12.00 B
Debt
Free cash flow
Cash & equivalents
No news here
Looks like there's nothing to report right now

Amazing breakout on WEEKLY Timeframe - SANATHANCheckout an amazing breakout happened in the stock in Weekly timeframe, macroscopically seen in Daily timeframe. Having a great favor that the stock might be bullish expecting a staggering returns of minimum 25% TGT. IMPORTANT BREAKOUT LEVELS ARE ALWAYS RESPECTED!
NOTE for learners: Place the break
Breakout stock for next week- Sananthan TextilesSTL is a polyester yarn manufacturer and a global supplier of Cotton Yarns, Polyester Yarns and Yarns for Technical Textiles
Round Bottom Breakout Setup
RSI above 65 and rising
Trading above EMA50
Volume spike on breakout
~4 months of consolidation
Disc: for study, not a recommendation

BUY TODAY SELL TOMORROW for 5%DON’T HAVE TIME TO MANAGE YOUR TRADES?
- Take BTST trades at 3:25 pm every day
- Try to exit by taking 4-7% profit of each trade
- SL can also be maintained as closing below the low of the breakout candle
Now, why do I prefer BTST over swing trades? The primary reason is that I have observed that

SANATHAN TEXTILES - DAILY CHARTReversal from the bottom, probability of going up. Must use SL keeping in mind current market situation.
If you like my analysis, please follow me as a token of appreciation :)
in.tradingview.com/u/SatpalS/
For learning and educational purposes only, not a trading advice. Pls consult your financ

See all ideas
Summarizing what the indicators are suggesting.
Neutral
SellBuy
Strong sellStrong buy
Strong sellSellNeutralBuyStrong buy
Neutral
SellBuy
Strong sellStrong buy
Strong sellSellNeutralBuyStrong buy
Neutral
SellBuy
Strong sellStrong buy
Strong sellSellNeutralBuyStrong buy
An aggregate view of professional's ratings.
Neutral
SellBuy
Strong sellStrong buy
Strong sellSellNeutralBuyStrong buy
Neutral
SellBuy
Strong sellStrong buy
Strong sellSellNeutralBuyStrong buy
Neutral
SellBuy
Strong sellStrong buy
Strong sellSellNeutralBuyStrong buy
Displays a symbol's price movements over previous years to identify recurring trends.
Frequently Asked Questions
The current price of SANATHAN is 516.60 INR — it has increased by 0.98% in the past 24 hours. Watch SANATHAN TEXTILES LTD stock price performance more closely on the chart.
Depending on the exchange, the stock ticker may vary. For instance, on NSE exchange SANATHAN TEXTILES LTD stocks are traded under the ticker SANATHAN.
SANATHAN stock has fallen by −5.40% compared to the previous week, the month change is a 9.91% rise, over the last year SANATHAN TEXTILES LTD has showed a 22.33% increase.
We've gathered analysts' opinions on SANATHAN TEXTILES LTD future price: according to them, SANATHAN price has a max estimate of 510.00 INR and a min estimate of 510.00 INR. Watch SANATHAN chart and read a more detailed SANATHAN TEXTILES LTD stock forecast: see what analysts think of SANATHAN TEXTILES LTD and suggest that you do with its stocks.
SANATHAN reached its all-time high on Jul 21, 2025 with the price of 560.20 INR, and its all-time low was 286.95 INR and was reached on Mar 3, 2025. View more price dynamics on SANATHAN chart.
See other stocks reaching their highest and lowest prices.
See other stocks reaching their highest and lowest prices.
SANATHAN stock is 2.34% volatile and has beta coefficient of 1.17. Track SANATHAN TEXTILES LTD stock price on the chart and check out the list of the most volatile stocks — is SANATHAN TEXTILES LTD there?
Today SANATHAN TEXTILES LTD has the market capitalization of 43.15 B, it has increased by 2.31% over the last week.
Yes, you can track SANATHAN TEXTILES LTD financials in yearly and quarterly reports right on TradingView.
SANATHAN net income for the last quarter is 436.50 M INR, while the quarter before that showed 341.70 M INR of net income which accounts for 27.74% change. Track more SANATHAN TEXTILES LTD financial stats to get the full picture.
No, SANATHAN doesn't pay any dividends to its shareholders. But don't worry, we've prepared a list of high-dividend stocks for you.
As of Jul 30, 2025, the company has 1.43 K employees. See our rating of the largest employees — is SANATHAN TEXTILES LTD on this list?
Like other stocks, SANATHAN shares are traded on stock exchanges, e.g. Nasdaq, Nyse, Euronext, and the easiest way to buy them is through an online stock broker. To do this, you need to open an account and follow a broker's procedures, then start trading. You can trade SANATHAN TEXTILES LTD stock right from TradingView charts — choose your broker and connect to your account.