SAPPHIRE FOODS - Bullish Breakout From Falling Wedge📊 SAPPHIRE FOODS – Bullish Breakout from Falling Wedge
🕰️ Timeframe: 1D | 📉 Pattern: Falling Wedge Breakout
🔍 Technical Breakdown:
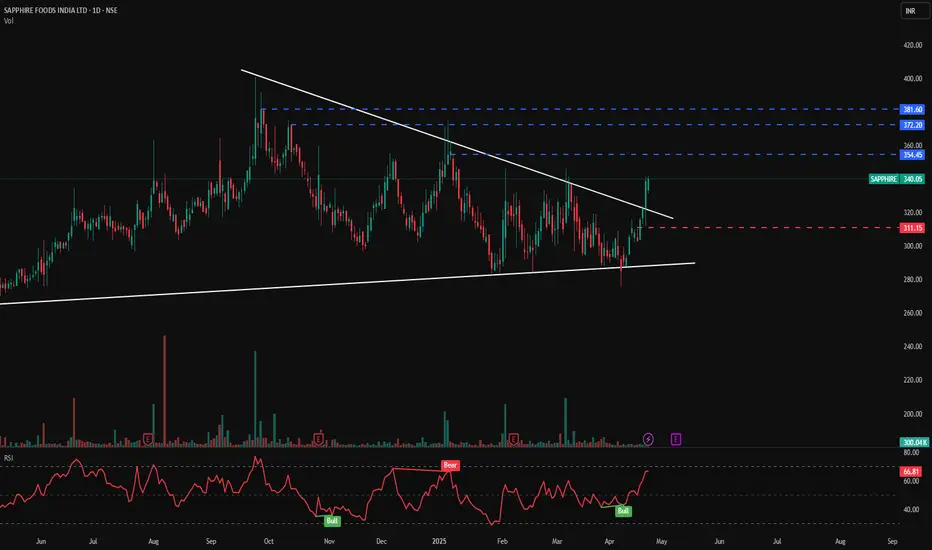
SAPPHIRE has broken out of a well-defined falling wedge pattern — a bullish reversal signal — backed by a sharp move on increased volume.
This wedge has been forming since early February, and the recent breakout above the upper trendline suggests renewed momentum and buying interest.
🔑 Key Technical Levels:
🔵 Resistance Zones (Upside Targets):
₹354.45
₹372.20
₹381.60
🔴 Support Zone:
₹311.15 (previous resistance turned support post-breakout)
⚪ Wedge Support Line: Well-held and now acting as a base for this breakout rally
📊 Volume & Indicator Insights:
🔺 Breakout is supported by a volume surge (300K), indicating institutional or smart money participation.
🔄 RSI at 66.81, nearing overbought territory but still in healthy uptrend range — confirming strength.
📉 RSI signals:
Bullish crossover (around ₹300) confirmed breakout
Prior “Bear” signal in Feb has now reversed to “Bull” (label shown)
🧠 Bias: Strongly Bullish
📍 Retest of ₹311–₹320 zone could offer re-entry opportunity with favorable risk-reward.
⚠️ Disclaimer: This chart is for educational purposes only. Please conduct your own due diligence or consult a professional before investing.
📈 Follow for more breakout pattern setups | PriceAction_Pulse
💬 Share your views on this wedge breakout in the comments!
SAPPHIRE trade ideas
Sapphire Foods cmp 305.35 by Weekly Chart view since listed_*Keep stock on watchlist for probable upside reversal from the Support Zone*_
Sapphire Foods cmp 305.35 by Weekly Chart view since listed
- Weekly basis Support seen at 264 > 226 > 189 with Resistance seen only at 343 > ATH 275
- Stock is trading within Price Range of 300 to 350 since making an ATH 375 in September 2024
- Price is trending along both the Rising Support Trendlines since long anow, as seen by Weekly Chart
- Multiple Repeated Bullish Rounding Bottoms are completed and are continuing currently well above the marked Support Zone Neckline
- One may interpret the above back to back Rounding Bottoms as VCP pattern too, as one my observe the chart to be in Rising Price Channel
- *Currently the Stock Price is hovering around the Support Zone with some demand based buying seen on Friday for probable upside reversal anticipation*

SAPPHIRE: A High-Probability Trading OpportunityThe stock market is full of opportunities, but finding trades with strong confluences of price action concepts is a skill that separates consistent traders from the rest. Today, let’s dive into SAPPHIRE and explore why it could offer a compelling trade setup.
🛠️ Technical Analysis Breakdown
SAPPHIRE is currently positioned at a significant price level, where multiple technical factors are aligning to create a potential high-probability trade setup. Let’s break this down:
📉 Demand Zone Confluence
SAPPHIRE is trading within a daily demand zone , which lies inside a weekly demand zone .
Daily and weekly Demand Zone : A footprint of smart money buyers, indicating strong potential for upward price movement.
💡 When such demand zones overlap, it creates a strong base for buyers, significantly increasing the chances of price reversal.
📈 Trendline Support
The stock is also trading above a strong upward-sloping trendline , which has consistently acted as support in the past. This trendline reflects the stock's upward momentum and the confidence of buyers.
🔄 Potential Triple Bottom Formation
The stock's current positioning suggests that if it reverses from this area, it may form a triple bottom pattern . This is a powerful bullish reversal pattern that signals an end to the downtrend and a potential shift to higher prices.
🏛️ Key Resistance Turned Support
SAPPHIRE is hovering around a level that previously acted as a strong resistance before the breakout. Now, this same level is expected to act as support due to the concept of role reversal in technical analysis.
🔗 Why This Setup Stands Out
Multiple price action concepts—demand zones, trendlines, role reversal are aligning at this point.
High probability of reversal due to smart money footprints in demand zones.
Low risk and high reward potential, as the risk can be defined by setting a stop-loss just below the demand zone.
🎯 Final Thoughts
This setup on SAPPHIRE offers an excellent opportunity for traders who can manage their risk effectively and have the patience to let price action confirm the trade. Always remember, confluence of multiple technical factors increases the probability of success but does not guarantee it.
📌 "Success in trading comes from disciplined preparation and precise execution."
Feel free to ask if you have questions. Remember, trading is a marathon, not a sprint—stay consistent and keep learning! 🚀
📢 Disclaimer
This analysis is purely for educational purposes and is not intended as a trading or investment recommendation. I am not a SEBI-registered analyst.

SAPPHIRE BULLISHSAPPHIRE FOODS INDIA LTD is looking strong upside.
Entry for swing trade
You can go for it after doing your own analysis.
entry price, target and stop loss has been updated in the chart.
ONLY FOR EDUCATIONAL PURPOSE..!

SAPPHIRE#SAPPHIRE is trading in the demand zone currently. The stock price is held up strong despite the market being choppy in this week. One can buy with a Stop Loss as mentioned on the chart.

Ready For Another Rally, Keep In RadarSapphire Foods has successfully broken out of a rising wedge pattern and is now retesting the breakout level near 350. A strong bounce from this support level could trigger further upside. The RSI is above 60, signaling bullish momentum. Traders should watch for sustained price action above 360 for confirmation of the breakout continuation.

Potential Bullish Breakout in SAPPHIRE | Long 1550-1600Key Points:
Pattern Observed : Cup and Handle Formation with Ascending Triangle
Failed Retest : Cup & Handle Retest Failed, indicating strong resistance
Support Level : Ascending Triangle suggests strong support around 1550-1600
Entry Zone : My entry price is between 1550 to 1600 INR
Target Price : Projected target price is 1866.80 INR
Volume Analysis : Increasing volume confirming bullish momentum
Indicators : RSI currently at 44.98, indicating potential for upward movement
Follow us to get notified about potential breakout stocks.
Disclaimer:
Not SEBI Certified : This analysis is for educational purposes only
DYOR : Do Your Own Research before making any investment decisions
Disclaimer : Trading involves risks, and past performance is not indicative of future results

SAPPHIREAfter long consolidation in last 2 year it has given trendline breakout that too on weekly chart.
1400 is imp level that needs to be supported

SAPPHIRE (4HR)SAPPHIRE Foods India Ltd (4HR)
CMP 1567
Cup and Handle formation
at probable breakout zone

SAPPHIRE | Swing Trade📊 DETAILS
Sector: Hotel, Resort & Restaurants
Mkt Cap: 10,441 cr
Sapphire Foods is one of the largest franchisees of Yum! Brands Inc. in the subcontinent, and operates more than 400 KFC, Pizza Hut, and Taco Bell restaurants across India, Sri Lanka, and the Maldives.
TTM PE : 56.09 (Average PE)
Sector PE : 64.94
Beta : 0.39
📚 INSIGHTS
Strong Performer
Stock with good financial performance alongside good to expensive valuation, but lacks price momentum as suggested by technical indicators
8.14% away from 52 week high
Outperformer - Sapphire Foods India up by 12.09% v/s NIFTY 50 down by -1.15% in last 1 month
📈 FINANCIALS
Piotroski Score of 6/9 indicates Average Financials
Disclaimer: This analysis is for educational purposes only, and I'm not a SEBI registered analyst.
If you found this analysis helpful, I encourage you to like and share it. Your observations and comments are also welcomed below. Your support, likes, follows, and comments motivate me to consistently share valuable insights with you.
🔍 More Analysis & Trade Setups 🔍
For more technical analysis and trade setups, make sure to follow me on TradingView: www.tradingview.com

SuperperfomanceSexy VCP formed in weekly time-frame.
Supported by awesome fundamentals.
Ezzy 1900 /-

Sapphire Foods India LTD analyasis on 9 apr 24Sapphire Foods India LTD analyasis on 9 apr 24
Short term trade ideas(3-4 Days)
Keep stoploss 1475
target 1580 - 1600 - 1620

Saphire Foods India Chart Ready For A Breakout. 🔥🔥Saphire Foods India Chart Ready For A Breakout. 🔥🔥
SAPHIRE stock has made a breakout of a 2 year long Ascending Triangle Pattern. Currently, the stock seems to be retesting the previous breakout zone. Best time to enter is when the stock outperforms after retest is completed.
Investors can expect a min target of 50% form the breakout zone.
Entry: Above 1538✅✅
SL: 1290❌❌
TGT1: 1999🔥🔥
TGT2:2338🎯🎯

SAPPHIRE FOODS - Go LongFor Educational Purpose..
⚠️ I'm not a SEBI REGISTERED analyst & my view can be biased
⚠️ No Buy Sell recommendation, do your own DD.
#SAPPHIRE IS READY TO BUY LONG
- Last Months Volume Massive
- View Ascending Triangle Monthly Chart
- Multi Year Breakout
Waiting Time 3-6 Months
Long Above (Required Candle close) - 1575
SL - 1400
Target - 1600, 1650, ATH & More
Thank you

StockStock above life time high
Breakout ascending triangle pattern
Sustain above 1500 level
Volume spike
Look at previous volume buildings
Low PE ratio stock
Under value stock compare to peer company and it's PE previous life

Sapphire Food India - Chart Of the weekSapphire food has given ascending triangle breakout on Weekly chart. Price has given all time high breakout and all time high volume breakout. Buy for big target.

SAPPHIRE Foods (At support)Sapphire foods looks good for a reversal. Pattern will be invalid if it closes below the trendline/ Zone. Target: 1450-1500-1530-1580-1650
NOTE: I'm not a SEBI REG. Study before investing.

SAPPHIRE BO [Weekly]SAPPHIRE breaking out of a large weekly base this week. In addition it also came in the screener for upwards sloping RS values. Following are the RS scores for the past 4 weeks close:
1st Mar - 27
7th Mar - 28
15th Mar - 35
22nd Mar - 46
Although the RS score is not quite healthy, but in a market like this a large weekly base cannot be ignored as the stock is showing strength when most are not.
I'll personally track this and see if this gives an entry when market breadth and overall conditions improve.

Sapphire foods-Can it break ATH this time?Sapphire foods has been consolidating in a beautiful ascending triangle pattern.
Currently, stock is near suppl zone, hence only risky investors should be interested
If the stock gives monthly closing above 1500 with good volumes, we can see a big move in this stock.
Keep in watchlist!

VCP Patter in Sapphire FoodsThere is a recent listing called Sapphire Foods
VCP Pattern
QSR space
High P/E and high growth stocks
Eventual breakout
Good strength

SAPHIRE FOODS INDIA (Bullish Ascending Triangle)TARGET 2263
Forming Bullish Ascending Triangle on weekly candle
If break above 1570 and hold then go for long 2263.

Sapphire Foods India Weekly BreakoutSapphire Foods India Weekly Breakout, I have been eyeing this for a long time. Ill wait for a candle closed and then retracement to go long

Ascending Triangle SAPPHIRE ( Weekly Chart)
+ Setting up Nicely
+ Above Key EMAs
+ Strong Bounce from Major TL
- Not a Buying Recommendation
