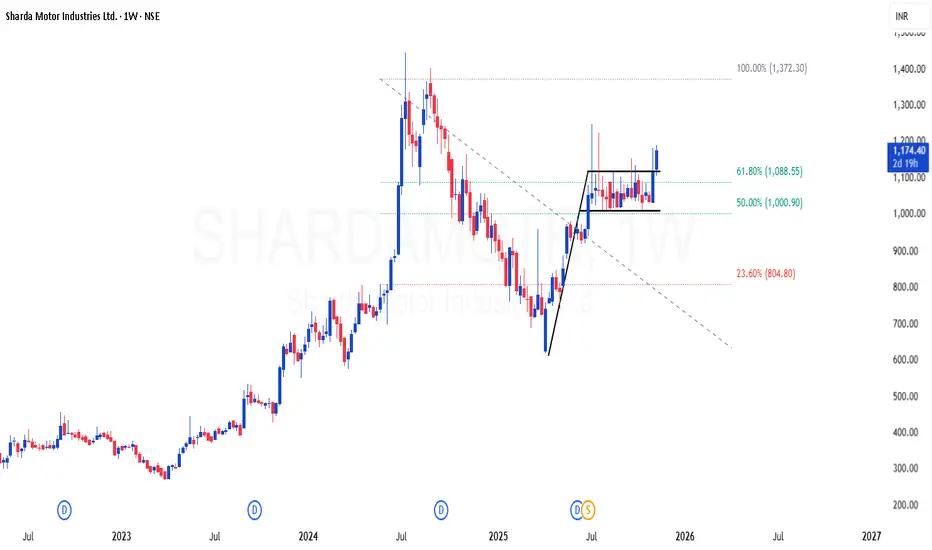
SHARDAMOTR | Nice flag breakout in weekly time frameSHARDAMOTR | Nice flag breakout in weekly time frame
CMP : 1170 (Dip : 1000)
SL : 900
Target : 1800 (based on fib)
58.20 INR
3.15 B INR
28.37 B INR
20.42 M
About Sharda Motor Industries Ltd.
Sector
Industry
CEO
Aashim Relan
Website
Headquarters
New Delhi
Founded
1986
ISIN
INE597I01028
FIGI
BBG004LHT7M9
Sharda Motor Industries Ltd. engages in the manufacture and trade of automobile components. The firm specializes in motor vehicles parts such as suspension, silencer, exhaust pipes, car seats frame and seats cover, and others. Its services include exhaust system, suspension system, and seat trim and seat frames. The company was founded by Narinder Dev Relan on January 29, 1986 and is headquartered in New Delhi, India.
Related stocks
BUY TODAY SELL TOMORROW for 5%DON’T HAVE TIME TO MANAGE YOUR TRADES?
- Take BTST trades at 3:25 pm every day
- Try to exit by taking 4-7% profit of each trade
- SL can also be maintained as closing below the low of the breakout candle
Now, why do I prefer BTST over swing trades? The primary reason is that I have observed that

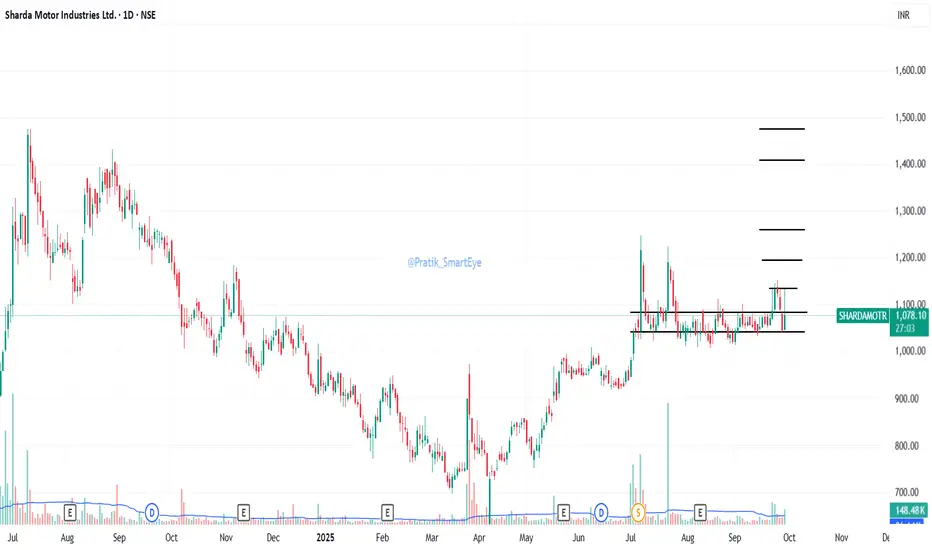
Sharda Motor – Breakout Swing Setup | Targets ₹2,095–2,250Sharda Motor Industries Ltd (NSE: SHARDAMOTR) is showing a clean breakout retest continuation pattern on the daily chart.
✅ Entry Zone: ₹1,950 – ₹1,975
✅ Stop Loss: ₹1,880 (Daily Close Basis)
✅ Target 1: ₹2,095
✅ Target 2: ₹2,235–₹2,250
🔹 Rationale:
Price rebounded from the 10EMA & prior breakout

BUY TODAY SELL TOMORROW for 5%DON’T HAVE TIME TO MANAGE YOUR TRADES?
- Take BTST trades at 3:25 pm every day
- Try to exit by taking 4-7% profit of each trade
- SL can also be maintained as closing below the low of the breakout candle
Now, why do I prefer BTST over swing trades? The primary reason is that I have observed that

Sharda Motor for 80% jump after correctionSharda Motor Industries on daily chart seems to be in Wave IV that began on 9th July’24 and likely to come down to 2000-2050 levels as seen in the chart. This consolidation can go on for a few months.
Thereafter, the stock shall move up as Wave V (in five smaller waves) towards 3700+ levels (a 80%


Buy Sharda Motors Short Term Trading Advice by Goodluck Capital
Buy Sharda Motors
Buy Range- 2560 - 2630
Target- 2930 - 2950
StopLoss- below 2420
Potential Return- 13-14%
Approx trade duration 14 - 15 days

SHARDA MOTORS- a must buy stock 50% upside possiblesharda motors is our fav weekly pick. stock has potential to go 50% upside after its retrace is complete. entry levels are given in chart. do imply with stoploss.targets are expected to hit in 3-4 months.

Sharda Motor Industries Limited - Breakout Setup, Move is ON...#SHARDAMOTR trading above Resistance of 2376
Next Resistance is at 3254
Support is at 1497
Here are previous charts:
Chart is self explanatory. Levels of breakout, possible up-moves (where stock may find resistances) and support (close below which, setup will be invalidated) are clearly de

See all ideas
Summarizing what the indicators are suggesting.
Oscillators
Neutral
SellBuy
Strong sellStrong buy
Strong sellSellNeutralBuyStrong buy
Oscillators
Neutral
SellBuy
Strong sellStrong buy
Strong sellSellNeutralBuyStrong buy
Summary
Neutral
SellBuy
Strong sellStrong buy
Strong sellSellNeutralBuyStrong buy
Summary
Neutral
SellBuy
Strong sellStrong buy
Strong sellSellNeutralBuyStrong buy
Summary
Neutral
SellBuy
Strong sellStrong buy
Strong sellSellNeutralBuyStrong buy
Moving Averages
Neutral
SellBuy
Strong sellStrong buy
Strong sellSellNeutralBuyStrong buy
Moving Averages
Neutral
SellBuy
Strong sellStrong buy
Strong sellSellNeutralBuyStrong buy
Displays a symbol's price movements over previous years to identify recurring trends.
Frequently Asked Questions
The current price of SHARDAMOTR is 944.25 INR — it has decreased by −3.43% in the past 24 hours. Watch Sharda Motor Industries Ltd. stock price performance more closely on the chart.
Depending on the exchange, the stock ticker may vary. For instance, on NSE exchange Sharda Motor Industries Ltd. stocks are traded under the ticker SHARDAMOTR.
SHARDAMOTR stock has fallen by −0.19% compared to the previous week, the month change is a −17.50% fall, over the last year Sharda Motor Industries Ltd. has showed a −6.28% decrease.
SHARDAMOTR reached its all-time high on Jul 9, 2024 with the price of 1,476.05 INR, and its all-time low was 38.05 INR and was reached on Mar 13, 2020. View more price dynamics on SHARDAMOTR chart.
See other stocks reaching their highest and lowest prices.
See other stocks reaching their highest and lowest prices.
SHARDAMOTR stock is 4.93% volatile and has beta coefficient of 0.90. Track Sharda Motor Industries Ltd. stock price on the chart and check out the list of the most volatile stocks — is Sharda Motor Industries Ltd. there?
Today Sharda Motor Industries Ltd. has the market capitalization of 55.68 B, it has increased by 1.89% over the last week.
Yes, you can track Sharda Motor Industries Ltd. financials in yearly and quarterly reports right on TradingView.
SHARDAMOTR net income for the last quarter is 746.95 M INR, while the quarter before that showed 999.40 M INR of net income which accounts for −25.26% change. Track more Sharda Motor Industries Ltd. financial stats to get the full picture.
Yes, SHARDAMOTR dividends are paid annually. The last dividend per share was 32.50 INR. As of today, Dividend Yield (TTM)% is 1.68%. Tracking Sharda Motor Industries Ltd. dividends might help you take more informed decisions.
Sharda Motor Industries Ltd. dividend yield was 2.06% in 2024, and payout ratio reached 29.87%. The year before the numbers were 0.73% and 9.84% correspondingly. See high-dividend stocks and find more opportunities for your portfolio.
As of Dec 8, 2025, the company has 4.25 K employees. See our rating of the largest employees — is Sharda Motor Industries Ltd. on this list?
EBITDA measures a company's operating performance, its growth signifies an improvement in the efficiency of a company. Sharda Motor Industries Ltd. EBITDA is 3.95 B INR, and current EBITDA margin is 14.27%. See more stats in Sharda Motor Industries Ltd. financial statements.
Like other stocks, SHARDAMOTR shares are traded on stock exchanges, e.g. Nasdaq, Nyse, Euronext, and the easiest way to buy them is through an online stock broker. To do this, you need to open an account and follow a broker's procedures, then start trading. You can trade Sharda Motor Industries Ltd. stock right from TradingView charts — choose your broker and connect to your account.
Investing in stocks requires a comprehensive research: you should carefully study all the available data, e.g. company's financials, related news, and its technical analysis. So Sharda Motor Industries Ltd. technincal analysis shows the strong sell today, and its 1 week rating is sell. Since market conditions are prone to changes, it's worth looking a bit further into the future — according to the 1 month rating Sharda Motor Industries Ltd. stock shows the buy signal. See more of Sharda Motor Industries Ltd. technicals for a more comprehensive analysis.
If you're still not sure, try looking for inspiration in our curated watchlists.
If you're still not sure, try looking for inspiration in our curated watchlists.