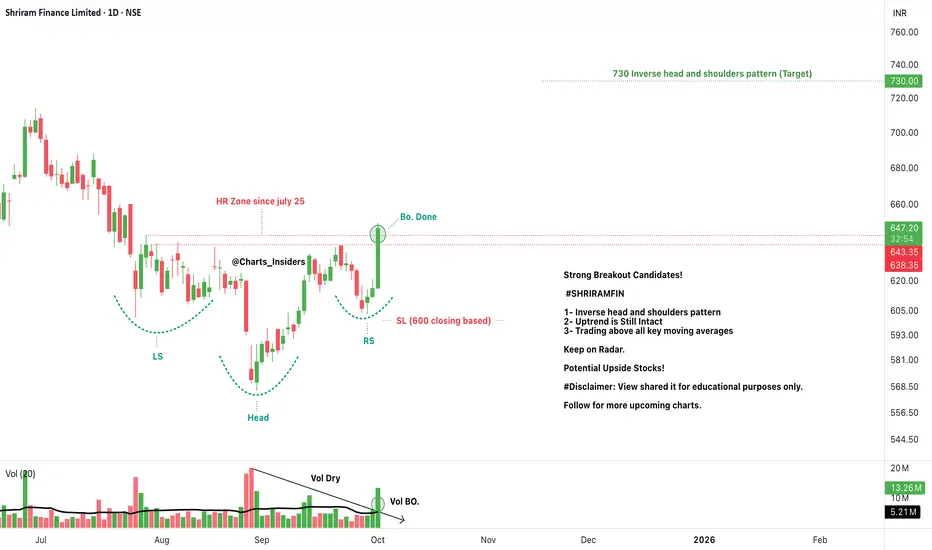
SHRIRAMFINStrong Breakout Candidates!
#SHRIRAMFIN
1- Inverse head and shoulders pattern
2- Uptrend is Still Intact
3- Trading above all key moving averages
Keep on Radar.
Potential Upside Stocks!
#Disclaimer: View shared it for educational purposes only.
Follow for more upcoming charts.
SHRIRAMFIN trade ideas
SHRIRAMFIN NSE:SHRIRAMFIN Stock is formed inverted head and shoulders pattern now its taking a retracement level.
Buy above 638 Rupees,
Target 1 is 655 Rupees,
Target 2 is 670 to 680 Rupees,
Stoploss below 600 Rupees (one day candle closed)
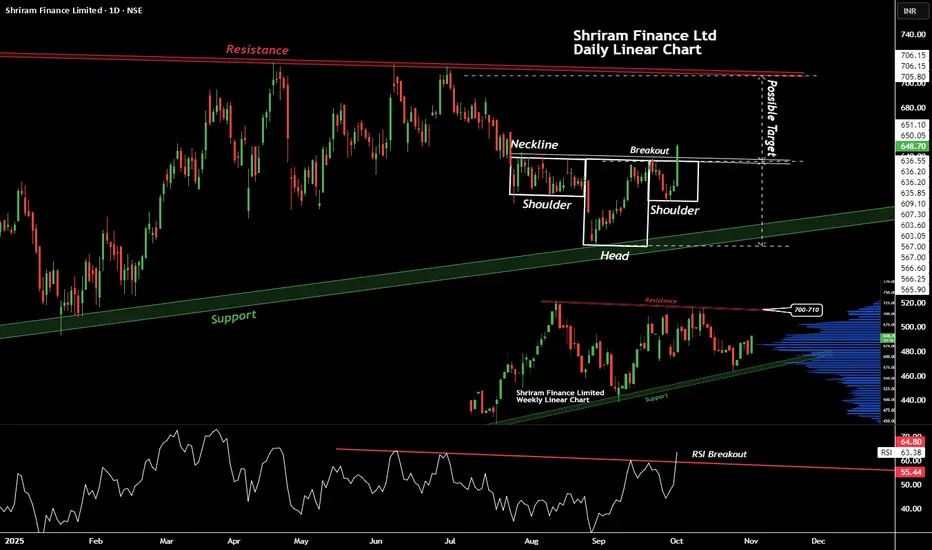
Shriram Finance Ltd, Breakout of Head & Shoulder patternWe can witness curious case of Mother pattern and a Child pattern here. In the caption image (right lower corner) we can see a bullish pattern of Ascending Triangle (not counting waves at the moment), to complete present wave stock must reach 700 to 710 levels, we can confirm same with child pattern of Head & Shoulder. Positive things about this stock are:-
Stock bouncing back from weekly support zone (Mother Pattern).
There is a breakout (Child Pattern).
Bullish with Momentum breakout (Child Pattern).
RSI breakout on daily timeframe, approving momentum.
Highest Volume activity (Mother Pattern), traders are taking interest.
Target of Child Pattern confirms with Resistance boundaries of Mother Pattern.
Though there is an EMA support on Mother pattern, not visible here as i checked it later.
Shriram Finance Ltd is a quality F&O stock, one can add on retest or at current prices for the small target of 700-710 in coming times. Always prepare for worse, in case of some bad news, some geo-political event or volatility, always apply some logical stoploss, you can go for HA lows or Swing lows.
Thanks, Happy Trading.
SHRIRAM FINANCE LIMITED ( 1D ) 🔑 KEY LEVELS 🔑
✔ Fibonacci Retracement 50%
✔ Trend Line Act as Resistance.
✔ RSI Also Overbought Zone.
🎯 TRADING PLAN 🎯
✔ Near the key levels , Bearish Engulfing
Candlestick Pattern has formed.
✔ The Entry Point is @ 625.45
✔ The Stoploss Point is @ 638.00
✔ The First Target is @ 577.00
✔ The Second Target is @ 553.00
💡 A Trader must be Strategic , Patience ,
Confident , Discipline & Protective. Like
A Lion.
Disclaimer : All Information is for
Educational & Informational
Purpose Only. Not a Buy / Sell
Recommendation. You are
Solely responsible for your
Trading & Investment
Decisions.

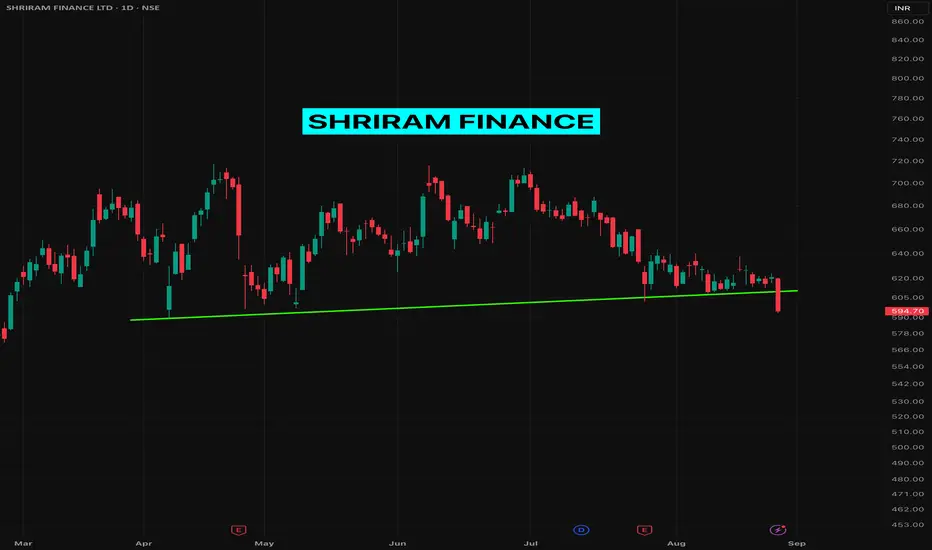
Shriram Finance BREAKING DOWN a #TrendlineSupport Shriram Finance BREAKING DOWN a TrendlineSupport with quite decent volume.
I am looking at the daily time frame here and filled some SHORT position today before the closing bell.
Big Move Coming? Watch This Classic VCP Setup on Shriram FinanceHello everyone, i hope you all will be doing good in your trading and your life as well. Today i have brought a setup which name is VCP (Volatility Contraction Pattern) is one of the most powerful base setups, where the price contracts in multiple tight ranges, showing controlled strength. It signals that supply is drying up and the stock is getting ready for a strong move, usually a breakout. What makes it special is the combination of tightening price with lowering volume , and that's exactly what we can observe in Shriram Finance right now.
The stock has taken multiple supports from key EMAs like 9, 21, and 50 during this entire consolidation, a classic VCP sign. With each dip being bought quickly and bounce getting tighter, the stock is preparing for a potential breakout move.
Keep this one on radar , structure is clean, volume behavior is ideal, and if momentum comes, VCP patterns don’t disappoint.
For levels and risk-reward, please refer the chart above.
Disclaimer: This analysis is for educational purposes only. Please consult a financial advisor before making investment decisions.

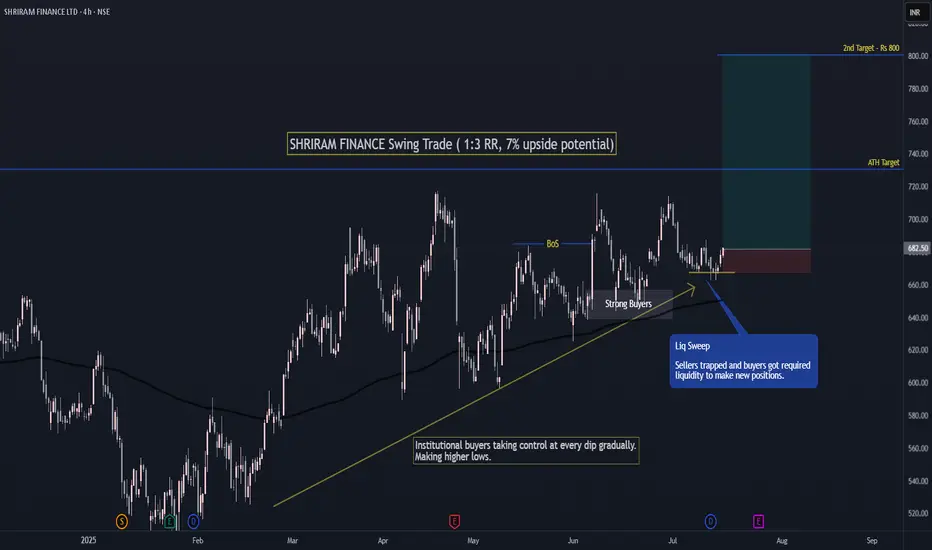
SHRIRAM FINANCE Swing Trade ( 1:3 RR, 7% upside potential)1st Target at ATH with 1:3 RR and 7% upside.
2nd Target at psychological level of 800.
If Nifty holds current level of 25000 then Shriram Finance can make a new ATH.
Institutions have gradually bought the stock at every dip making higher lows continuously.
Recently sellers got trapped which can start a new up-move.
Follow me for more such simple trades.
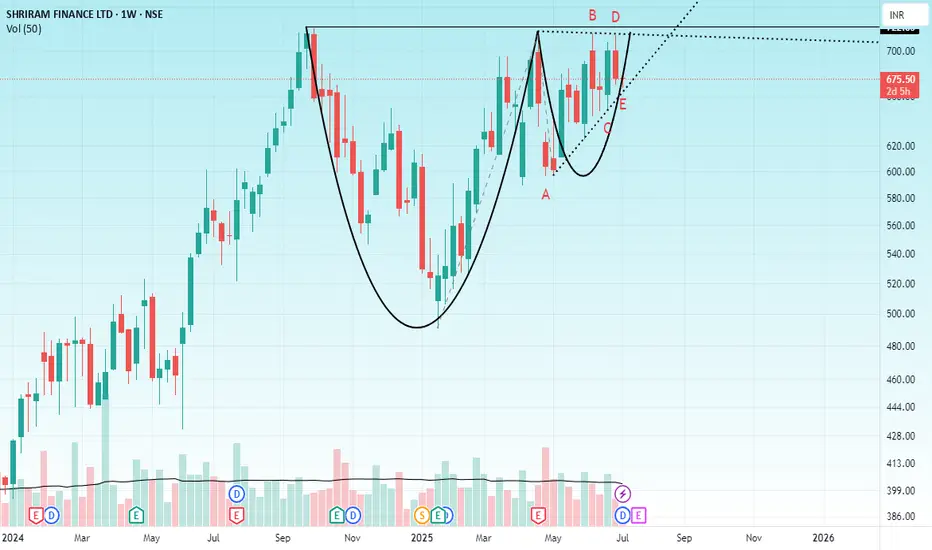
SHRIRAM FINANCEHello & welcome to this analysis
After a very strong uptrend the stock went into a consolidation to form a cup & handle pattern, the handle being completed now in the form of a triangle.
As long as it does not break below 640 it has a high probability of breaking above the trendline at 700 for targets of 800 / 875 / 950
Good risk reward set up at the moment.
All the best


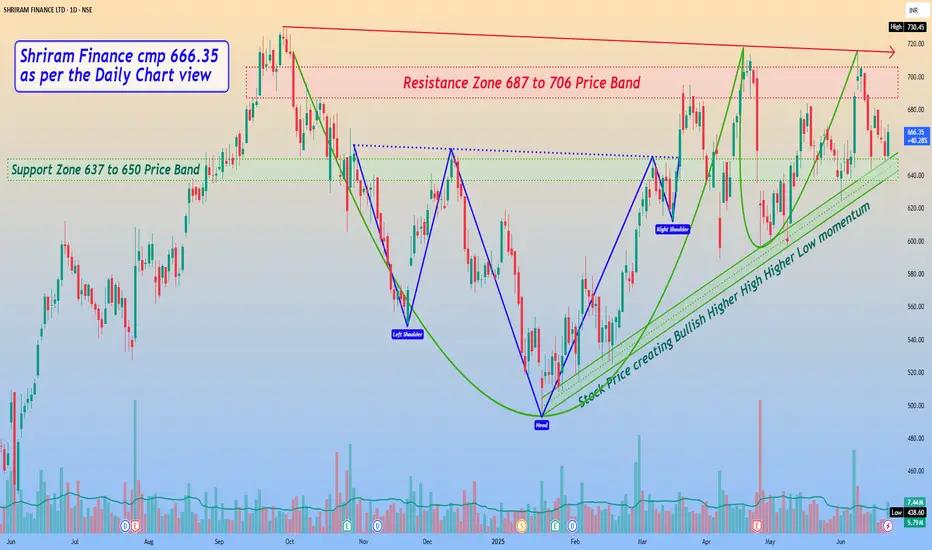
Shriram Finance cmp 666.35 by Daily Chart view*Shriram Finance cmp 666.35 by Daily Chart view*
- Support Zone 637 to 650 Price Band
- Resistance Zone 687 to 706 Price Band
- *Stock Price creating Bullish Higher High Higher Low momentum*
- Volumes are seen to be in good sync with average traded quantity
- *Price seems testing and retesting the Support Zone over last week*
- Stock made few failed attempts to cross the ATH 730.45 and reversed
- Falling Resistance Trendline and Resistance Zone are good hurdles to crossover
- *Bullish Rounding Bottoms above Resistance Zone neckline and considerate Head & Shoulders is seen*
SHRIRAMFIN - Weekly AnalysisIn the Weekly Chart of SHRIRAMFIN ,
we can see that, it is ready for Cup & Handle breakout.
Let it retest and then enter with SL and Targets.
Expected momentum is shown in chart.

Shriram Finance – Potential Breakout or False Alarm?
Technical Overview 📈
✅ Uptrend intact – The stock has been taking support at a long-term trendline and briefly fell out during the correction. Now, it has reclaimed the trendline.
✅ Breakout from a Cup & Handle pattern – A bullish pattern indicating possible upside.
✅ Volume picking up – Still needs more confirmation for strength.
✅ Golden Crossover possible – If recent lows hold, further upside can trigger a 50 & 200 DMA crossover.
✅ Sector strength – The finance sector index is trading above key DMAs, showing resilience.
Fundamental Snapshot 💰
Revenue Growth: 📈 Increasing YoY
EPS Growth: 📈 Improving
Profit Growth: 🚀 23.4% CAGR over the last 5 years
Healthy Dividend Payout: 21.6%
Market Cap: ₹1,26,653 Cr
Stock P/E: 15.6
Book Value: ₹279
Dividend Yield: 1.34%
ROCE: 11.3% | ROE: 15.9%
Face Value: ₹2
⚠️ Risk Factors:
Low Interest Coverage Ratio
Market Volatility – Could still be forming Lower Highs - Lower Lows (LL-LH) structure.
Volume Needs to Improve for stronger confirmation.
(Source: Screener.in)
Risk-Reward Calculation 🎯
1️⃣ Early Entry (₹695.1)
Stop Loss (SL): ₹607 (-12.65%)
Target: ₹890.8 (+28.12%)
Risk-to-Reward (R:R) = 1:2.22 ✅
2️⃣ Safe Entry (₹732.35)
Stop Loss (SL): ₹607 (-17.08%)
Target: ₹890.8 (+21.7%)
Risk-to-Reward (R:R) = 1:1.27 ✅
💡 Conclusion:
Early Entry (1:2.22) offers a better reward potential but has a higher risk of pullback.
Safe Entry (1:1.27) is more conservative but offers a lower reward.
Conclusion & Trading Plan 🎯
🔹 No need to rush in! Gradual accumulation is a wiser approach at this stage.
🔹 Risk Management is Key! This could be a false breakout or a pullback trap. Wait for confirmation.
🔹 Volume confirmation is essential – Without strong volume, the move might fail.
📢 Educational Idea | Not a Trade Recommendation 📢
This setup is shared to alert traders of a potential winner once the market settles. Not all setups play out, and only 5-6 out of 10 might succeed. Hence, risk management and position sizing are key. 📉📊
📢 Disclaimer: This post is for educational purposes only. It is NOT financial advice. All trades carry risk, and market conditions can change. Do your own research and manage risk accordingly.

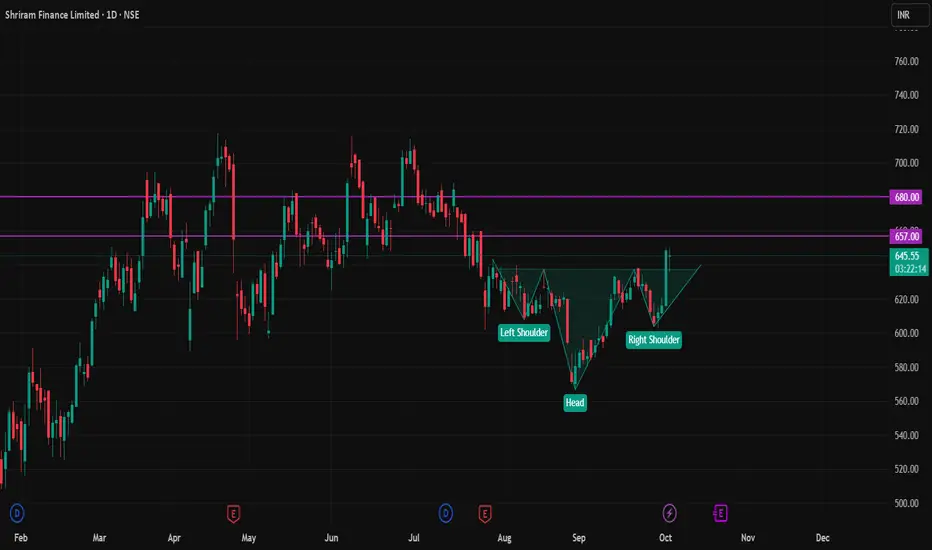
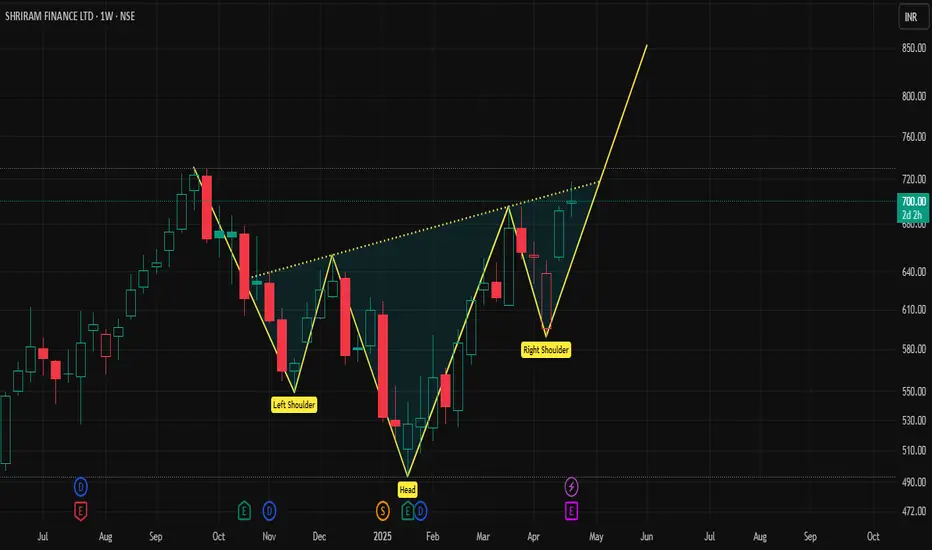
SRIRAM FINANCE TRYING TO FORM INVERSE HEAD AND SHOULDERLook at this char SHIRAM FINANCE forming inverse head and shoulder in it's WEEKLY chart.We have to wait for breakout.it is still inside of its neck line.
SHRIRAMFIN Swing Trade (14.6%)After forming a Head & Shoulder pattern, retail sellers got trapped and that becomes the liquidity for next up-move from the institutional demand zone. So the trend is up.
Recently good liquidity sweep happened which can fuel next up-move in short term.
With 1:3 Risk Reward and potential 14.6% up-move.
Only if Nifty holds current levels. ie it does not go below 22,700. Otherwise exit this trade.
Follow for more such setups, comment your thoughts.

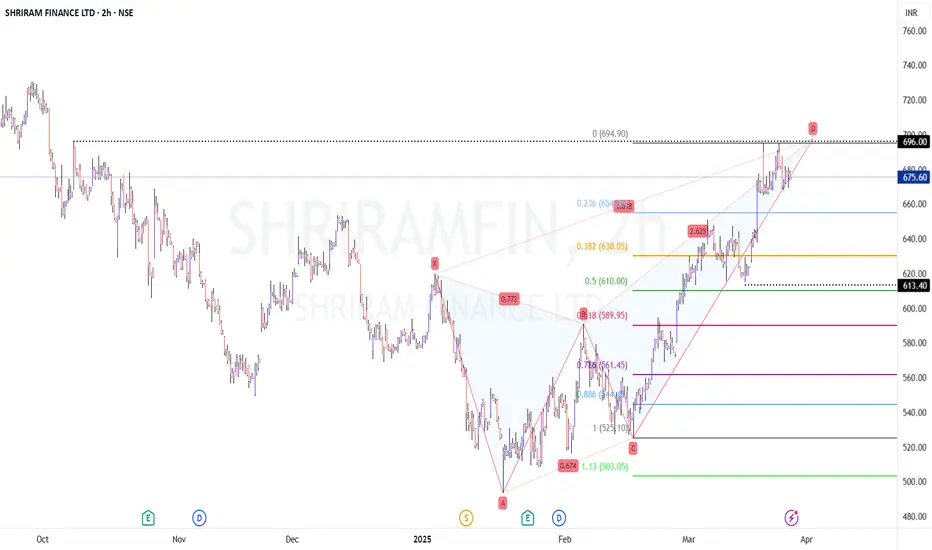
SHRIRAMFIN - Approaching PRZ - Bearish Crab Harmonic PatternThe PRZ is at 690-700 and the price is now trading at 675
Approaching the PRZ of Bearish Crab/Bearish Deep Crab Pattern
Ideally, one can expect a Pullback of 50% of the CD leg, which is at 620-610 levels.
At around 690-700, this is a very good LRHR set up/entry.
On my watchlist for April
Disclaimer: I am not a SEBI registered Analyst and this is not a trading advise. Views are personal and for educational purpose only. Please consult your Financial Advisor for any investment decisions. Please consider my views only to get a different perspective (FOR or AGAINST your views). Please don't trade FNO based on my views. If you like my analysis and learnt something from it, please give a BOOST. Feel free to express your thoughts and questions in the comments section.
BUY TODAY SELL TOMORROW for 5% DON’T HAVE TIME TO MANAGE YOUR TRADES?
- Take BTST trades at 3:25 pm every day
- Try to exit by taking 4-7% profit of each trade
- SL can also be maintained as closing below the low of the breakout candle
Now, why do I prefer BTST over swing trades? The primary reason is that I have observed that 90% of the stocks give most of the movement in just 1-2 days and the rest of the time they either consolidate or fall
Trendline Breakout in SHRIRAMFIN
BUY TODAY SELL TOMORROW for 5%

wait for a correction to buyShriram Fin CMP 670
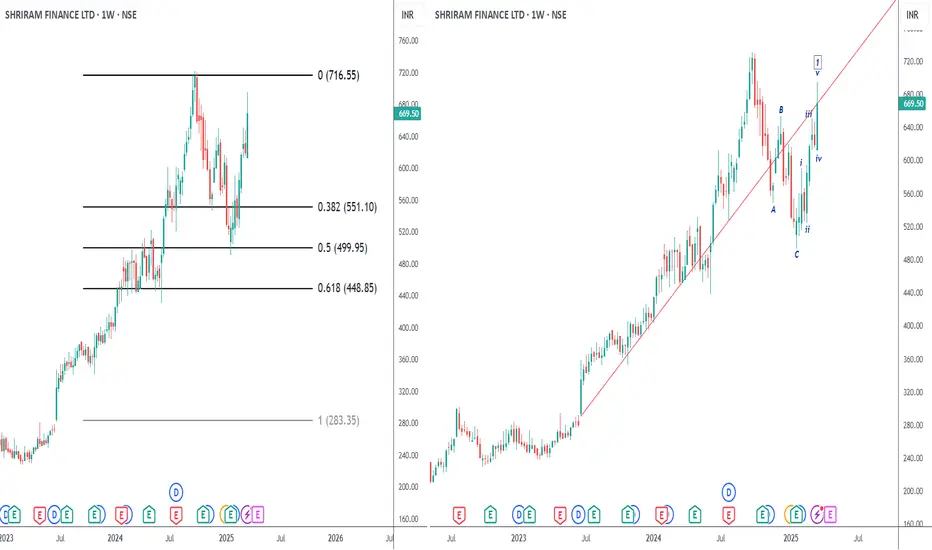
Elliott- The ABC correction of a bullish zig zag finished at 500. The main question post a corrective pattern is ,will it produce another corrective pattern or an impulse wave. Here we see it has produced an impulse wave. The dip post this will be wave 2, which should tentatively end around the 560/580 zone.
Fibs- the dip to 50% is strength.
Trendline - A weekly close below the trendline will confirm that wave 1 of the impulse wave is indeed over.
Conclusion - wait for the dip to buy this counter. Coz post the correction wave 3 which is the strongest and lifts like a rocket will begin.

Shriram Finance shows Great Strength"SF" shows outperformance compared to nifty ,there is huge probability that Shriram finance will continue to do well , if Nifty starts recovering

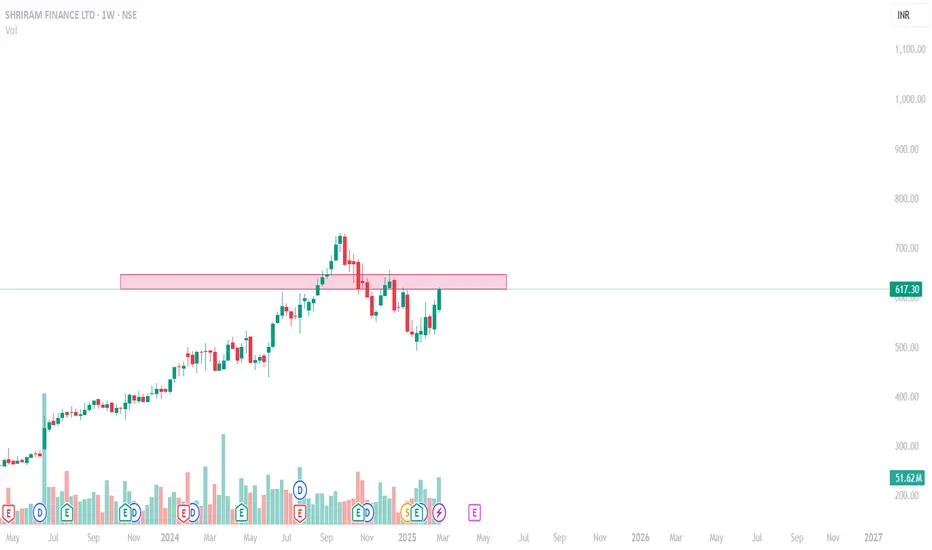
Shriram Finance Nears Breakout: Key Targets AheadShriram Finance Ltd (SHRIRAMFIN) is nearing its breakout level of ₹660, with the stock currently priced at ₹617. A move above ₹660 could indicate a potential upward trend. Key levels to watch after the breakout are ₹680, ₹700, and ₹750.
Shriram Finance Ltd Stock Analysis**GlobalTradeHub | Shriram Finance Ltd Stock Analysis**
**Fundamental Analysis:**
Shriram Finance, a leading NBFC in India, specializes in vehicle and MSME financing. Strong loan growth, improving asset quality, and steady NIMs support its fundamentals. However, risks include higher NPAs in the commercial vehicle segment and rising interest rates impacting borrowing costs.
**Technical Analysis:**
The stock is consolidating near ₹2,550 resistance. A breakout could push it toward ₹2,700. Strong support is at ₹2,400; a breakdown may lead to ₹2,250. RSI near 58 suggests moderate bullish momentum.
**Key Levels:**
- **Resistance:** ₹2,550 / ₹2,700
- **Support:** ₹2,400 / ₹2,250
**Conclusion:**
Shriram Finance remains a fundamentally strong NBFC. A breakout above ₹2,550 could drive further upside, while support levels offer potential buy zones. 📈🚀

SHRIRAMFIN - Breakout Stock SHRIRAMFIN – Breakout Stock Analysis
🔹 Strong Momentum – The stock is showing a robust upward movement, indicating sustained buying interest and bullish sentiment.
🔹 Volume Surge – A significant increase in volume confirms strong participation, validating the breakout and signaling potential continuation of the trend.
🚨 Disclaimer: This analysis is for educational purposes only and not a recommendation to buy or sell. Please conduct your own research before making any investment decisions.
