SIEMENS TRIANGLE BREAKOUTThe stock has had a steep rally and consolidated as an ascending triangle. Buy @ 1550-1555 with at stop loss below 1528 for targets of 1600.Longby dharmesh795760
Intraday: watch for range breakoutbuy SIEMENS above above 1556 and titan above 1440 Longby stockkar118
#SIEMENS WEEKLY CHART VIEW!!#SIEMENS WEEKLY CHART VIEW!! Siemens Ltd. witnessed a breakout from the weekly resistance zone and now trading right below another resistance zone of 1540-1560 zone. Likely to see further strength above the hourly close of 1565 level. Technical parameters look positive as of now. Keep a watch.by Pearl_Kaur5
siemens I A stock full of price patterns wow stock still upwards momentum is onnn . . . happy trading & investing god bless you Longby KINGJAMES-KNIGHT0
Siemens - Bullish Breakout with Ultra High VolumeNote: This is for educational purpose only. There seems to be a bullish breakout with ultra high volume from both rising channel as well as breakout from long term support turned resistance. RSI is above 70 so there will be a consolidation/ side ways movement before the next up move.Longby kalyanganguly3
Siemens - EducationSuggested on 1300 Now 1500+ Next 1560, 1600. No personal suggestion for any buy sellby iamlearner1
Siemens:: Saucer FormationSaucer formation is observed in Siemens which traders can check for a breakout or wait for handle formation to complete cup and handle pattern.Longby vipin_krishnanUpdated 1
#SIEMENS WEEKLY CHART VIEW!!#SIEMENS WEEKLY CHART VIEW!! Siemens Ltd. witnessed profit booking in the last session and any pullback to the breakout area of 1290-1310 zone may be looked upon as a buying opportunity as per risk reward setup. Probable resistance comes at 1470 level. Keep a watch. by Pearl_Kaur2
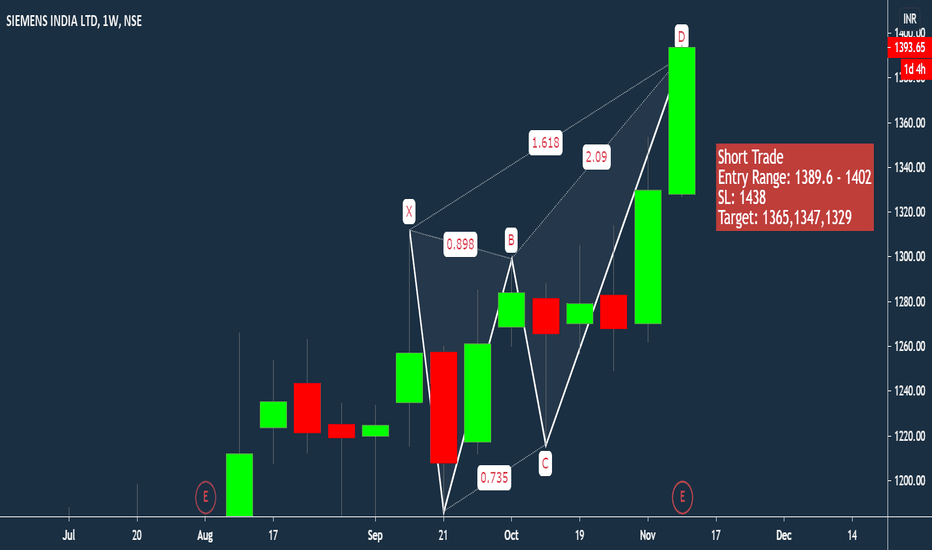
[PRZ] Siemens Short TradeShort Trade Entry Range: 1389.6 - 1402 SL: 1438 Target: 1365,1347,1329Shortby unofficed2
Siemens long entryBuy Siemens above 1340 TGT 1345-1348-1352 SL 1333Longby Tech_stock_traderUpdated 221
SIEMENS INDIA LTD - ASCENDING TRIANGLE BREAKOUTTARGET ON THE CHART. Disclaimer : The opinions and analysis expressed herein are for informational and educational purposes only and should not be considered as individual investment advise or recommendations. I am not your financial advisor. Risk it for Biscuit. Longby sureshsehrawatUpdated 3
Siemens : Long term Resistance now act as a Supporta. Zone: Strong Bull b. Resistance 1: 1339.85 c. Resistance 2: 1352.50 d. Support 1: 1264 e. Support 2: 1251.35 NSE:SIEMENSLongby Traderanit1
SIEMENS, DONOT MISS THIS BUY OPPORTUNITY (CHART# 350)SIEMENS have formed a beautiful text book Ascending triangle pattern and has given closing at neck line. This is high probability setup for tomorrow above 1315 level. Watch my other charts to understand simple price action used for all of the analysis. Keep your charts simple and free from lagging indicators. Reach out if you wish to learn powerful technical analysis based on simple price action. Thanks Piyush GuptaLongby Piyush-Gupta4457
#SIEMENS CASH : LOOKS GOOD ABOVE 1295.10#SIEMENS CASH 29.10.2020 Looks good above 1295.10 stoploss 1285 Target 1305/1318-1320 cmp 1289Longby anandnst1
SIEMENS - bearish channel pattern formationbearish channel pattern formation spotted in the stockShortby theapextrader70
#Oct16 - Siemens (intraday) - Channel patternA channel breakout possible today or in the days to come. Buy above 1248 Sell below 1226 Note: Avoid the stock if a big gap up or gap down is seen Enter after the breakout happens and not before it Do not chase the market, i.e., do not get involved in late entries Only enter with strict stop-loss and target This is not a recommendation and is for educational purposes only. always follow risk-reward and quantity management for the 100% of the times The above mentioned idea may not work, so beware of the risk you are taking Follow me on tradingview to get such intraday and swing picks everyday. Happy Trading!! by FAHEEMSAM1