SIGACHI Price ActionSigachi Industries Ltd is currently trading near ₹38.8 after facing a significant decline over the past year. The price movement remains sideways in the short term, with the stock trading close to its 52-week low of ₹30.51 and resistance around ₹43.80. The overall trend is weak, and the stock contin
Sigachi Industries Limited
35.58INRR
+0.25+0.71%
At close at Nov 14, 10:24 GMT
INR
No trades
Next report date
≈
February 4
Report period
Q2 2024
EPS estimate
—
Revenue estimate
—
−1.35 INR
695.63 M INR
4.88 B INR
185.16 M
About Sigachi Industries Limited
Sector
Industry
CEO
Amit Raj Sinha
Website
Headquarters
Hyderabad
Founded
1989
ISIN
INE0D0K01022
FIGI
BBG013BNN2R0
Sigachi Industries Ltd. engages in the manufacture and sale of microcrystalline cellulose. Its product is used as an excipient for finished dosages in the pharmaceutical, food, nutraceuticals, and cosmetic industries, as a stabilizer, anti-caking agent, fat substitute, and emulsifier in food industry and as a fat substitute, thickener, and binder in cosmetics. The company was founded on January 11, 1989 and is headquartered in Hyderabad, India.
−90%
−60%
−30%
0%
30%
Q2 '24
Q3 '24
Q4 '24
Q1 '25
Q2 '25
−1.40 B
−700.00 M
0.00
700.00 M
1.40 B
Revenue
Net income
Net margin %
Revenue
COGS
Gross profit
Op expenses
Op income
Non-Op income/ expenses
Taxes & Other
Net income
0.00
300.00 M
600.00 M
900.00 M
1.20 B
Revenue
COGS
Gross profit
Expenses & adjustments
Net income
0.00
300.00 M
600.00 M
900.00 M
1.20 B
Q2 '24
Q3 '24
Q4 '24
Q1 '25
Q2 '25
0.00
450.00 M
900.00 M
1.35 B
1.80 B
Debt
Free cash flow
Cash & equivalents

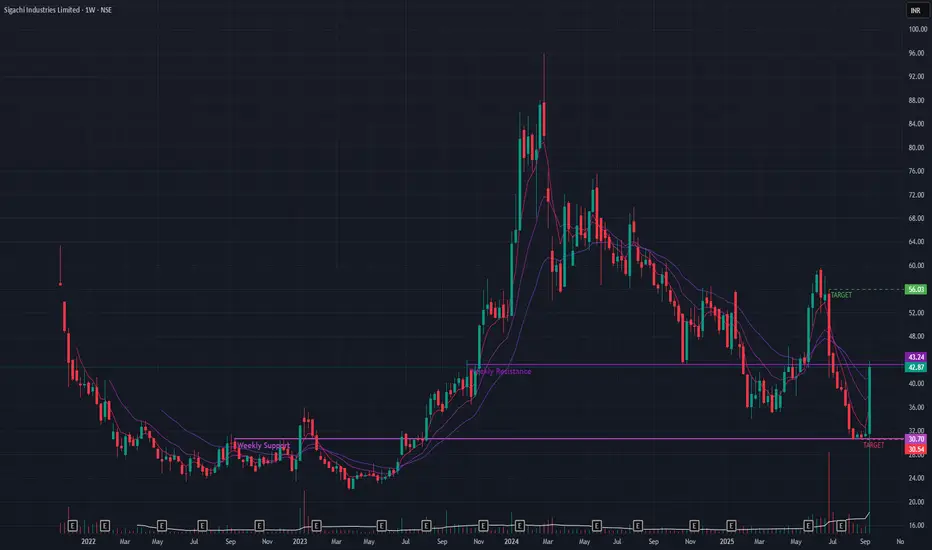
Sigachi’s Technical Surge: Next Resistance in SightOver the past month, Sigachi traded within a well-defined consolidation range, reflecting a period of equilibrium between buyers and sellers. However, in the most recent week, the stock decisively broke out above this consolidation zone on increased trading volume a classic signal of renewed bulli

Sigachi Ind (Weekly Timeframe) - Is this the trend reversal?After a period of decline following its February 2024 peak, Sigachi Industries has shown a dramatic burst of momentum. However, the stock has now reached a critical juncture, and confirmation is required to suggest a sustainable trend reversal.
## Recent Price Action
A massive +36.27% rally las
SIGACHI LONGThe Elliott Wave Theory's description of the structure and pattern of price movements in financial markets is known as the Elliott Wave Structure.
The Elliott Wave analysis indicates that the stock has completed waves (i) and (ii) which are shown as black circle numbers on the daily chart. Wave (ii


Price Action Case Study: Weekly Price action chart of SIGACHI 🔹 Key Structural Elements:
-White Solid Line: Primary Counter-Trendline (CT) connecting multiple swing highs, acting as dynamic resistance over several months.
-White Dotted Lines: Hidden supply lines derived from intermediary highs, often acting as secondary resistance.
-Yellow Lines: Higher time

SIGACHI INDUSTRIES LTDAs of May 29, 2025, Sigachi Industries Ltd. (NSE: SIGACHI) is trading at ₹50.35, reflecting a 6.95% increase over the previous close.
📊 Daily Support & Resistance Levels
Based on the latest technical analysis, the key support and resistance levels for Sigachi Industries Ltd. are as follows:
Suppo

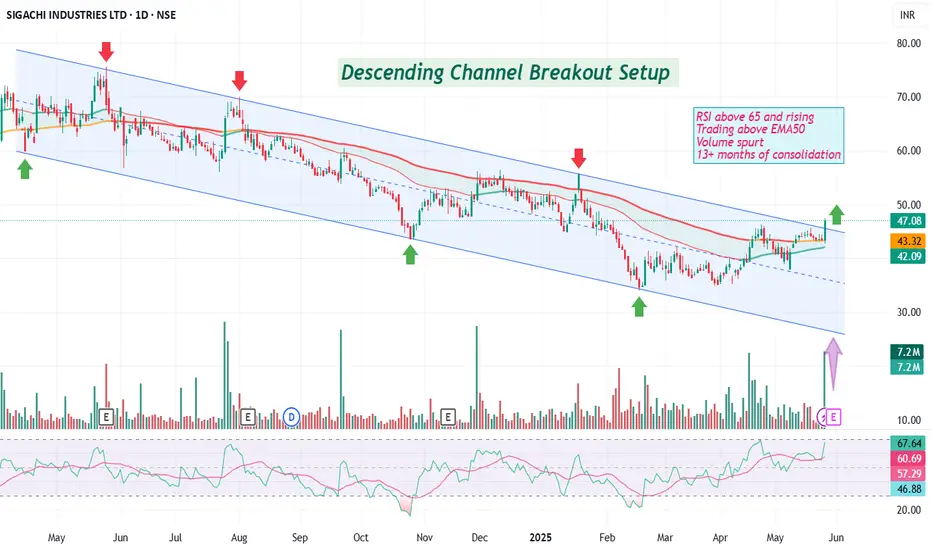
Breakout in Sigachi Sigachi Industries is one of the largest manufacturers of Microcrystalline Cellulose worldwide and has three Multi locational Facilities in Telangana and Gujarat.
Breakout Screener:
Descending Channel Breakout Setup
RSI above 65 and rising
Trading above EMA50
Volume spurt
13+ months of consolida
SIGACHI (Sigachi Industries Ltd)- AnalysisBullish Levels -day closing above 53 (early entry risky) then 63 to 72 (safe entry if day closing above this) first target is areond 82 then 92 and then 102 if sustains above this then long term targets can be around 800 some intermittent targets are marked on chart
Bearish levels :- Day closing b

See all ideas
Summarizing what the indicators are suggesting.
Oscillators
Neutral
SellBuy
Strong sellStrong buy
Strong sellSellNeutralBuyStrong buy
Oscillators
Neutral
SellBuy
Strong sellStrong buy
Strong sellSellNeutralBuyStrong buy
Summary
Neutral
SellBuy
Strong sellStrong buy
Strong sellSellNeutralBuyStrong buy
Summary
Neutral
SellBuy
Strong sellStrong buy
Strong sellSellNeutralBuyStrong buy
Summary
Neutral
SellBuy
Strong sellStrong buy
Strong sellSellNeutralBuyStrong buy
Moving Averages
Neutral
SellBuy
Strong sellStrong buy
Strong sellSellNeutralBuyStrong buy
Moving Averages
Neutral
SellBuy
Strong sellStrong buy
Strong sellSellNeutralBuyStrong buy
Displays a symbol's price movements over previous years to identify recurring trends.
Frequently Asked Questions
The current price of SIGACHI is 35.58 INR — it has increased by 0.71% in the past 24 hours. Watch Sigachi Industries Limited stock price performance more closely on the chart.
Depending on the exchange, the stock ticker may vary. For instance, on NSE exchange Sigachi Industries Limited stocks are traded under the ticker SIGACHI.
SIGACHI stock has risen by 0.91% compared to the previous week, the month change is a −6.12% fall, over the last year Sigachi Industries Limited has showed a −30.03% decrease.
SIGACHI reached its all-time high on Feb 27, 2024 with the price of 95.90 INR, and its all-time low was 21.98 INR and was reached on Mar 29, 2023. View more price dynamics on SIGACHI chart.
See other stocks reaching their highest and lowest prices.
See other stocks reaching their highest and lowest prices.
SIGACHI stock is 2.43% volatile and has beta coefficient of 1.40. Track Sigachi Industries Limited stock price on the chart and check out the list of the most volatile stocks — is Sigachi Industries Limited there?
Today Sigachi Industries Limited has the market capitalization of 13.60 B, it has increased by 1.56% over the last week.
Yes, you can track Sigachi Industries Limited financials in yearly and quarterly reports right on TradingView.
Sigachi Industries Limited is going to release the next earnings report on Feb 4, 2026. Keep track of upcoming events with our Earnings Calendar.
SIGACHI net income for the last quarter is 106.89 M INR, while the quarter before that showed −1.00 B INR of net income which accounts for 110.65% change. Track more Sigachi Industries Limited financial stats to get the full picture.
Yes, SIGACHI dividends are paid annually. The last dividend per share was 0.10 INR. As of today, Dividend Yield (TTM)% is 0.28%. Tracking Sigachi Industries Limited dividends might help you take more informed decisions.
Sigachi Industries Limited dividend yield was 0.28% in 2024, and payout ratio reached 4.85%. The year before the numbers were 0.18% and 5.52% correspondingly. See high-dividend stocks and find more opportunities for your portfolio.
As of Nov 16, 2025, the company has 1.81 K employees. See our rating of the largest employees — is Sigachi Industries Limited on this list?
EBITDA measures a company's operating performance, its growth signifies an improvement in the efficiency of a company. Sigachi Industries Limited EBITDA is 933.60 M INR, and current EBITDA margin is 21.10%. See more stats in Sigachi Industries Limited financial statements.
Like other stocks, SIGACHI shares are traded on stock exchanges, e.g. Nasdaq, Nyse, Euronext, and the easiest way to buy them is through an online stock broker. To do this, you need to open an account and follow a broker's procedures, then start trading. You can trade Sigachi Industries Limited stock right from TradingView charts — choose your broker and connect to your account.
Investing in stocks requires a comprehensive research: you should carefully study all the available data, e.g. company's financials, related news, and its technical analysis. So Sigachi Industries Limited technincal analysis shows the strong sell today, and its 1 week rating is sell. Since market conditions are prone to changes, it's worth looking a bit further into the future — according to the 1 month rating Sigachi Industries Limited stock shows the sell signal. See more of Sigachi Industries Limited technicals for a more comprehensive analysis.
If you're still not sure, try looking for inspiration in our curated watchlists.
If you're still not sure, try looking for inspiration in our curated watchlists.