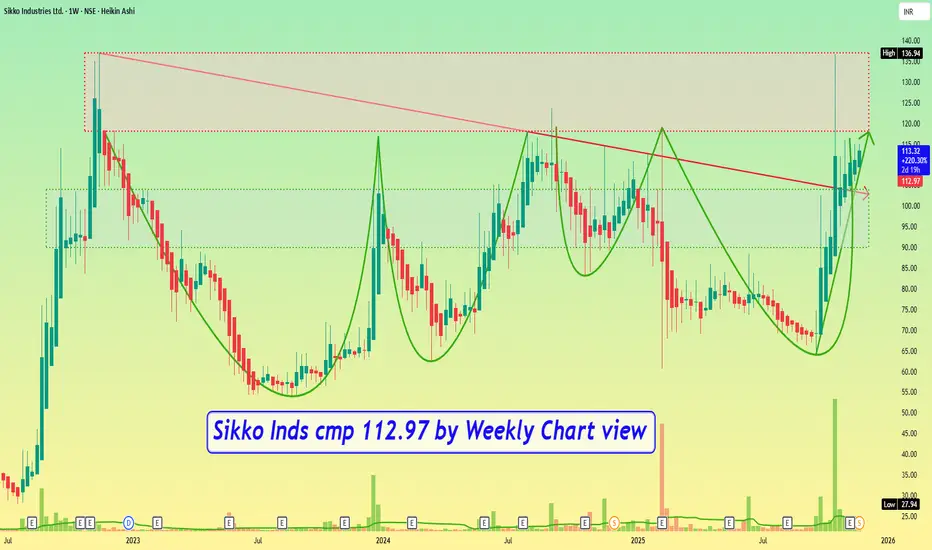
Sikko Inds cmp 112.97 by Weekly Chart viewSikko Inds cmp 112.97 by Weekly Chart view
- Support Zone 90 to 104 Price Band
- Resistance Zone 118 to ATH 136.94 Price Band
- Volumes in good sync with average traded quantity
- Bullish Rounding Bottoms by Resistance Zone neckline
- Resistance Zone holding strongly at each breakout attempts
Sikko Industries Ltd.
No trades
0.13 INR
42.67 M INR
612.98 M INR
About Sikko Industries Ltd.
Sector
Industry
CEO
Jayantibhai M. Kumbhani
Website
Headquarters
Ahmedabad
Founded
1997
IPO date
Apr 18, 2017
IPO offer price
0.48 USD
Identifiers
2
ISININE112X01025
Sikko Industries Ltd. engages in the business of manufacturing, trading, and export of bio-agro chemicals, pesticides, fertilizers, seeds, sprayers, packaging, machineries, and fast-moving consumer goods products. It also offers organic agricultural pesticides, fungicides, biochemical pesticides, fertilizers, and bio-pesticides. The company was founded by Jayantibhai Mohanbhai Kumbhani in 1997 and is headquartered in Ahmedabad, India.
Related stocks
SIKKO INDUSTRIES techno funda analysisSikko Industries Ltd. (NSE: SIKKO) is currently trading at INR 81.71, reflecting a moderate gain over recent months. The company specializes in agriculture chemicals, fertilizers, and biotech solutions, catering to sustainable farming and industrial needs.
Key Levels
Support Levels: INR 85.94, INR
Breakout in SIKKOSymmetrical Triangle Breakout Setup
RSI above 65 and rising
Trading above EMA50
Volume increasing
Disc: for study, not a recommendation

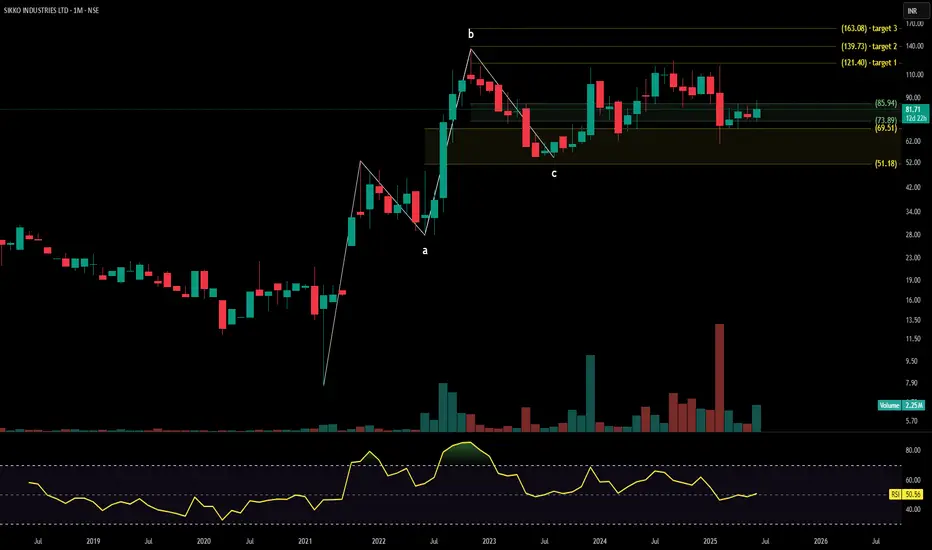
Sikko Industries is at perfect position to Buy and go long Analysis Done according to Elliott wave theory for holding period 6 to 12 months.
CMP is 103 on 29 October 2024
The correction has completed its Main wave 3 Subwave 2 and now Main wave 3 Subwave 3 is about to start and price can give us movement till 160 to 200 level so keep accumulating this sha

Sikko- unrestricted-daily-volume-growth-3-months-time-frame-veriSikko- unrestricted-daily-volume-growth-3-months-time-frame-veritas
1) Good level
2) Sloper decreasing
3) Ready to boom ...Multibagger

Triangle breakout- SIKKOTriangle breakout with volume spurt
Trading above EMA50 affirm uptrend
RSI above 70 and rising

See all ideas
Summarizing what the indicators are suggesting.
Oscillators
Neutral
SellBuy
Strong sellStrong buy
Strong sellSellNeutralBuyStrong buy
Oscillators
Neutral
SellBuy
Strong sellStrong buy
Strong sellSellNeutralBuyStrong buy
Summary
Neutral
SellBuy
Strong sellStrong buy
Strong sellSellNeutralBuyStrong buy
Summary
Neutral
SellBuy
Strong sellStrong buy
Strong sellSellNeutralBuyStrong buy
Summary
Neutral
SellBuy
Strong sellStrong buy
Strong sellSellNeutralBuyStrong buy
Moving Averages
Neutral
SellBuy
Strong sellStrong buy
Strong sellSellNeutralBuyStrong buy
Moving Averages
Neutral
SellBuy
Strong sellStrong buy
Strong sellSellNeutralBuyStrong buy
Displays a symbol's price movements over previous years to identify recurring trends.
Frequently Asked Questions
The current price of SIKKO is 5.68 INR — it has increased by 3.63% in the past 24 hours. Watch Sikko Industries Ltd. stock price performance more closely on the chart.
Depending on the exchange, the stock ticker may vary. For instance, on NSE exchange Sikko Industries Ltd. stocks are traded under the ticker SIKKO.
SIKKO stock has risen by 11.52% compared to the previous week, the month change is a 0.39% rise, over the last year Sikko Industries Ltd. has showed a 10.83% increase.
SIKKO reached its all-time high on Nov 14, 2022 with the price of 6.85 INR, and its all-time low was 0.38 INR and was reached on Mar 22, 2021. View more price dynamics on SIKKO chart.
See other stocks reaching their highest and lowest prices.
See other stocks reaching their highest and lowest prices.
SIKKO stock is 3.99% volatile and has beta coefficient of 1.48. Track Sikko Industries Ltd. stock price on the chart and check out the list of the most volatile stocks — is Sikko Industries Ltd. there?
Today Sikko Industries Ltd. has the market capitalization of 2.41 B, it has decreased by −2.86% over the last week.
Yes, you can track Sikko Industries Ltd. financials in yearly and quarterly reports right on TradingView.
SIKKO net income for the last quarter is 28.51 M INR, while the quarter before that showed 21.79 M INR of net income which accounts for 30.85% change. Track more Sikko Industries Ltd. financial stats to get the full picture.
Sikko Industries Ltd. dividend yield was 0.00% in 2024, and payout ratio reached 0.00%. The year before the numbers were 0.00% and 0.00% correspondingly. See high-dividend stocks and find more opportunities for your portfolio.
EBITDA measures a company's operating performance, its growth signifies an improvement in the efficiency of a company. Sikko Industries Ltd. EBITDA is 78.84 M INR, and current EBITDA margin is 10.82%. See more stats in Sikko Industries Ltd. financial statements.
Like other stocks, SIKKO shares are traded on stock exchanges, e.g. Nasdaq, Nyse, Euronext, and the easiest way to buy them is through an online stock broker. To do this, you need to open an account and follow a broker's procedures, then start trading. You can trade Sikko Industries Ltd. stock right from TradingView charts — choose your broker and connect to your account.
Investing in stocks requires a comprehensive research: you should carefully study all the available data, e.g. company's financials, related news, and its technical analysis. So Sikko Industries Ltd. technincal analysis shows the buy rating today, and its 1 week rating is strong buy. Since market conditions are prone to changes, it's worth looking a bit further into the future — according to the 1 month rating Sikko Industries Ltd. stock shows the strong buy signal. See more of Sikko Industries Ltd. technicals for a more comprehensive analysis.
If you're still not sure, try looking for inspiration in our curated watchlists.
If you're still not sure, try looking for inspiration in our curated watchlists.