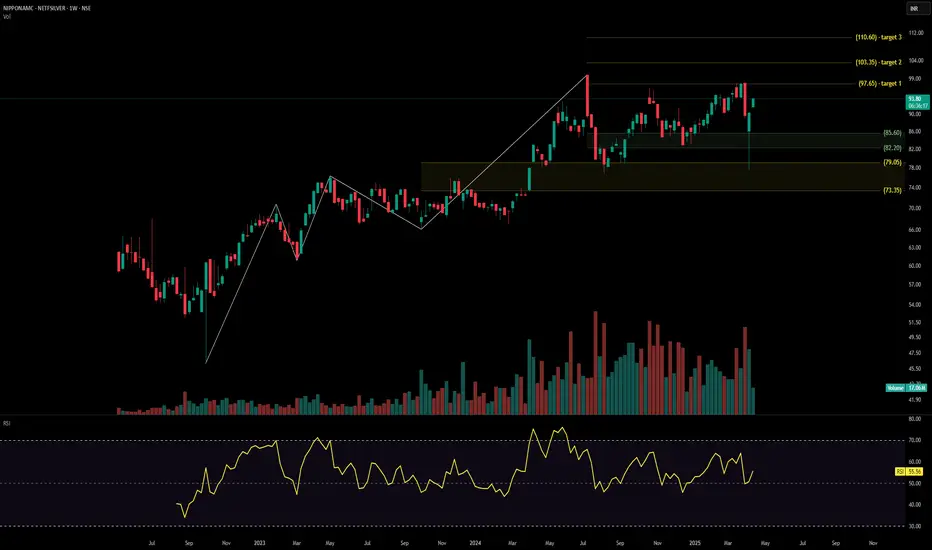
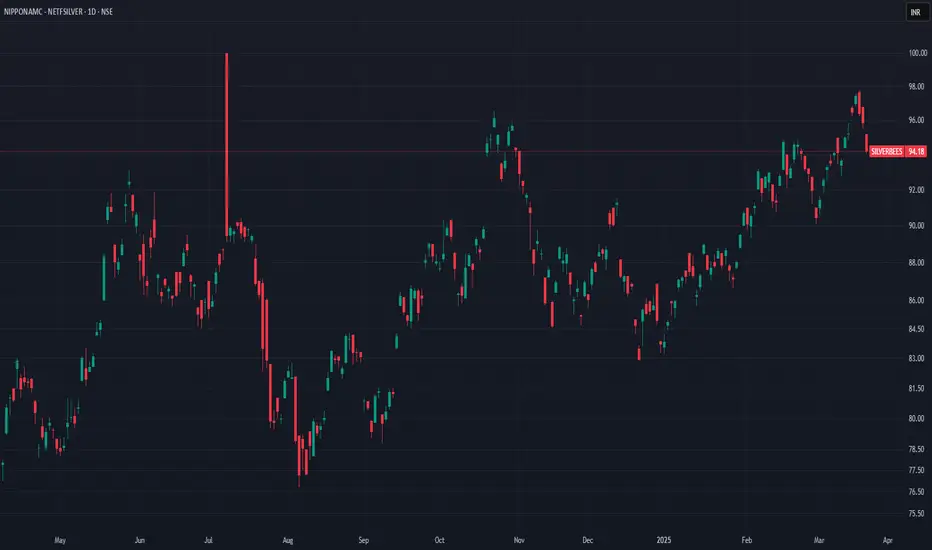
SILVERBEES ETF technical analysis Stock Overview: NIPPONAMC - NETFSILVER, listed on the Indian exchange, is currently priced at ₹93.80. This stock represents the Nippon India Silver ETF, which tracks the performance of silver, offering investors a commodity-linked investment avenue.
Key Levels:
Support Levels: ₹85.60, ₹82.20, ₹79.05, and ₹73.35.
Upside Swing Zone: ₹97.65 and ₹103.35.
Possible Upside Levels: ₹110.60.
Technical Indicators:
RSI (Relative Strength Index): Currently at 55.56, indicating that the stock is in a neutral momentum zone, neither overbought nor oversold. This suggests a balanced trading sentiment, with potential to move either way depending on market cues.
Volume: The stock shows a trading volume of 17.06 million, reflective of moderate investor activity. Consistent or spiking volumes could provide clues for trend continuation or reversal.
Sector and Market Context: The ETF's performance is closely tied to silver prices, which are influenced by global demand-supply dynamics, currency fluctuations, and macroeconomic factors. Within the broader commodity sector, silver has shown resilience amidst fluctuating market conditions, benefiting from its dual demand as both an industrial and precious metal. In the Indian market context, commodity-linked instruments like silver ETFs are gaining traction as investors diversify their portfolios.
Risk Considerations: Potential risks include high volatility in silver prices driven by geopolitical tensions, global economic uncertainty, and changes in industrial demand. Additionally, fluctuations in the Indian Rupee against major global currencies could affect returns. Adverse regulatory changes or taxation policies impacting commodity ETFs may also play a role.
Analysis Summary: NIPPONAMC - NETFSILVER offers an intriguing opportunity for investors seeking exposure to silver. The technical indicators suggest neutrality, allowing room for further analysis based on market and sector trends. Investors should remain vigilant about external factors like economic data, currency movements, and geopolitical developments that could influence silver prices and, consequently, the ETF’s performance.
SILVERBEES trade ideas
Gearing up for HSCL✅ HSCL (Himadri Speciality Chemical Ltd) is showing strong bullish momentum, backed by rising demand for specialty chemicals and carbon materials.
📈 The company’s recent capacity expansions and focus on EV battery chemicals are driving growth prospects.
💡 Increasing global graphite demand and specialty carbon products are boosting revenue potential.
🚀 With improving financials and positive market sentiment, the stock is poised for an upward breakout.
🔥 Technicals indicate strong buying interest, making HSCL a potential candidate for price appreciation.
best strategies for momentum trading Momentum trading is a strategy that involves buying assets (stocks, indices, commodities, etc.) that are trending upward and selling those that are trending downward. The idea is to capitalize on the momentum of an asset's price movement. Here's a detailed guide on some of the best strategies for momentum trading:
### **1. Trend Following Strategy**
This is the most common and widely used momentum strategy. The goal is to trade in the direction of the prevailing trend until there are signs of a reversal.
**Key Techniques:**
- **Moving Averages**: Use short-term moving averages (like the 10-day or 20-day) crossing over longer-term moving averages (like the 50-day or 200-day) to signal a trend.
- **ADX (Average Directional Index)**: The ADX measures the strength of a trend. A value above 25 indicates a strong trend. When the ADX rises, traders look for entries in the direction of the trend.
- **Entry and Exit**: Buy when the price is above the moving average and the ADX indicates a strong trend. Sell when the trend starts to show signs of weakness (e.g., when the price drops below the moving average).
**Pros**: Easy to follow, especially for beginner traders. Suitable for both short and long-term trades.
**Cons**: Can lead to false signals in choppy or sideways markets.
---
### **2. Breakout Strategy**
Momentum traders often enter positions when an asset breaks out of a key price level, such as a resistance or support level.
**Key Techniques:**
- **Price Levels and Consolidation**: Look for periods of consolidation where the price is moving within a defined range. The breakout occurs when the price moves above resistance (for long positions) or below support (for short positions).
- **Volume Confirmation**: High volume during the breakout confirms the momentum. A breakout with low volume might not sustain.
- **Entry and Exit**: Enter long when the price breaks above resistance with increased volume. Set stop-loss just below the breakout point or support level.
**Pros**: High potential for big moves when breakouts occur. Can be very profitable if the breakout leads to a significant trend.
**Cons**: False breakouts can lead to quick losses, especially in volatile markets.
---
### **3. Pullback/Retest Strategy**
This strategy focuses on entering the market during a pullback or retracement in a strong trend, rather than chasing the price after it has already moved significantly.
**Key Techniques:**
- **Fibonacci Retracements**: Use Fibonacci levels (38.2%, 50%, 61.8%) to identify potential support or resistance areas during a pullback. For a strong uptrend, wait for the price to pull back to one of these levels and show signs of resuming the trend.
- **Candlestick Patterns**: Look for candlestick patterns such as bullish engulfing, hammer, or morning star at key Fibonacci levels, signaling a resumption of the trend.
- **Entry and Exit**: Buy during the pullback when the price shows signs of resuming its uptrend (e.g., bullish candlestick reversal at the 50% Fibonacci level).
**Pros**: Offers potentially lower-risk entries, as the price is retracing rather than chasing a big move.
**Cons**: Requires patience to wait for the right setup. Pullbacks can sometimes turn into trend reversals.
---
### **4. Momentum Oscillators**
Momentum oscillators like the **Relative Strength Index (RSI)**, **Stochastic Oscillator**, and **Commodity Channel Index (CCI)** are popular tools in momentum trading. These tools help identify overbought or oversold conditions and help time entries and exits.
**Key Techniques:**
- **RSI**: When RSI crosses above 70, it signals overbought conditions, and when it crosses below 30, it signals oversold conditions. A reversal in these conditions can indicate a potential shift in momentum.
- **Stochastic Oscillator**: A common strategy is to buy when the %K line crosses above the %D line in an oversold region (below 20) and sell when it crosses below in an overbought region (above 80).
- **CCI**: When the CCI crosses above +100, it suggests strong upward momentum. When it crosses below -100, it suggests strong downward momentum.
**Entry and Exit**:
- Enter long when the RSI is in the oversold range (below 30) and starts moving upwards.
- Enter short when the RSI is in the overbought range (above 70) and starts moving downwards.
**Pros**: Helps time entries and exits and can be used in a variety of market conditions.
**Cons**: Oscillators may give false signals during strong trending markets, as they tend to remain overbought or oversold.
---
### **5. Momentum Trendline Strategy**
A trendline-based strategy is all about connecting price peaks in uptrends and troughs in downtrends to identify areas where momentum might change.
**Key Techniques:**
- **Trendline Breaks**: Draw trendlines connecting the highs in an uptrend and the lows in a downtrend. When the price breaks a significant trendline, it signals a possible trend change.
- **Volume Confirmation**: Look for a price break from a trendline accompanied by an increase in volume to confirm momentum.
**Entry and Exit**:
- Enter long when the price breaks above a descending trendline in an uptrend, confirming that momentum is shifting upwards.
- Enter short when the price breaks below an ascending trendline in a downtrend, signaling a downward shift in momentum.
**Pros**: Provides clear levels for entries and exits, especially in trending markets.
**Cons**: Can be challenging in volatile or sideways markets, as trendlines might be broken frequently.
---
### **6. Sector Rotation Strategy**
Momentum trading can also involve rotating between different sectors or asset classes that are experiencing strong momentum.
**Key Techniques:**
- **Identifying Strong Sectors**: Use sector ETFs or individual stocks to identify sectors that are outperforming the broader market.
- **Relative Strength**: Compare the performance of one sector against others. Sectors with strong relative strength are more likely to continue their upward momentum.
- **Entry and Exit**: Buy stocks or ETFs in strong sectors and sell those in weak sectors. Set stop-loss levels based on sector performance relative to broader indexes.
**Pros**: Allows for diversified exposure to different parts of the market that are showing strong momentum.
**Cons**: Requires constant monitoring of sector performance and quick decision-making.
---
### **7. Swing Trading with Momentum Indicators**
Swing trading in momentum focuses on capturing short to medium-term price moves within an existing trend.
**Key Techniques:**
- **Bollinger Bands**: When prices touch the lower Bollinger Band, it may signal an oversold condition (potential buy), and when they touch the upper band, it may signal an overbought condition (potential sell).
- **MACD (Moving Average Convergence Divergence)**: Look for MACD crossovers—buy when the MACD line crosses above the signal line, and sell when it crosses below.
**Entry and Exit**:
- Buy when the MACD is above the signal line and price is near the lower Bollinger Band, signaling a potential bounce.
- Sell when the MACD is below the signal line and price is near the upper Bollinger Band, indicating a possible reversal.
**Pros**: Works well in trending or volatile markets where price movements are clear.
**Cons**: Can result in false signals in choppy or sideways markets.
---
### **Conclusion**
Momentum trading is powerful when executed properly, but it’s crucial to identify and understand the key momentum indicators, manage risks, and remain disciplined. Some key strategies for momentum trading include:
1. **Trend Following** – Ride the momentum with the trend.
2. **Breakout Strategy** – Capitalize on breakouts from key price levels.
3. **Pullback Strategy** – Enter after a retracement in an existing trend.
4. **Momentum Oscillators** – Use RSI, Stochastic, or CCI to identify overbought/oversold conditions.
5. **Momentum Trendline Strategy** – Trade based on trendline breaks.
6. **Sector Rotation Strategy** – Trade in sectors with strong momentum.
7. **Swing Trading with Momentum Indicators** – Capture short-term price movements using MACD and Bollinger Bands.
While momentum trading offers significant profit potential, it requires vigilance, adaptability, and discipline to successfully navigate market volatility.

SILVERHello & welcome to this analysis
In the short term it appears to be under pressure mainly due to the strength seen in DXY.
In the medium to long term its in the completion of a very large breakout, we might not see the current price level for decades after 1-2 quarters of 2025
All the best for your Investing and Trading

Silver breakoutSilverbees been moving silently. Hit ATH. Flagpole is the target.
Commodities time. Metals & commodities stocks are doing good.

SILVERBEES : Booked a profit of 2.91% on the invested capitalWhile the profit percentage relative to the invested capital may appear modest, it's important to note that the position size constituted approximately 5% of the net capital. Therefore, in terms of the overall capital, the profit is significant. A larger position size was allocated due to the nature of this being a commodity ETF, utilized as a hedge to safeguard the portfolio against potential sudden market downturns.
The decision to close the position was influenced by the price action of silver, with a thorough analysis of its chart provided below for reference. Please review the attached analysis for further insights.
If my perspective changes or if I gather additional fundamental data that influences my views, I will provide updates accordingly.
Thank you for following along with this journey, and I remain committed to sharing insights and updates as my trading strategy evolves. As always, please feel free to reach out with any questions or comments.
Other posts related to this particular position and scrip, if any, will be attached underneath. Do check those out too.
Disclaimer: The analysis shared here is for informational purposes only and should not be considered as financial advice. Trading in all markets carries inherent risks, and past performance is not indicative of future results. It's essential to conduct your own research and assess your risk tolerance before making any investment decisions. The views expressed in this analysis are solely mine. It's important to note that I am not a SEBI registered analyst, so the analysis provided does not constitute formal investment advice under SEBI regulations.

