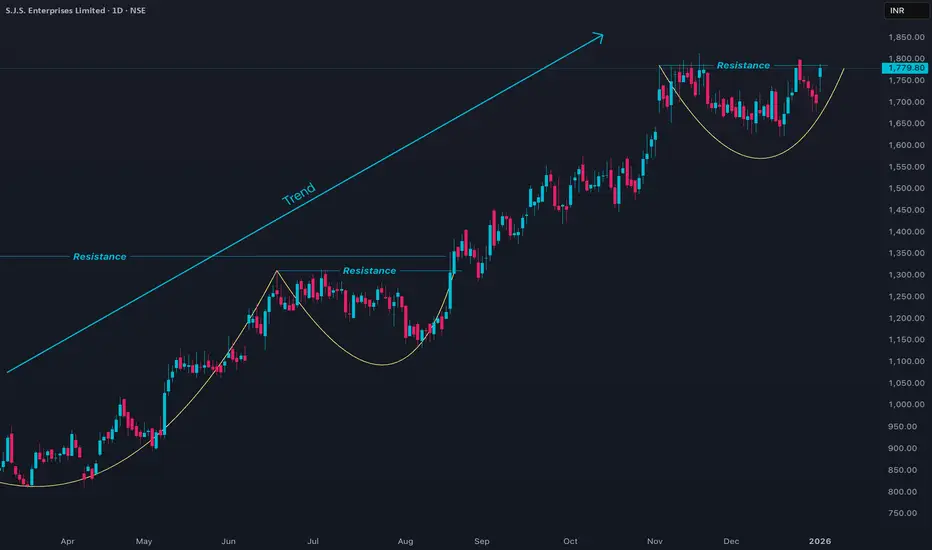
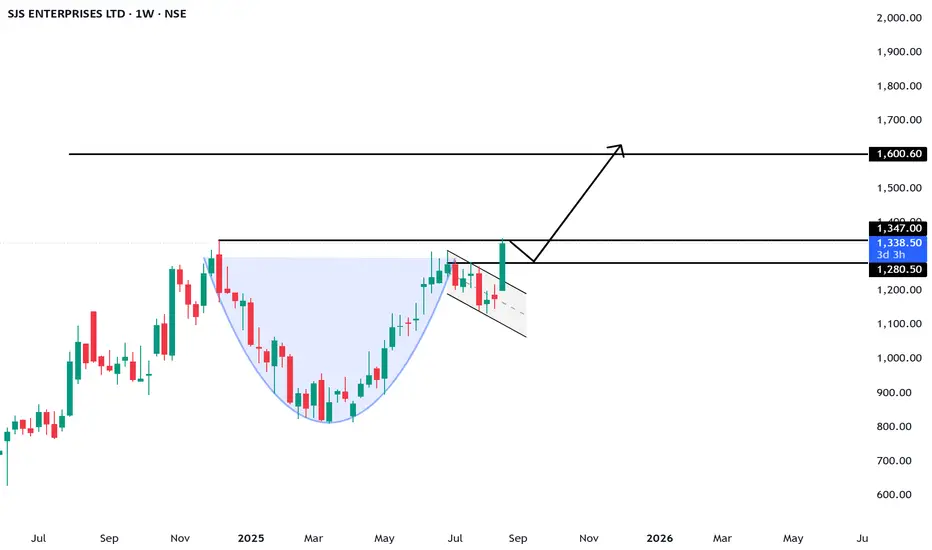
SJS Price Action1. Trend Bullish
2. Set up - rounding pattern
3. RR is lucrative
SJS is in a medium‑term uptrend but currently consolidating just below recent highs, with mixed momentum and nearby resistance, so fresh longs need staggered entries and tight risk.
S.J.S. Enterprises Limited
No trades
Next report date
—
Report period
—
EPS estimate
—
Revenue estimate
—
49.50 INR
1.18 B INR
7.60 B INR
25.14 M
About S.J.S. Enterprises Limited
Sector
Industry
CEO
Sanjay Thapar
Website
Headquarters
Bangalore
Founded
1987
IPO date
Nov 15, 2021
Identifiers
2
ISIN INE284S01014
S.J.S Enterprises Ltd. engages in the manufacture and sale of self-adhesive labels. Its products include domes, 3D Lux, overlays, decals and body graphics, 2D appliques, formed appliques, aluminum badges, optical plastics, IML and IMD, aftermarket and transform, chrome plated parts, capacitive overlays, and AZ. The company was founded by S. Sivakumar, Kannampadathil Abraham Joseph and V. Srinivasan on June 10, 1987 and is headquartered in Bangalore, India.
Related stocks
SJS looks like a good swing opportunitySJS enterprise has shown good strength in the recent volatile market. Strong closing above key EMA levels. Expecting prices to push higher as the stock is backed with strong fundamentals.

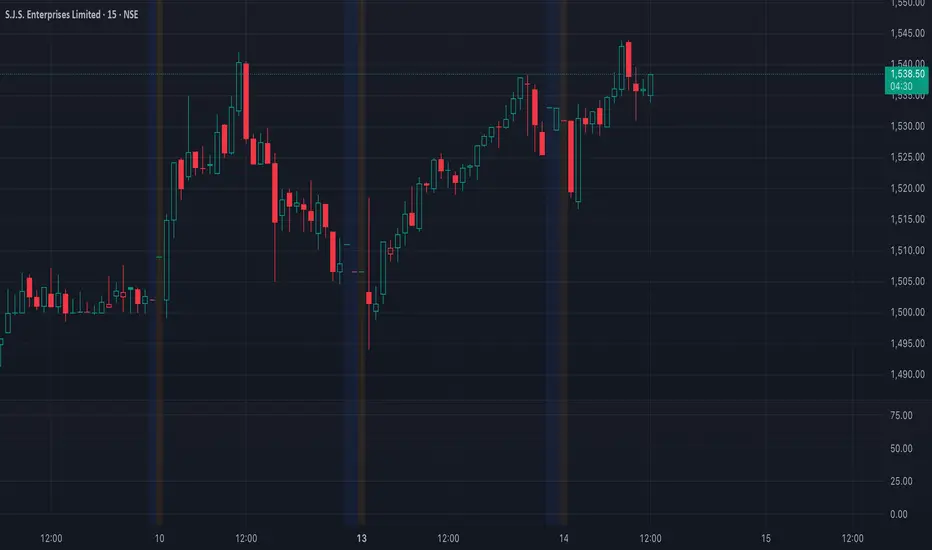
Potential Dumping of SJSSJS has seen a strong rally in recent weeks, but the recent price–volume action suggests possible distribution at higher levels. On shorter time frames, heavy volumes are consistently getting absorbed around ₹1500 mark, indicating that large quantities may be offloaded by institutional hands.
I’ve
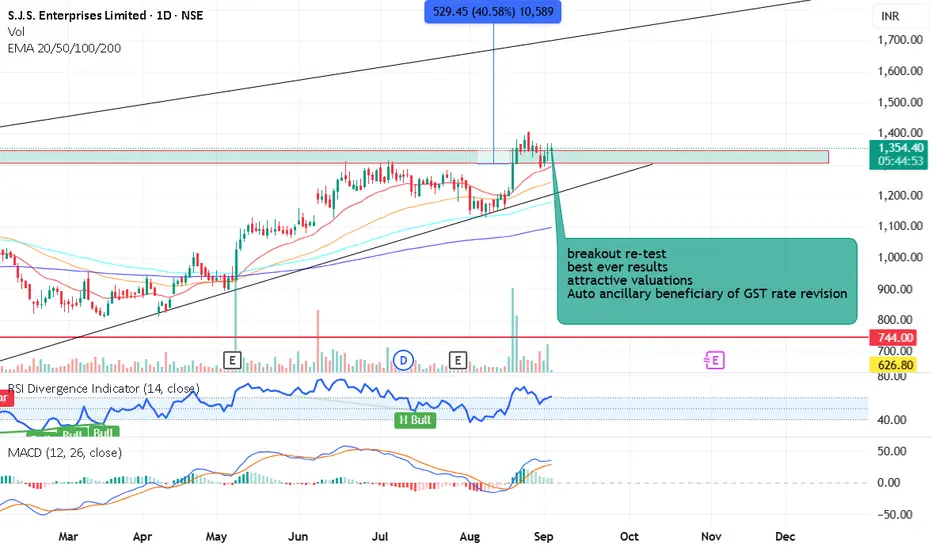
breakout retest SJS Auto ancillary stockbreakout re-test
best ever results
attractive valuations
Auto ancillary beneficiary of GST rate revision
ATH breakout with good volumes and retesting breakout level.
There are lot of chance to fly in blue sky.
this is only for educational not for any trade recommendation.
Why Buy S.J.S. Enterprises (SJS)Market Leadership in Aesthetics:
SJS is a leading player in India’s decorative aesthetics market, specializing in decals, labels, and 3D badges for automotive (especially two-wheelers and EVs), appliances, and other sectors.
Strong demand in India’s growing automotive sector (two-wheeler market and
BUY TODAY SELL TOMORROW for 5%DON’T HAVE TIME TO MANAGE YOUR TRADES?
- Take BTST trades at 3:25 pm every day
- Try to exit by taking 4-7% profit of each trade
- SL can also be maintained as closing below the low of the breakout candle
Now, why do I prefer BTST over swing trades? The primary reason is that I have observed that

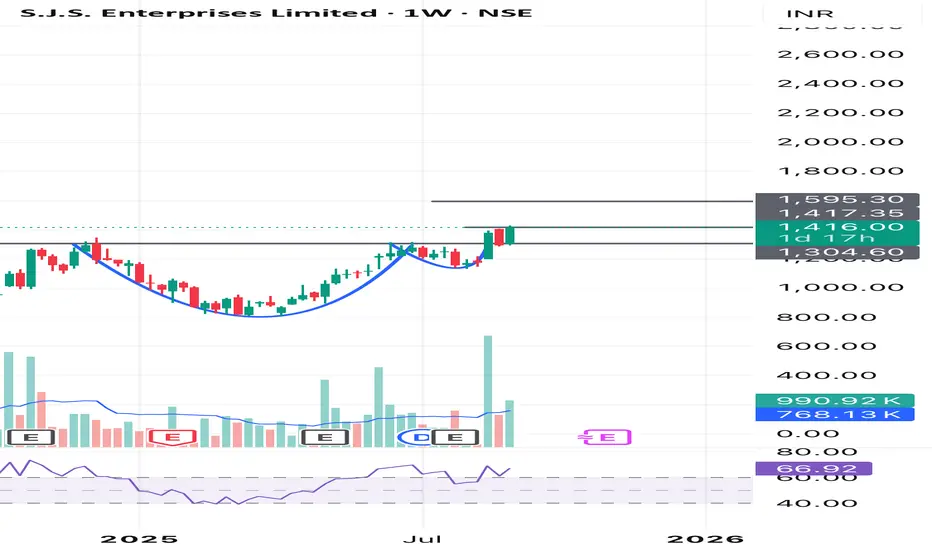
SJS Enterprise : Cup and Handle Patter BreakoutAfter making good run the stock has gone into consolidation phase. In recent weeks the bullish continuation pattern has seen.
The chart is for study purposes only.
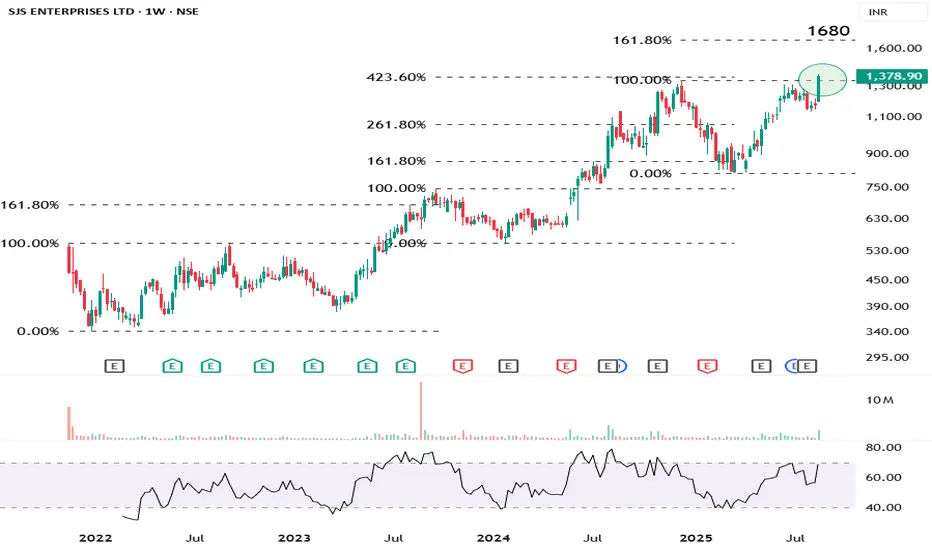
SJS
Prices have cleared its previous all time high of 1347.
In the past, the stock goes on to at-least test the 161.8% FR after a breakout above its previous all time high.
Hence, a minimum test of 1680 is expected in the near term.
Sustaining above 1300 would keep bullishness intact.
SJS Enterprises: The Silent Multi-bagger in the Making ??NSE:SJS
📌 SJS Enterprises Ltd. – Detailed Analysis Report
1. Company Overview
Leading decorative aesthetics solutions provider (decals, overlays, 3D appliqués, badges, domes).
Serves automotive, consumer appliances, and healthcare sectors.
Manufacturing in Bengaluru & Pune with exports
SJS ENTERPRISES Breaking Out from Descending Triangle✅ The stock has broken out of a descending triangle pattern with strong bullish momentum. It is now trading above 1040, indicating potential for further upside in the near term.
✅ The RSI is at 65, reflecting strong buying interest and room for more gains before becoming overbought. If the momentum

See all ideas
Summarizing what the indicators are suggesting.
Neutral
SellBuy
Strong sellStrong buy
Strong sellSellNeutralBuyStrong buy
Neutral
SellBuy
Strong sellStrong buy
Strong sellSellNeutralBuyStrong buy
Neutral
SellBuy
Strong sellStrong buy
Strong sellSellNeutralBuyStrong buy
An aggregate view of professional's ratings.
Neutral
SellBuy
Strong sellStrong buy
Strong sellSellNeutralBuyStrong buy
Neutral
SellBuy
Strong sellStrong buy
Strong sellSellNeutralBuyStrong buy
Neutral
SellBuy
Strong sellStrong buy
Strong sellSellNeutralBuyStrong buy
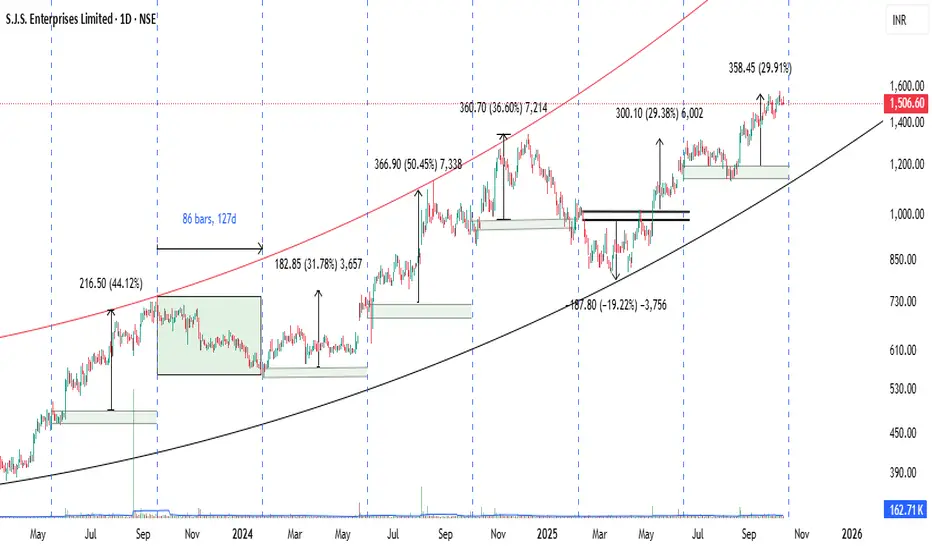
Displays a symbol's price movements over previous years to identify recurring trends.
Frequently Asked Questions
The current price of SJS is 1,656.30 INR — it has decreased by −2.41% in the past 24 hours. Watch S.J.S. Enterprises Limited stock price performance more closely on the chart.
Depending on the exchange, the stock ticker may vary. For instance, on NSE exchange S.J.S. Enterprises Limited stocks are traded under the ticker SJS.
SJS stock has risen by 1.24% compared to the previous week, the month change is a −6.15% fall, over the last year S.J.S. Enterprises Limited has showed a 74.53% increase.
We've gathered analysts' opinions on S.J.S. Enterprises Limited future price: according to them, SJS price has a max estimate of 2,223.00 INR and a min estimate of 1,846.00 INR. Watch SJS chart and read a more detailed S.J.S. Enterprises Limited stock forecast: see what analysts think of S.J.S. Enterprises Limited and suggest that you do with its stocks.
SJS stock is 5.00% volatile and has beta coefficient of 1.56. Track S.J.S. Enterprises Limited stock price on the chart and check out the list of the most volatile stocks — is S.J.S. Enterprises Limited there?
Today S.J.S. Enterprises Limited has the market capitalization of 53.01 B, it has increased by 3.31% over the last week.
Yes, you can track S.J.S. Enterprises Limited financials in yearly and quarterly reports right on TradingView.
S.J.S. Enterprises Limited is going to release the next earnings report on May 27, 2026. Keep track of upcoming events with our Earnings Calendar.
SJS net income for the last quarter is 446.11 M INR, while the quarter before that showed 430.34 M INR of net income which accounts for 3.66% change. Track more S.J.S. Enterprises Limited financial stats to get the full picture.
Yes, SJS dividends are paid annually. The last dividend per share was 2.50 INR. As of today, Dividend Yield (TTM)% is 0.15%. Tracking S.J.S. Enterprises Limited dividends might help you take more informed decisions.
S.J.S. Enterprises Limited dividend yield was 0.28% in 2024, and payout ratio reached 6.61%. The year before the numbers were 0.33% and 7.29% correspondingly. See high-dividend stocks and find more opportunities for your portfolio.
As of Jan 30, 2026, the company has 507 employees. See our rating of the largest employees — is S.J.S. Enterprises Limited on this list?
EBITDA measures a company's operating performance, its growth signifies an improvement in the efficiency of a company. S.J.S. Enterprises Limited EBITDA is 2.47 B INR, and current EBITDA margin is 25.84%. See more stats in S.J.S. Enterprises Limited financial statements.
Like other stocks, SJS shares are traded on stock exchanges, e.g. Nasdaq, Nyse, Euronext, and the easiest way to buy them is through an online stock broker. To do this, you need to open an account and follow a broker's procedures, then start trading. You can trade S.J.S. Enterprises Limited stock right from TradingView charts — choose your broker and connect to your account.
Investing in stocks requires a comprehensive research: you should carefully study all the available data, e.g. company's financials, related news, and its technical analysis. So S.J.S. Enterprises Limited technincal analysis shows the neutral today, and its 1 week rating is buy. Since market conditions are prone to changes, it's worth looking a bit further into the future — according to the 1 month rating S.J.S. Enterprises Limited stock shows the buy signal. See more of S.J.S. Enterprises Limited technicals for a more comprehensive analysis.
If you're still not sure, try looking for inspiration in our curated watchlists.
If you're still not sure, try looking for inspiration in our curated watchlists.