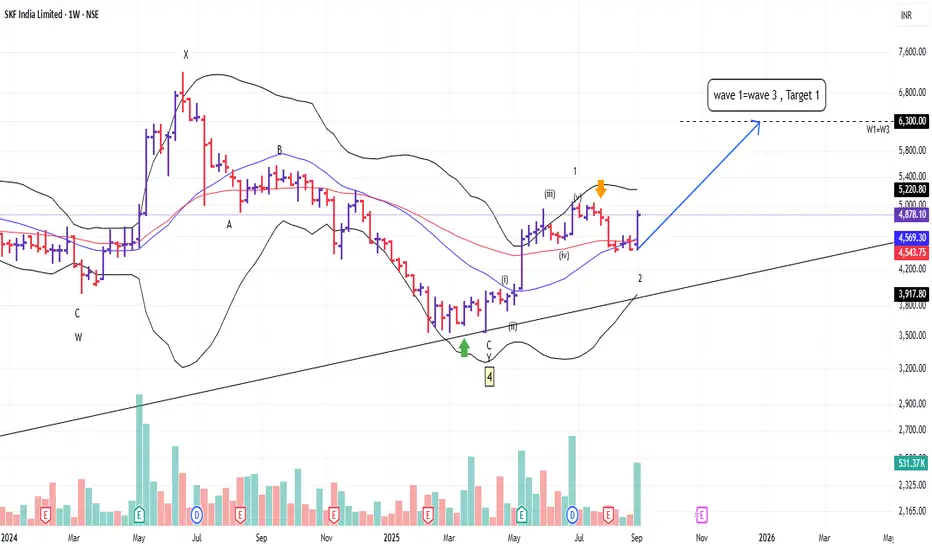
SKF EW AnalysisSKF has broken out and target of EW equality i.e. wave 1 = wave 3 is marked. Likely to exceed target. Shall update ...
Next report date
—
Report period
—
EPS estimate
—
Revenue estimate
—
106.25 INR
5.66 B INR
49.20 B INR
23.18 M
About SKF India Limited
Sector
Industry
CEO
Shailesh Kumar Sharma
Website
Headquarters
Pune
Founded
1923
ISIN
INE640A01023
FIGI
BBG000CZ06B2
SKF India Ltd. manufactures bearings and seals. Its products include Product tables, Bearings, units and housings, Seals, Lubrication solutions, Motion Technologies, Magnetic bearings/Permanent Magnet electric motors, By-wire, Maintenance products, Condition monitoring, Power transmission products and solutions, Coupling systems, Test and measuring equipment. The firm also offers Rotating Equipment Performance, Reliability engineering services, Customer training, SKF Engineering Consultancy Services, Logistics and Demand Chain, Lubrication Services, Mechanical maintenance, Remanufacturing and maintenance services, Service contracts, SKF distributor network, SKF Solution Factory and Hydraulic tension tightening. The company was founded in 1923 and is headquartered in Pune, India.
Related stocks
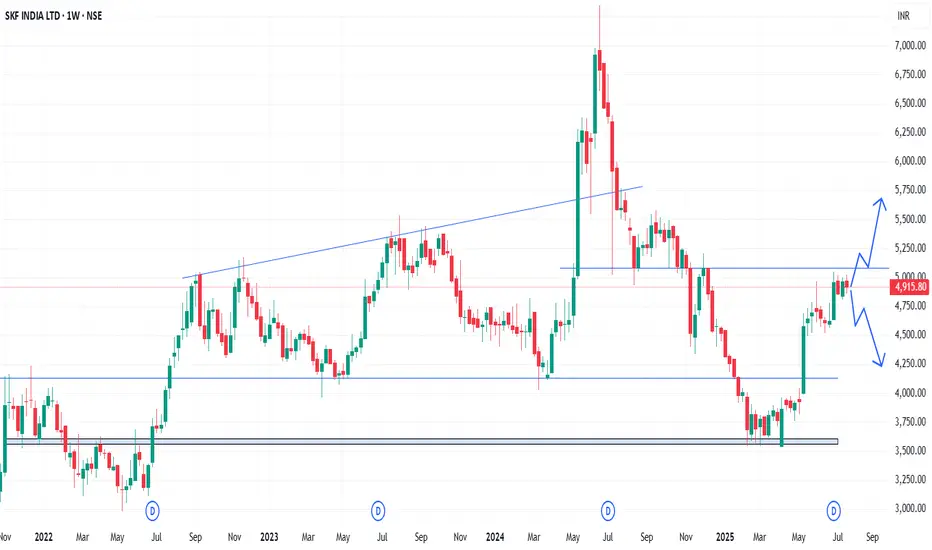
SKFINDIA - Weekly AnalysisIn the Weekly Chart of SKFINDIA ,
we can see that, it is at decision making point.
Possible momentums are shown in chart.
SKF INDIA - Bullish Flag & Pole Breakout (Daily T/F)Trade Setup
📌 Stock: SKF INDIA LTD ( NSE:SKFINDIA )
📌 Trend: Strong Bullish Momentum
📌 Risk-Reward Ratio: 1:3 (Favorable)
🎯 Entry Zone: ₹4690.00 (Breakout Confirmation)
🛑 Stop Loss: ₹4400.00(Daily Closing Basis) (~5.6% Risk)
🎯 Target Levels:
₹4822.50
₹4958.70
₹5098.80
₹5242.80
₹5390.90
₹5559.15

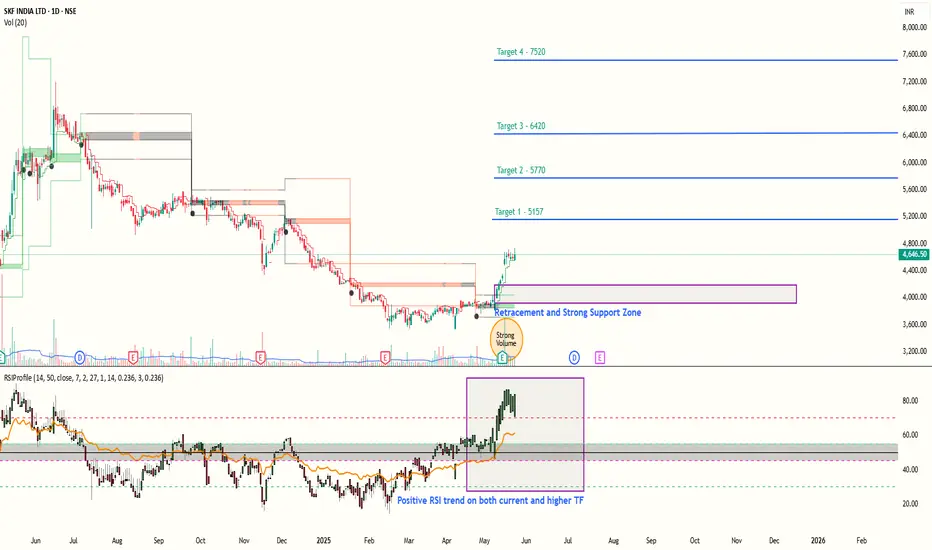
SKF Great Bullish PotentialSKF has been showing continous Bullish RSI trend in the daily chart. And fundamentals also exhibit strength, with the company being debt free, Good cashflow, Positive earnings and Rising EPS.
It has a very strong support zone in 3900-4200 price range, where big institutional and responsive buyers a
SKF technical analysisSKF India Ltd. (NSE: SKFINDIA) is currently trading at ₹4,207.10. The company is a leading manufacturer and supplier of bearings, seals, lubrication systems, and related products, serving various industries including automotive, aerospace, and industrial sectors.
Key Levels
Support Level: ₹2,539.70

Weekly Breakout - SKF Weekly Breakout after close / bounce off 50SMA
Weekly RSI > 60 and good volumes too
Monthly stock in All time high with RSI > 60

SKF INDIA Buy SKF India looking good for buy as Swing Trade
Weekly TF showing its support level and swing showing stop Loss

SKF INDIA Buy SKF India looking good for buy as Swing Trade
Weekly TF showing its support level and swing showing stop Loss

Accumulate SKF - Long 50% Upside Forecast
Fundamentals Strong
Good Quarter Results
Price in demand zone
FIIs/DIIs Favourite
High Risk/Reward
High Dividend payout

Take SKFINDIA for major upsideTake entry at CMP 4700
Target 5902
Next average at 4071
Be invested for big profit

See all ideas
Summarizing what the indicators are suggesting.
Neutral
SellBuy
Strong sellStrong buy
Strong sellSellNeutralBuyStrong buy
Neutral
SellBuy
Strong sellStrong buy
Strong sellSellNeutralBuyStrong buy
Neutral
SellBuy
Strong sellStrong buy
Strong sellSellNeutralBuyStrong buy
An aggregate view of professional's ratings.
Neutral
SellBuy
Strong sellStrong buy
Strong sellSellNeutralBuyStrong buy
Neutral
SellBuy
Strong sellStrong buy
Strong sellSellNeutralBuyStrong buy
Neutral
SellBuy
Strong sellStrong buy
Strong sellSellNeutralBuyStrong buy
Displays a symbol's price movements over previous years to identify recurring trends.
Frequently Asked Questions
The current price of SKFINDIA is 2,219.60 INR — it has decreased by −0.27% in the past 24 hours. Watch SKF India Limited stock price performance more closely on the chart.
Depending on the exchange, the stock ticker may vary. For instance, on NSE exchange SKF India Limited stocks are traded under the ticker SKFINDIA.
SKFINDIA stock has fallen by −55.16% compared to the previous week, the month change is a −53.93% fall, over the last year SKF India Limited has showed a −59.20% decrease.
We've gathered analysts' opinions on SKF India Limited future price: according to them, SKFINDIA price has a max estimate of 2,581.97 INR and a min estimate of 2,187.50 INR. Watch SKFINDIA chart and read a more detailed SKF India Limited stock forecast: see what analysts think of SKF India Limited and suggest that you do with its stocks.
SKFINDIA reached its all-time high on Jun 18, 2024 with the price of 7,350.00 INR, and its all-time low was 113.55 INR and was reached on Oct 21, 2004. View more price dynamics on SKFINDIA chart.
See other stocks reaching their highest and lowest prices.
See other stocks reaching their highest and lowest prices.
SKFINDIA stock is 4.28% volatile and has beta coefficient of 1.43. Track SKF India Limited stock price on the chart and check out the list of the most volatile stocks — is SKF India Limited there?
Today SKF India Limited has the market capitalization of 110.09 B, it has increased by 2.40% over the last week.
Yes, you can track SKF India Limited financials in yearly and quarterly reports right on TradingView.
SKF India Limited is going to release the next earnings report on Nov 4, 2025. Keep track of upcoming events with our Earnings Calendar.
SKFINDIA earnings for the last quarter are 11.48 INR per share, whereas the estimation was 16.15 INR resulting in a −28.92% surprise. The estimated earnings for the next quarter are 13.22 INR per share. See more details about SKF India Limited earnings.
SKF India Limited revenue for the last quarter amounts to 12.83 B INR, despite the estimated figure of 12.89 B INR. In the next quarter, revenue is expected to reach 13.40 B INR.
SKFINDIA net income for the last quarter is 1.18 B INR, while the quarter before that showed 2.03 B INR of net income which accounts for −41.85% change. Track more SKF India Limited financial stats to get the full picture.
Yes, SKFINDIA dividends are paid annually. The last dividend per share was 14.50 INR. As of today, Dividend Yield (TTM)% is 0.65%. Tracking SKF India Limited dividends might help you take more informed decisions.
SKF India Limited dividend yield was 0.38% in 2024, and payout ratio reached 12.67%. The year before the numbers were 3.12% and 116.47% correspondingly. See high-dividend stocks and find more opportunities for your portfolio.
As of Oct 18, 2025, the company has 3.39 K employees. See our rating of the largest employees — is SKF India Limited on this list?
EBITDA measures a company's operating performance, its growth signifies an improvement in the efficiency of a company. SKF India Limited EBITDA is 6.97 B INR, and current EBITDA margin is 15.43%. See more stats in SKF India Limited financial statements.
Like other stocks, SKFINDIA shares are traded on stock exchanges, e.g. Nasdaq, Nyse, Euronext, and the easiest way to buy them is through an online stock broker. To do this, you need to open an account and follow a broker's procedures, then start trading. You can trade SKF India Limited stock right from TradingView charts — choose your broker and connect to your account.
Investing in stocks requires a comprehensive research: you should carefully study all the available data, e.g. company's financials, related news, and its technical analysis. So SKF India Limited technincal analysis shows the strong sell today, and its 1 week rating is strong sell. Since market conditions are prone to changes, it's worth looking a bit further into the future — according to the 1 month rating SKF India Limited stock shows the strong sell signal. See more of SKF India Limited technicals for a more comprehensive analysis.
If you're still not sure, try looking for inspiration in our curated watchlists.
If you're still not sure, try looking for inspiration in our curated watchlists.