STAR Price ActionStrides Pharma Science Ltd (STAR) ended today at ₹869.3, closing near the upper half of its intraday range between ₹863.15 and ₹875.45. The stock displayed steady upward momentum throughout the session, supported by healthy trading volumes and buyers consistently stepping in closer to support zones.
### Technical Structure
- STAR trades above both its 20-day and 50-day moving averages, reaffirming short-term strength and a continued positive breakout structure.
- The daily chart features a sequence of higher lows, confirming bullish undertones and consistent accumulation by market participants.
- Momentum indicators such as RSI are hovering in the 58–62 range, signaling a healthy balance between momentum and overbought conditions, while the MACD line remains above the signal, adding to bullish conviction.
### Key Levels
- **Immediate Resistance:** ₹875; a close above this level may set the stock up for a push toward ₹900 and possibly ₹925 in the coming week.
- **Support Levels:** Strong buying support exists at ₹860. If breached, the next zone to watch is ₹845, which aligns with previous swing lows and potential moving average support.
### Volume and Sentiment
Trading activity was above the recent average, echoing the prevailing bullish sentiment and indicating that institutional and retail interest remains robust. A clear move with expanding volume above ₹875 would likely validate the next leg of the rally.
### Short-Term Outlook
As long as STAR maintains above ₹860, the trend remains firmly in favor of the bulls, and further gains can be expected on continued market strength. Short-term profit booking may occur near resistance, but overall sentiment and technicals point to strong underlying support for further appreciation.
Trade ideas
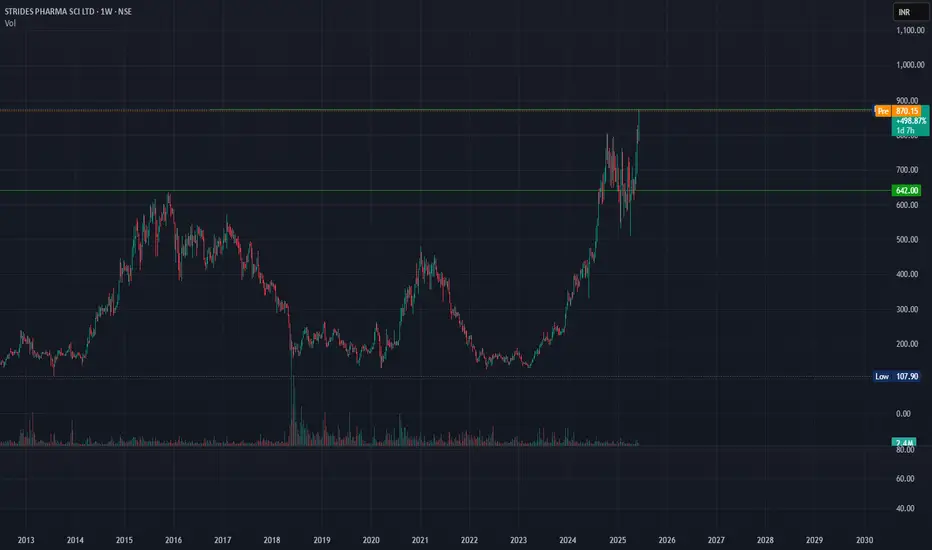
Strides Pharma Science Ltd - Multiyear Breakout returns -2-3X !!The price consolidation for last 9 years gave a breakout which retested the breakout levels and going upwards. The price may move to give high returns in coming time.
Technically Multiyear breakout (double bottom) and may rise the price to give multibagger return after short consolidation.
Stock details
Sector: Pharma
Theme play out: CDMO ( Contract Development and Manufacturing Organization)
Technical analysis details
Accumulation Zone= 1350-1675
Low-risk entry price = weekly closing candle >1675
Stoploss = 1235 (weekly closing for less risk takers)
Stoploss = 1000 (weekly closing below- high-risk takers)
Target 1 = 2000
Target 2 = 2500
Target 3 = 3000
Target 4 = 4500 (Time frame ~ 1-4 years)
Positives
FII holding = 30.08%
DII Holding = 18.24%
sales are increasing annually
CDMO theme
Negatives
Promoters sold their holding 4.67 % for the last 3 years
Promoters pledge to hold 49.2%
Debt > reserves
Disclaimer: This analysis is just for educational purpose; nothing is guaranteed;

STRIDES PHARMA ANALYSISFOR LEARNING PURPOSE
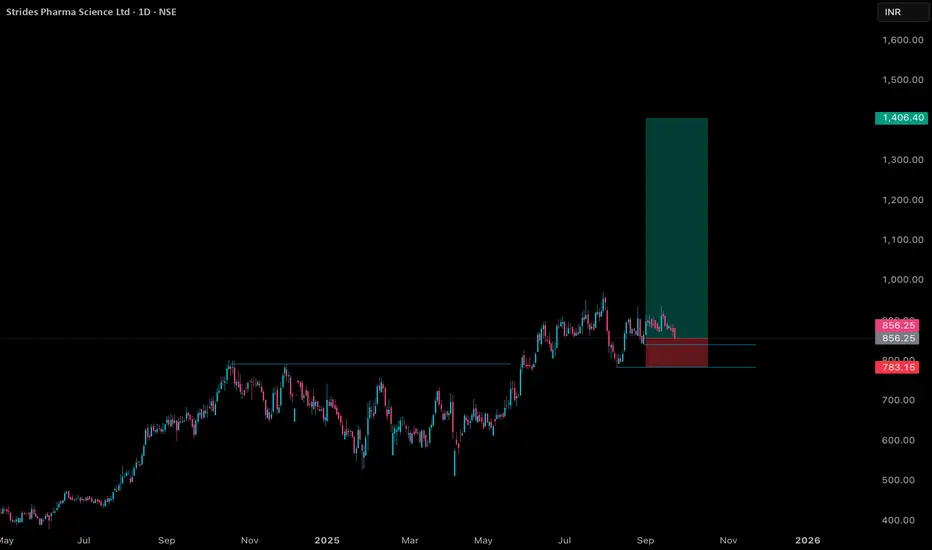
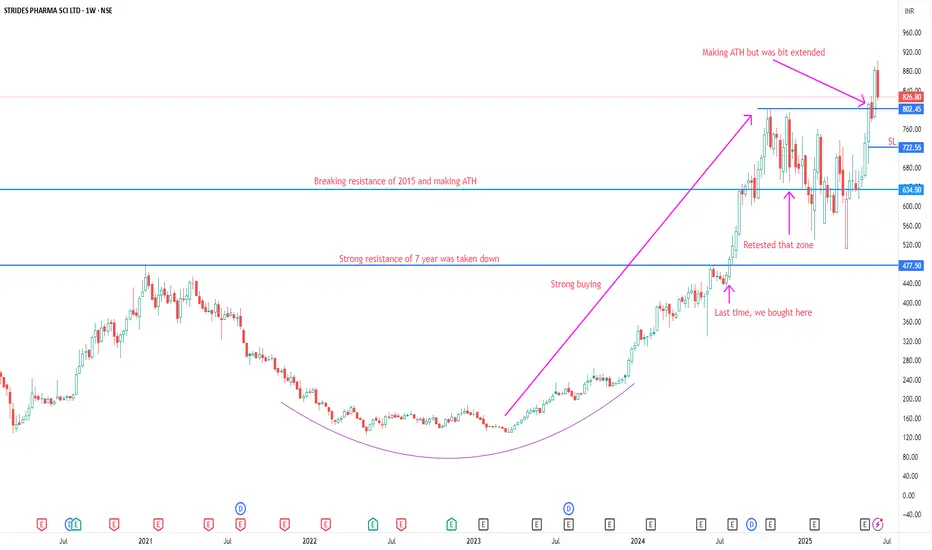
STRIDES PHARMA LTD - The current price of STRIDES PHARMA LTD is 826.80 rupees
I am going to buy this stock because of the reasons as follows-
1. Its coming out from a good consolidation base
2. It broke a strong resistance zone and making ATH
3. It is showing better relative strength as it stood strong in volatile times
4. The risk and reward is favourable
5. The stock belongs to a sector which is defensive and has not done much in last weeks so I am expecting some move from that. Also, many new recent developments are going with the stock which can act as good catalyst.
6. The stock was very strong in 2023-2024 and then it went into some good rest for almost 7 months
7. The stock has been outperforming major Index as well as Sectoral Index which is a good sign
I will buy it with minimum target of 35-40% and then will trail after that.
My SL is at 722.55 rupees
I will be managing my risk.
STRIDE PHARMABuy with sl 650 cmp 867.80 target more than 2 to 3 X
long term breakout with W pattern
when 2 x target achieved exit your capital hold with remaining profit shares and Trail sl
Amazing breakout on WEEKLY Timeframe - STARCheckout an amazing breakout happened in the stock in Weekly timeframe, macroscopically seen in Daily timeframe. Having a great favor that the stock might be bullish expecting a staggering returns of minimum 25% TGT. IMPORTANT BREAKOUT LEVELS ARE ALWAYS RESPECTED!
NOTE for learners: Place the breakout levels as per the chart shared and track it yourself to get amazed!!
#No complicated chart patterns
#No big big indicators
#No Excel sheet or number magics
TRADE IDEA: WAIT FOR THE STOCK TO BREAKOUT IN WEEKLY TIMEFRAME ABOVE THIS LEVEL.
Checkout an amazing breakout happened in the stock in Weekly timeframe.
Breakouts happening in longer timeframe is way more powerful than the breakouts seen in Daily timeframe. You can blindly invest once the weekly candle closes above the breakout line and stay invested forever. Also these stocks breakouts are lifelong predictions, it means technically these breakouts happen giving more returns in the longer runs. Hence, even when the scrip makes a loss of 10% / 20% / 30% / 50%, the stock will regain and turn around. Once they again enter the same breakout level, they will flyyyyyyyyyyyy like a ROCKET if held in the portfolio in the longer run.
Time makes money, GREEDY & EGO will not make money.
Also, magically these breakouts tend to prove that the companies turn around and fundamentally becoming strong. Also the magic happens when more diversification is done in various sectors under various scripts with equal money invested in each N500 scripts.
The real deal is when to purchase and where to purchase the stock. That is where Breakout study comes into play.
Check this stock which has made an all time low and high chances that it makes a "V" shaped recovery.
> Taking support at last years support or breakout level
> High chances that it reverses from this point.
> Volume dried up badly in last few months / days.
> Very high suspicion based analysis and not based on chart patterns / candle patterns deeply.
> VALUABLE STOCK AVAILABLE AT A DISCOUNTED PRICE
> OPPURTUNITY TO ACCUMULATE ADEQUATE QUANTITY
> MARKET AFTER A CORRECTION / PANIC FALL TO MAKE GOOD INVESTMENT
DISCLAIMER : This is just for educational purpose. This type of analysis is equivalent to catching a falling knife. If you are a warrior, you throw all the knives back else you will be sorrow if it hits SL. Make sure to do your analysis well. This type of analysis only suits high risks investor and whose is willing to throw all the knives above irrespective of any sectoral rotation. BE VERY CAUTIOUS AS IT IS EXTREME BOTTOM FISHING.
HOWEVER, THIS IS HOW MULTIBAGGERS ARE CAUGHT !
STOCK IS AT RIGHT PE / RIGHT EVALUATION / MORE ROAD TO GROW / CORRECTED IV / EXCELLENT BOOKS / USING MARKET CRASH AS AN OPPURTUNITY / EPS AT SKY.
LET'S PUMP IN SOME MONEY AND REVOLUTIONIZE THE NATION'S ECONOMY!
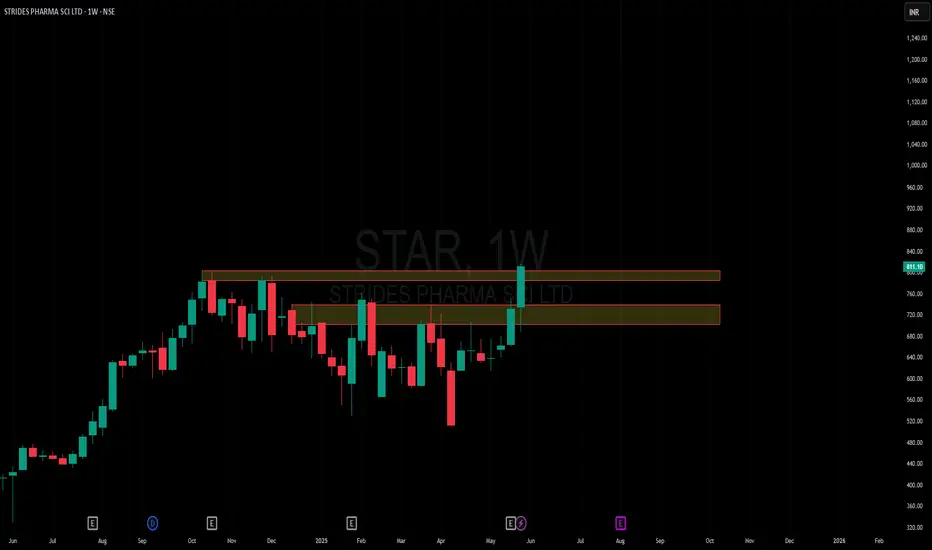
STAR - Rejections - Need to sustainSTAR :
Approaching good resistance zone
Rejections earlier, need to sustain 800 levels for new highs

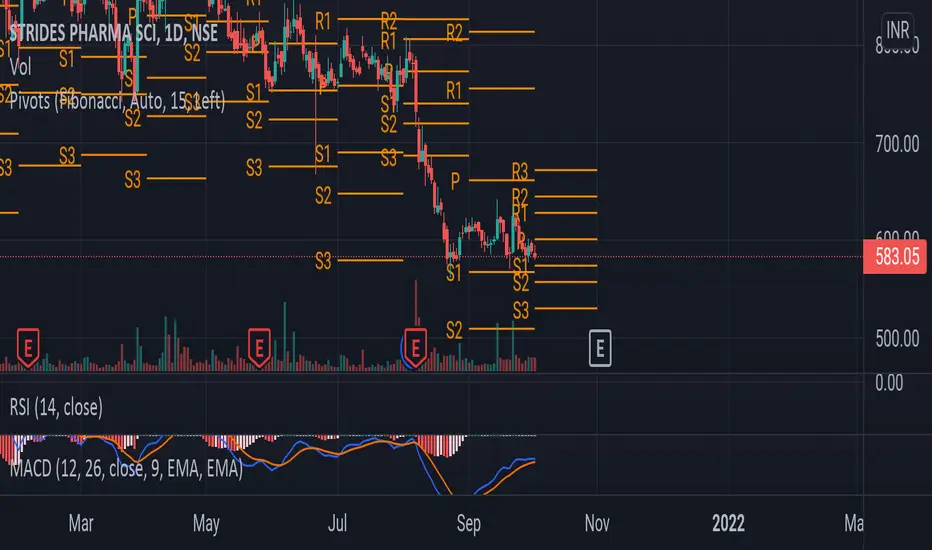
Strides Pharma - Volumes Backing a Breakout?Daily Timeframe Analysis
The setup is heating up and now we’ve got volume profile data to back it. The price is hovering around ₹666.10, and it looks like it's building strength for a bigger move.
🔹 Key Observations:
Price is compressing under a falling trendline (descending triangle or wedge).
Strong volume node around the ₹650–₹675 zone. This means a lot of trading activity happened here — a key decision area.
Fibonacci projections suggest targets as high as ₹984.00, which is a +40% upside.
Breakout confirmation above ₹692.75 (61.8% level) can trigger a rally.
🔹 Important Levels:
📍 Resistance: ₹692.75 → ₹741.65 → ₹804.00 → ₹984.00
📉 Support: ₹624.00 → ₹581.50 → ₹530.00 → ₹515.20
📊 Volume Insight:
The visible range volume profile shows most trading volume has happened below the current price, which is bullish. If the price breaks above the current squeeze, it might fly with less resistance overhead.
🧠 Thought:
This chart is a coiled spring. If bulls push above ₹692 with momentum, this might become a quick swing to ₹740+, and maybe more in the short to medium term.
📝 #StridesPharma #BreakoutSetup #VolumeProfile #SwingTrade #IndianStocks

Multiple EMA Strategy Buy and Sell signal is mainly the big Green and Red triangles, please use the 4 hour time frame or 3 Day for more accuracy. If there is any discrepancy please let me know. I'll correct them. Thank you.

STRIDE: Multi-Year Breakout: Monthly : Month ending Aug-24STRIDE: Multi-Year Breakout: Monthly Timeframe: Month ending Aug-24
Price, Volume, RSI, Timeframe of breakout & Timeframe of analysis
Stock broke its all-time high (1323.15) it made in Nov-15 and closed above in the month of Aug-24
Volumes in the month of Aug-24 was NOT above the 9 SMA
RSI in the month of Aug-24 (86.10) is above 60.
A multi-year (8+ years) breakout on a monthly time frame
The stock has broken the highs it made in Aug'24 in Sep-24 and is currently (08-Oct-24) trading above the highs it made in the month of Sep'24
Numbers
Breakout analysis High (Jan-08) = 1323.15/-
Drawdown (marked on chart) = 1055.15/-
SuperTrend (Sep-24) = 891.94 is positive
ATR (Sep-24) = 136.31
Low made in the last analysis time frame (Sep-24) = 1250.55
Entry / Exit
Entry = Close of 08-Oct = 1443.80/-
Target = Breakout level + Drawdown during consolidation phase = 1323.15 + 1055.15 ~ 2370
Stop Loss = 1 ATR below previous candle's (Sep'24) low = 1250.55 - 136.31 ~ 1110
Risk:Reward = 2.77:1
Exit criteria = Reaches Target || Supertrend turns negative || Price goes below 18 EMA
Additional Notes
This is probably not the best trade. The stock did not breakout with good volumes
I also expect the stock to retrace back to its breakout levels. It has been breaking it's previous months high for last 4 months starting Jun'24.
Entering the trade anyways since it seems to be breaking out from a double bottom pattern on a monthly timeframe

Stride PharmaForming double top pattern in monthly chart.It has crossed the level from 2015 so it is on the verge of breakout.So keep it in ur watch list an grab the opportunity. Here I'm sharing with u monthly chart.

Strides Bullish view - Swing tradingReasons for trade.
1. Breakout on daily chart. Feb 2017 high breakout.
2. Entry at hourly chart after breakout and retesting.
This is not a financial advice. I am still learning the concepts of Stock market. Do your analysis before taking any trade.

STAR - Swing trade analysis - 19th JulySWING TRADE
STAR Looking good for upside
CMP 952.70
Buy around current levels
Target 1000

Strides Pharma / Star Date 21.07.2024
Strides Pharma
Time frame : Day chart
Bullish pole & flag could keep the upside momemt continue, wait for the price to exit flag & trail stoploss

Broke 9 Year Old Resistance With Strong Momentum:- Don’t Miss It
Multi-year Breakout & Positive Results
The stock has given an upper trend breakout and consolidated for 2 months before starting its next rally. Technically, the stock looks very strong and is expected to show good momentum in the future.
The company is focusing more on the USA and emerging countries like Kenya and other African countries. This strategy is promising because many companies that focused on emerging markets became multibaggers. Additionally, the company's balance sheet is also improving.

Strides Pharma, Star setup about to breakoutOne Simple Horizontal Line Setup
-Posted great growth results, everything is improving.
-Pharma sector seems strong as it is also near breakout zone.
-That red wick on election results day seems so good, fell with market but cop up fast and took support at 200 ema n come back in good zone again and,
Good shakeout of 100 ema too.
-Yesterday gave squat too (went above horizontal line and close below, taking out weak players)
Overall good setup and a strong stock, buying above previous day high (pdh)
Note: no buy/sell recommendations at all.

STAR - Strides Pharma multi year breakout attempt!After consolidating and moving sideways for years now with the momentum it's showing great traction for upward movement! Keep a watch. The fib should guide the targets which will keep extending on the basis of closing.

Strides Pharma Monthly TrendlineStrides Pharma moved like Bull and now BO given on Monthly chart invest for multifold returns

STAR 1:8+ RR trade set up1. Set up: Big rounding bottom pattern
2. RR: 1:8+
3. SL: Follow on closing basis
4. Trend bullish
5. Confirmed Breakout

STAR (Strides Pharma) - Head and Shoulder Pattern in MonthlySTAR (Strides Pharma) - Watch out for a multi-year breakout in STAR (Strides Pharma) in the monthly timeframe with a beautiful Head and Shoulder pattern.

Good Time To Buy PE Options Of STAR...NSE:STAR
Star Has been in a downtrend for a long time it's good time to start shorting as there are no hopes for big runs. Earnings also are calling and charts do not look good as well

Amazing swing trading idea for 14 Feb Markets I daily make educational content videos for swing / positional trading.

STRIDES PHARMA1. Entry - 755
2. Target 1 - 796.50
3. Target 2 - 957
4. SL - 704
Disclaimer :- Iam not SEBI registered adviser. Please research before Investing.
