BUY TODAY SELL TOMORROW for 5%DON’T HAVE TIME TO MANAGE YOUR TRADES?
- Take BTST trades at 3:25 pm every day
- Try to exit by taking 4-7% profit of each trade
- SL can also be maintained as closing below the low of the breakout candle
Now, why do I prefer BTST over swing trades? The primary reason is that I have observed that
Star Cement Ltd.
No trades
Next report date
—
Report period
—
EPS estimate
—
Revenue estimate
—
9.12 INR
1.69 B INR
29.96 B INR
65.62 M
About Star Cement Ltd.
Sector
Industry
Website
Headquarters
Kolkata
Founded
2001
IPO date
Jun 16, 2017
Identifiers
2
ISIN INE460H01021
Star Cement Ltd. engages in the manufacture and sale of cement. Its products include ordinary portland, OPC 53-Grade, portland pozzolana, portland slag, and anti rust cement. The company was founded on February 11, 2001 and is headquartered in Kolkata, India.
Related stocks

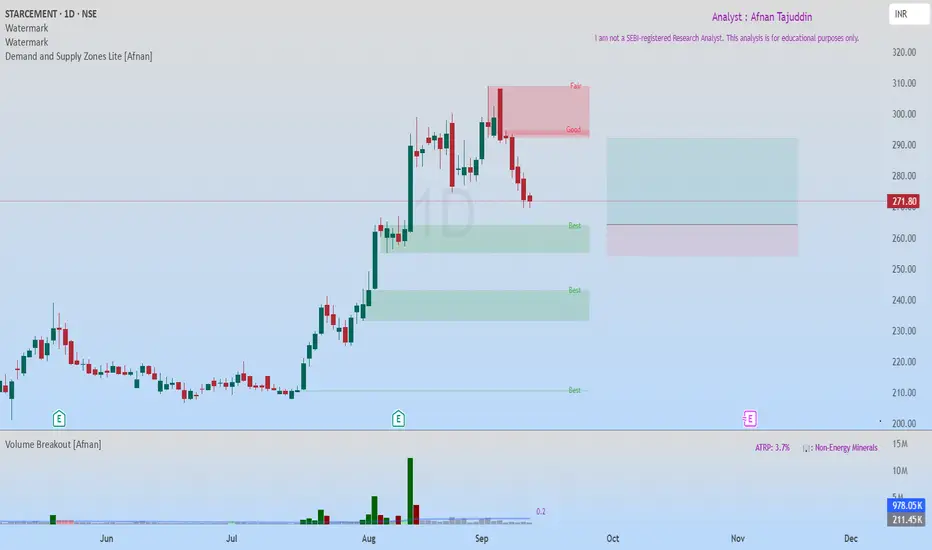
StarCement at Fresh Demand Zone – High Probability Bullish SetupStar Cement recently hit an all-time high and is now retracing towards a fresh Rally-Base-Rally (RBR) Demand Zone . This zone is of high quality, and the overall market structure remains strongly bullish. The best part? There’s no immediate supply zone until a potential 1:2 risk-to-reward target
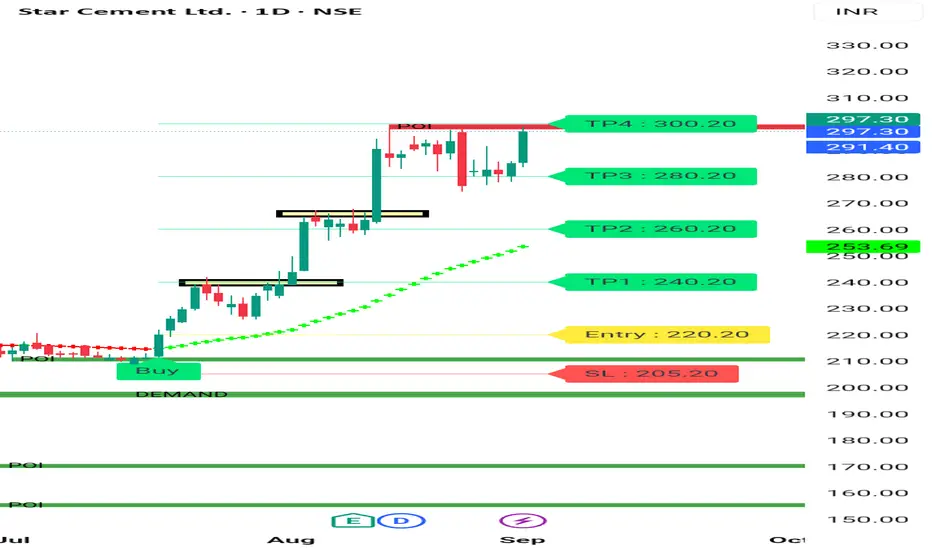
STAR CEMENT BREAKOUT/ Bullish Structure Star cement is good Stock fundamentally as well as Technicaly. It's moved from 220 to 297 . It's moving in a pattern you can see in chart . Now again it's at breakout level of its give movement above 300 then again 4 -5% move may give very fast . It's a high Momentum Stocks.
About company
Star Ce
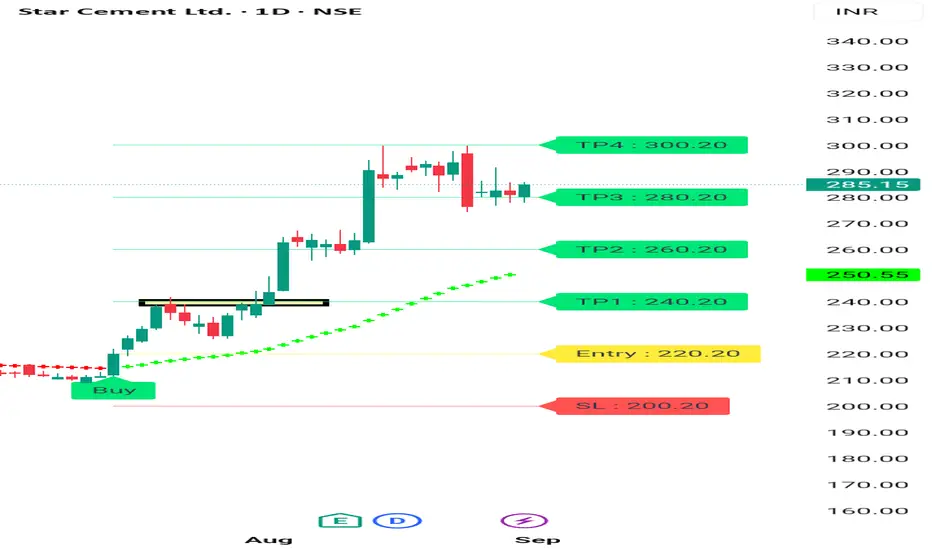
STAR CEMENT BULLISH Structure Start Cement Showing Good Strength on 1 Day Chart. Be Can See Star Cement given breakout and moving up in a higher high Pattern. It's a good sign that stock Still in Upper Range in this Falling market.
Consult your financial advisor before making any position in stock market. It's not my buy sell
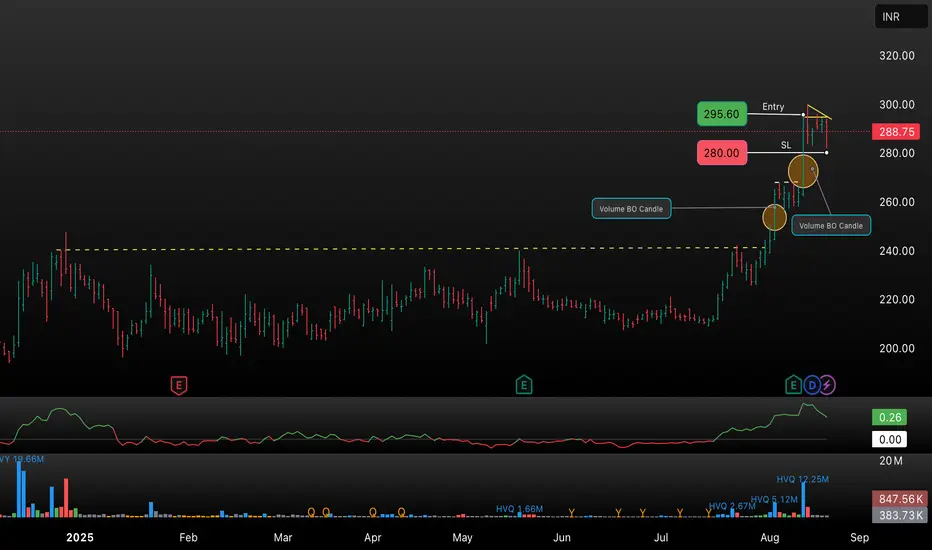
STARCEMENT– Volume Breakout & Bullish Continuation Setup This chart showcases STARCEMENT’s recent price action where a sustained breakout above long-term resistance was confirmed with consecutive high-volume candles. The trade setup indicates an entry at ₹295.60, targeting a continuation move, with a stop loss defined at ₹280.00 to manage risk. Multiple v
STAR CEMENT LTD | Strong Breakout After Long-Term Consolidation 📝 Description:
📌 Stock: STAR CEMENT LTD (NSE)
📅 Timeframe: 1D (Daily)
📈 Breakout Date: 04-Aug-2025
💼 Sector: Cement / Infrastructure
⚡️ Technical Setup:
Breakout Above Long-Term Resistance:
Price has finally broken through the ₹240–₹256 resistance zone, which had capped upside

BUY TODAY SELL TOMORROW for 5%DON’T HAVE TIME TO MANAGE YOUR TRADES?
- Take BTST trades at 3:25 pm every day
- Try to exit by taking 4-7% profit of each trade
- SL can also be maintained as closing below the low of the breakout candle
Now, why do I prefer BTST over swing trades? The primary reason is that I have observed that


North East is booming and transport of cement is not easyThese are locally made ingredients
They cant be moved from far off places
Transportation increases cost
I feel that this stock can be in a big bull run into this decade

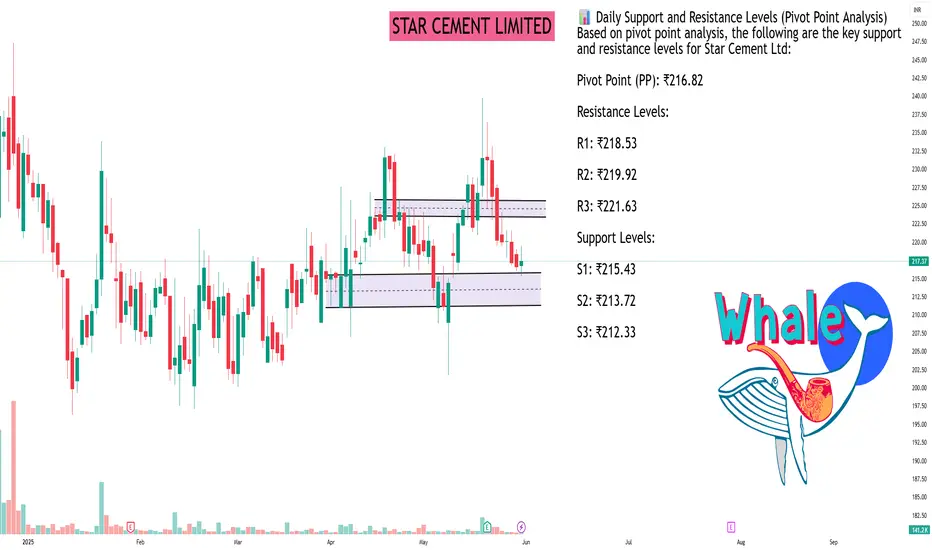
STAR CEMENT LIMITEDAs of May 30, 2025, Star Cement Ltd (NSE: STARCEMENT) closed at ₹217.37. The stock experienced a slight decline of 0.46% from the previous close of ₹216.55.
📊 Daily Support and Resistance Levels (Pivot Point Analysis)
Based on pivot point analysis, the following are the key support and resistance
See all ideas
Summarizing what the indicators are suggesting.
Neutral
SellBuy
Strong sellStrong buy
Strong sellSellNeutralBuyStrong buy
Neutral
SellBuy
Strong sellStrong buy
Strong sellSellNeutralBuyStrong buy
Neutral
SellBuy
Strong sellStrong buy
Strong sellSellNeutralBuyStrong buy
An aggregate view of professional's ratings.
Neutral
SellBuy
Strong sellStrong buy
Strong sellSellNeutralBuyStrong buy
Neutral
SellBuy
Strong sellStrong buy
Strong sellSellNeutralBuyStrong buy
Neutral
SellBuy
Strong sellStrong buy
Strong sellSellNeutralBuyStrong buy
Displays a symbol's price movements over previous years to identify recurring trends.
Frequently Asked Questions
The current price of STARCEMENT is 216.47 INR — it has decreased by −0.17% in the past 24 hours. Watch Star Cement Ltd. stock price performance more closely on the chart.
Depending on the exchange, the stock ticker may vary. For instance, on NSE exchange Star Cement Ltd. stocks are traded under the ticker STARCEMENT.
STARCEMENT stock has fallen by −1.07% compared to the previous week, the month change is a 1.83% rise, over the last year Star Cement Ltd. has showed a 4.57% increase.
We've gathered analysts' opinions on Star Cement Ltd. future price: according to them, STARCEMENT price has a max estimate of 375.00 INR and a min estimate of 245.00 INR. Watch STARCEMENT chart and read a more detailed Star Cement Ltd. stock forecast: see what analysts think of Star Cement Ltd. and suggest that you do with its stocks.
STARCEMENT reached its all-time high on Sep 2, 2025 with the price of 308.95 INR, and its all-time low was 60.00 INR and was reached on Mar 19, 2020. View more price dynamics on STARCEMENT chart.
See other stocks reaching their highest and lowest prices.
See other stocks reaching their highest and lowest prices.
STARCEMENT stock is 1.95% volatile and has beta coefficient of 0.47. Track Star Cement Ltd. stock price on the chart and check out the list of the most volatile stocks — is Star Cement Ltd. there?
Today Star Cement Ltd. has the market capitalization of 88.43 B, it has increased by 1.01% over the last week.
Yes, you can track Star Cement Ltd. financials in yearly and quarterly reports right on TradingView.
Star Cement Ltd. is going to release the next earnings report on May 14, 2026. Keep track of upcoming events with our Earnings Calendar.
STARCEMENT earnings for the last quarter are 1.95 INR per share, whereas the estimation was 1.37 INR resulting in a 42.68% surprise. The estimated earnings for the next quarter are 2.30 INR per share. See more details about Star Cement Ltd. earnings.
Star Cement Ltd. revenue for the last quarter amounts to 8.80 B INR, despite the estimated figure of 8.58 B INR. In the next quarter, revenue is expected to reach 12.16 B INR.
STARCEMENT net income for the last quarter is 749.21 M INR, while the quarter before that showed 719.50 M INR of net income which accounts for 4.13% change. Track more Star Cement Ltd. financial stats to get the full picture.
Star Cement Ltd. dividend yield was 0.00% in 2024, and payout ratio reached 0.00%. The year before the numbers were 0.00% and 0.00% correspondingly. See high-dividend stocks and find more opportunities for your portfolio.
As of Feb 13, 2026, the company has 4.38 K employees. See our rating of the largest employees — is Star Cement Ltd. on this list?
EBITDA measures a company's operating performance, its growth signifies an improvement in the efficiency of a company. Star Cement Ltd. EBITDA is 8.84 B INR, and current EBITDA margin is 14.65%. See more stats in Star Cement Ltd. financial statements.
Like other stocks, STARCEMENT shares are traded on stock exchanges, e.g. Nasdaq, Nyse, Euronext, and the easiest way to buy them is through an online stock broker. To do this, you need to open an account and follow a broker's procedures, then start trading. You can trade Star Cement Ltd. stock right from TradingView charts — choose your broker and connect to your account.
Investing in stocks requires a comprehensive research: you should carefully study all the available data, e.g. company's financials, related news, and its technical analysis. So Star Cement Ltd. technincal analysis shows the sell today, and its 1 week rating is sell. Since market conditions are prone to changes, it's worth looking a bit further into the future — according to the 1 month rating Star Cement Ltd. stock shows the neutral signal. See more of Star Cement Ltd. technicals for a more comprehensive analysis.
If you're still not sure, try looking for inspiration in our curated watchlists.
If you're still not sure, try looking for inspiration in our curated watchlists.