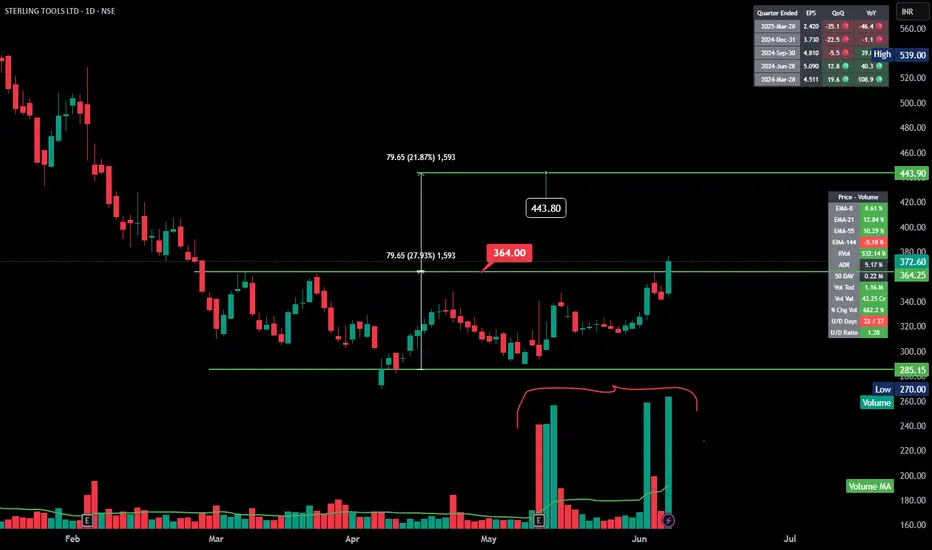
STERTOOLS | Consolidation | Breakout | DailyHere’s a short technical analysis summary for **Sterling Tools Ltd** based on the chart:
✅ **Breakout Level:** 364.00
✅ **Current Price:** 372.60
✅ **Target:** 443.80 (Measured Move)
✅ **Volume:** Surge in volume confirming the breakout
✅ **Support:** 285.15
✅ **Trend:** Strong momentum post-breakout
Trade ideas
breakout failure of STERTOOLS-EQ STERTOOLS-EQ is fundamentally sound company but the price is giving an indication of bear phase for the company.
the price has successfully given a breakdown with H&S pattern. the pattern is clearly visible on daily time frame. i couldnt show it here because i have choosen weekly time frame.
price has successfully given a breakout at ~245 - 275 levels in 2022 and has not yet retested the breakout. in this bear phase STERTOOLS-EQ will most likely test those levels.
in the down fall towards ~250 levels there will be fib 0.61 level where the price will bounce and will appear to sustain but most likely it will be used as a sell on rise opportunity.
as always trade as per your risk capacity.

STERTOOLS - BREAKOUT TRENDLINE - 4HR CHART.Sterling Tools has given BO of the trendline, now re-testing.
It made a Hammer at the support and gave reversal. There is Probability of it going up.
If you like my analysis, please follow me as a token of appreciation :)
in.tradingview.com/u/SatpalS/
For learning and educational purposes only, not a trading advice. Pls consult your financial advisor before investing.

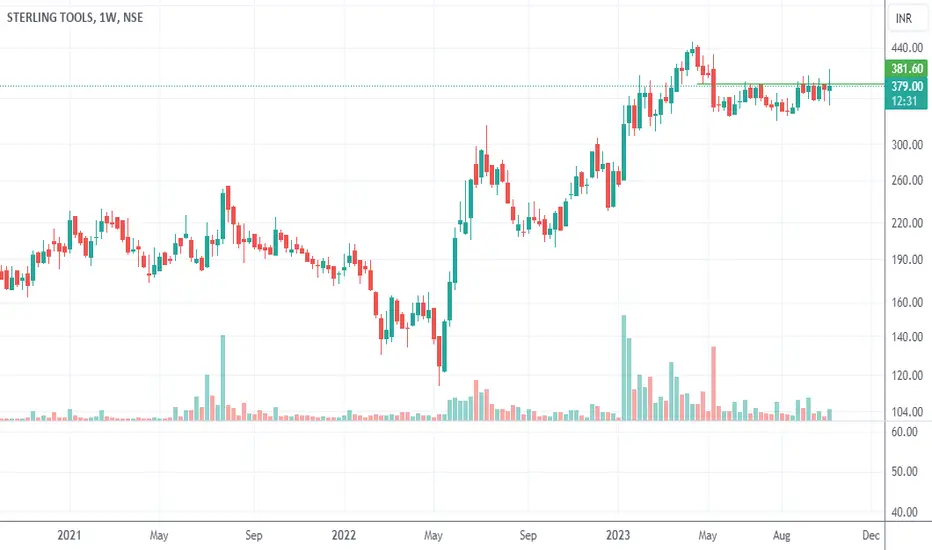
Keep an eye on THIS STRUCTURESTERLING TOOLS forming All time high breakout and restest structure. Just mark low to high FIBONACCI RET. and SEE.....

STERLING TOOLS 1WEEK 600++++SHORT TERM BREAKOUT 610 +++ 630 +++₹₹₹₹₹₹
TIME FRAME :- 1 -3 WEEK
Established in 1979, STL manufactures and markets high tensile cold forged fasteners, primarily for the automobile industry. STL was founded by the first generation entrepreneur, Mr. Manohar Lal Aggarwal, and has thereafter been managed by his two sons, Mr. Anil Aggarwal and Mr. Atul Aggarwal.

Breakout and Retest Almost Done in Daily, Weekly, and Monthly TFCan Enter When RSI is above 70
Stoploss Can be 10% (440)
Can Expect 20% Up Move
Note: For Educational purpose only

base formation breakout with strong volume -study before entry base formation breakout with strong volume -study before entry

Sterling Tools LOngthe stock breaks out above the handle, you expect it to rise by at least 5% based on the pattern, while the stop loss protects you by exiting the trade if the price falls below a certain level.(Trendline)

Sterling tools check the chartThe stock has given breakout of classic cup and handle pattern structure become invalid below the orange line and according to cup and handle pattern target is around 793

STERLING TOOLS LTD. LOOKS POISED FOR STRONG UPMOVESTERLING TOOLS LTD. Made a 16-Month Stage-1 base breakout today on strong volume. The trigger appears to be the deal with S Korea’s Yongin Electronics for EV components facility in India. It made its footprint clear last week itself, though B/O did not happen.
On this weekly chart RSI moved strongly above 60 for the first time after it went < 40 during mid-March 2024, and the RS Line crossed above its 52-week MA for the first time after Oct’ 2023. The stock looks poised for a strong up-move.
No recommendation. Only personal analysis for educational purposes. Please consult your Financial Advisor for any buy or sell decisions on the stock.

Potential upmove | Bottom fishing - STERTOOLSCheckout an amazing breakout happened in the stock in Weekly timeframe.
IMPORTANT BREAKOUT LEVELS ARE ALWAYS RESPECTED!
NOTE for learners: Place the breakout levels as per the chart shared and track it yourself to get amazed!!
#No complicated chart patterns
#No big big indicators
#No Excel sheet or number magics
Fundamentally it can be due to any major decisions in the management or tremendous performance shown or any such positive actions. Technically, it would have shown an upmove using MA or RSI breakout or any such analysis.
The secret sauce is not revealed here that how I pick my stocks, however the idea is shared as an educational material. This will also help me to keep a track of my accuracy in doing analysis. Hence & also, I request anyone not to take any positions based on the accuracy of my previous feeds or moving forward.
Checkout an amazing breakout happened in the stock in Weekly timeframe. Wait for weekly close above the breakout level.
Breakouts happening in longer timeframe is way more powerful than the breakouts seen in Daily timeframe. You can blindly invest once the weekly candle closes above the breakout line and stay invested forever. Also these stocks breakouts are lifelong predictions, it means technically these breakouts happen giving more returns in the longer runs. Hence, even when the scrip makes a loss of 10% / 20% / 30% / 50%, the stock will regain and turn around. Once they again enter the same breakout level, they will flyyyyyyyyyyyy like a ROCKET if held in the portfolio in the longer run.
Time makes money, GREEDY & EGO will not make money.
Also, magically these breakouts tend to prove that the companies turn around and fundamentally becoming strong. Also the magic happens when more diversification is done in various sectors under various scripts with equal money invested in each N500 scripts.
The real deal is when to purchase and where to purchase the stock. That is where Breakout study comes into play.
LET'S PUMP IN SOME MONEY AND REVOLUTIONIZE THE NATION'S ECONOMY!

Horizontal breakout in sterling toolsSterling tools is about to breakout a 6 year old high. This could be a possible swing trade with 30% upside potential it could reach 600.

Buy stertools for a target of 500Buy stertools for a target of 500 in 1 month, stock has given strong reversal and looks good, can be added to portfolio

sterling tools 2XStock is consolidating in a range. It may burst any time . Add to your watch list and enjoy the up trend.

Failing Wedge BreakoutBook profits within the first 30 minutes of the market opening
- Try to exit by taking 10-12% profit of each trade
- SL can be taken when the 5/15 min candle closes below 44EMA
Now, why do I prefer swing trades? The primary reason is that I have observed that 90% of the stocks give most of the movement in just 3-4 days and the rest of the time they either consolidate or fall
CMP- 367
Target Price 401
Note:- I am not SEBI Registered This Trade is only educational Purpose

Sterling Tools: Offering low risk opportunitySterling Tools is looking good on daily time frame. Stock is showing buying strength near support zone. Keep on radar.

Bullish symmetrical continuation triangle pattern formationBullish symmetrical continuation triangle pattern has been formed in daily chart of Sterling Tools . This pattern is characterized by converging trendlines, lower highs, and higher lows. It typically occurs during a consolidation period when the market is uncertain about its direction.
Here's a breakdown of the pattern:
Converging Trendlines: The pattern consists of two trendlines that converge, forming a triangle shape. The upper trendline connects the lower highs, while the lower trendline connects the higher lows. As time progresses, the price range between the trendlines narrows.
Decreasing Volume: During the formation of the pattern, trading volume tends to diminish. This decrease in volume reflects the market's uncertainty and lack of conviction regarding the future price direction.
Breakout and Confirmation: Before the triangle reaches its apex (the point where the trendlines converge), there is a breakout above the upper trendline. This breakout is accompanied by a noticeable increase in trading volume, which serves as confirmation of the pattern. The breakout and increased volume suggest a continuation of the prior uptrend.
Based on the daily chart analysis, it appears that the price has broken upward out of the consolidation period, indicating a continuation of the prior uptrend.
Traders and analysts who recognize this pattern may interpret it as a bullish signal, suggesting that the price is likely to move higher.
However, it's important to note that patterns alone cannot guarantee future price movements, and other factors should be considered in conjunction with the pattern analysis.
Note for everyone who came across this reference:
This chart analysis is only for reference purpose.
This is not buying or selling recommendations.
I am not SEBI registered.
Please consult your financial advisor before taking any trade.

Sterling Tools about to break Cup and Handle formationwatching out for consolidation formation near 390-80 zones for entry with max 6-7% stop. Due to gaps formed last week at the moment don't have stop loss of 6-7% range current stop is deep towards 330.
DISCLAIMER:
There is no guarantee of profits or no exceptions from losses.
The stock and its levels discussed are solely the personal views of my research.
You are advised to rely on your judgment while investing/Trading decisions.
Seek help of your financial advisor before investing/trading.
Investment Warnings:
We would like to draw your attention to the following important investment warnings.
-Investment is subject to market risks.
-The value of shares and investments and the income derived from them can go down as well as up.
-Investors may not get back the amount they invested - losing one's shirt is a real risk.
-Past performance is not a guide to future performance.
-I may or may not trade this analysis
--------------------------(((((LIKE)))))-------------------------------

Sterling Tool: Trading near breakout level on WTFSterling tool is looking good on weekly time frame. Stock is attempting breakout on weekly time frame. Keep on radar.

Swing trade opportunity in STERTOOLSSwing trade opportunity in STERTOOLS
Entry - 365.15
Targets - 400 & 420
DISCLAIMER: I am not SEBI registered and the ideas posted are only for educational purpose. Always trade with proper STOPLOSS.

STERLING TOOLSBack again in this counter because I spotted one of my all-time favorite patterns the Inverted Head and Shoulder Pattern just after a retest to the line of least resistance.
Good volumes.

This Small Cap Stock is getting ready for Investment !!Sterling tools given strong breakout to resistance level on daily timeframe. Its Outperforming the index and making new highs periodically. One should go long with Proper risk management above the high. Stock may also Pump up and the return back to retest current levels. Increaing Volumes are indicating good interest of buyers in this Small cap Stock.
