Sterlite Technologies: Technical Analysis and Long-TermBat Pattern Formation: Sterlite Technologies has established a Bat pattern, which is often interpreted as a bullish reversal signal, indicating potential for future price increases.
Recent Decline: The stock has declined approximately 18% from its most recent high, suggesting it may be undervalued and offering a potential buying opportunity.
Long-Term Investment Potential: Given the technical indicators and recent price action, Sterlite Technologies presents a promising option for long-term investors looking to capitalize on potential market recovery.
STLTECH trade ideas

Sterlite Technologies Ltd - Near Breakout.Sterlite Technologies Limited was established in July 2001 after the demerger of the telecom division of Sterlite Industries Ltd (SIL). In July 2006, STL acquired the transmission line business of SIL to foray into the power transmission cables business. STL has grown over the years to become the largest Optical Fiber and Optical Fiber Cables manufacturer in the country. The company also has sizeable presence in the overseas markets with an established presence in the global optical fiber market.
The company’s global ex-China Optical Fiber Cables (OFC) market share was 8% in FY24 vs 12% in FY23. It is among the largest and lowest-cost producers of Optical Fibre and OFC in India because of extensive backward integration.
Order Book
As of Q4 FY24, the company's order book stood at Rs. ~10,200 Cr vs Rs. ~9,800 Cr in Q3 FY24.
Telcos: 59%
Citizen Networks: 22%
Enterprises: 19%.
Optical Connectivity portfolio in US
On 29 July 24, the company announce the expansion of its Optical Networking capability with the addition of its Optical Connectivity portfolio in the US market.
Market Cap: ₹ 5,723 Cr.
Promoter holding: 44.4 %
FII holding: 6.74 %
DII holding: 11.3 %
Public holding: 37.5 %
Debt: ₹ 1,926 Cr.
Debt 3 Years back: ₹ 3,475 Cr.
Note: Debt is decreasing
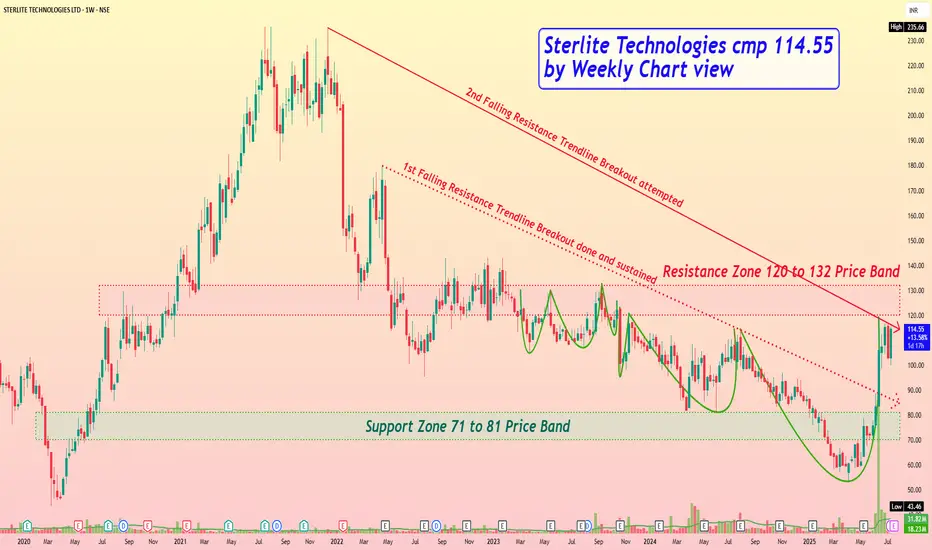
Sterlite Technologies cmp 114.55 by Weekly Chart viewSterlite Technologies cmp 114.55 by Weekly Chart view
- Support Zone 71 to 81 Price Band
- Resistance Zone 120 to 132 Price Band
- 2nd Falling Resistance Trendline Breakout attempted
- 1st Falling Resistance Trendline Breakout done and sustained
- Volumes spiked heavily over past few days by demand based buying
- Repeated Bullish Rounding Bottoms indicate probable Breakout above Resistance Zone neckline
STLTECH – Consolidating After a Big Bang? CMP: ₹105.95 |STLTECH – Consolidating After a Big Bang?
CMP: ₹105.95 | Chart: 5-min | Date: June 22, 2025
📊 Chart Observations
Stock saw a massive spike in volume and price around ₹117, followed by a consistent drift lower
For the last 2 sessions, it's been forming a tight base between ₹104–107, showing signs of absorption
Volume dried up — a typical cool-off zone before next move
🔍 Key Levels
Support Zones
₹104 – Base of current consolidation
₹100 – Psychological round number + demand zone
Resistance Zones
₹108 – First sign of strength
₹112 – Gap-down resistance
₹117 – Supply zone from recent spike
🧩 Trade Setup
🔹 Intraday Plan
📌 Entry: ₹106–107 with volume spike
🎯 Target: ₹108.50–110
🛑 SL: ₹104
🔹 Swing (3–5 Days)
📌 Entry: Only if price crosses ₹108 with strong volume
🎯 TGT 1: ₹112
🎯 TGT 2: ₹117
🛑 SL: ₹103
⚡️ Why It’s on Radar
Explosive move previously hints at smart money interest
Current narrow range = low risk setup
Fresh volume at support on June 22 closing tick could trigger early action tomorrow
📅 Game Plan For Tomorrow
Watch early 15-min range
Breakout + volume above ₹107 = Buy
Failure to hold ₹104 = Avoid
🚨 Avoid Below: ₹102 (shows breakdown of structure)
🧠 Caution: Needs volume confirmation, else could remain range-bound
#STLTECH #BaseFormation #BreakoutStocks #BTST #VolumePlay #SwingTrade #TechnicalSetup #TradingViewIndia #WatchlistAlert

Connecting the World, ResponsiblySterlite Technologies Limited - STLTECH - CMP 106
About
Sterlite Technologies Limited was established in July 2001 after the demerger of the telecom division of Sterlite Industries Ltd (SIL). In July 2006, STL acquired the transmission line business of SIL to foray into the power transmission cables business. STL has grown over the years to become the largest Optical Fiber and Optical Fiber Cables manufacturer in the country. The company also has sizeable presence in the overseas markets with an established presence in the global optical fiber market.
STERLITE TECH:
STERLITE TECH launches AI-optimized data centre solutions and partners with Tech Data for India expansion.
Products target hyperscalers, enterprises, telecoms; meet global standards with 25-year warranty.
STERLITE TECHNOLOGIES: CO AND C-DOT ACHIEVE INDIA’S FIRST QUANTUM-SECURED NETWORK BREAKTHROUGH WITH MULTI-CORE FIBRE
Sterlite Technologies: Promoter Ankit Agarwal bought 2.58 lakh shares. Promoter Pravin Agarwal bought 7.35 lakh shares. (Positive)
This is just to boost my confidence. No Suggestions for buying. I will keep checking and updating my mistake if last post gone wrong...
Disclosure: I am not SEBI registered. The information provided here is for educational purposes only. I will not be responsible for any of your profit/loss with these suggestions. Consult your financial Adviser before making any decisions.

Sterlite Tech: From Despair to Breakout – A Textbook Turnaround NSE:STLTECH : From Despair to Breakout – A Textbook Turnaround Story in the Making. It makes it to my chart of the week Idea after breaking out with good volumes.
Price Action Analysis:
-Recent Action: Strong green candle with significant body suggesting institutional accumulation
-Candle Structure: Minimal upper shadow indicates buying pressure throughout the session
-Previous Action: Series of consolidation candles around ₹85-95 showing accumulation phase
-Breakout Candle: Wide-range bar breaking above downtrend resistance with conviction
Price Swing Analysis:
-Higher Highs/Higher Lows: Recent price action shows initial signs of trend reversal
-Momentum Shift: Price moving from range-bound to trending behaviour
-Gap Analysis: No significant gaps visible, suggesting organic price discovery
Volume Spread Analysis (VSA):
Current Weekly Bar Analysis:
-Volume: 302.33M (Exceptionally high - 12x average volume)
-Spread: Wide range bar with substantial price movement
-Close Position: Closing in the upper 75% of the range
-VSA Interpretation: Professional Money Accumulation - High volume with wide spread and strong close
Volume-Price Relationship Breakdown:
Phase 1 (2022-2023): Distribution & Selling Climax
-High volume on down bars during the initial decline
-Volume spikes coinciding with major price drops
-Classic distribution pattern with professional selling
Phase 2 (2023-2024): Accumulation Phase
-No Supply Bars: Low volume on down bars indicates selling exhaustion
-Testing for Supply: Multiple tests of the ₹50-60 zone with reducing volume
-Background Volume: Consistently low volume, suggesting minimal selling pressure
Phase 3 (Late 2024-2025): Mark-up Beginning
-Effort vs Result: Increasing volume with improving price action
-Spring Action: False break below support, followed by quick recovery
-Current Bar: Classic "Upthrust After Accumulation" with massive volume
Volume Spread Analysis Summary:
Key VSA Signals Identified:
-Selling Climax: Evident in 2022 with high volume and wide down bars
-No Supply: Consistent pattern during 2023-2024 base formation
-Spring/Shakeout: Brief dip below ₹58 with immediate recovery
-Effort to Rise: Current massive volume surge on breakout attempt
-Professional Interest: Volume pattern suggests smart money accumulation
Chart Structure Breakdown:
-Base Formation: Classic Multi-Year Cup Base spanning approximately 3 years (2022-2025)
-Base Duration & Depth: 36+ months with a devastating 85% decline from peak (₹318 to ₹50 lows)
Volume Characteristics:
- Volume dried up significantly during the base formation phase
- Massive volume surge (302.33M vs 24.45M average) accompanying the recent breakout attempt
- Classic accumulation pattern with low volume during decline and high volume on breakout
Key Levels:
Support Levels:
- Primary Support: ₹58-60 (recent low and base formation floor)
- Secondary Support: ₹75-80 (previous resistance turned support)
Resistance Levels:
- Immediate Resistance: ₹125-130 (downtrend line resistance)
- Major Resistance: ₹193-200 (previous significant level)
- Ultimate Resistance: ₹242-250 (prior consolidation zone)
- Breakout Zone: ₹108-112 (current breakout level with volume confirmation)
Price Patterns:
-Primary Pattern: Multi-year Cup Base with potential Handle formation
-Current Action: Breakout from 3-year downtrend line with explosive volume
-Volume Confirmation: 12x volume surge validates the breakout authenticity
-Pattern Reliability: High probability setup given the extended base duration and volume characteristics
Trade Setup:
Entry Strategy:
Primary Entry: ₹110-112 on sustained breakout with volume above 50M
Add-on Entry: ₹115-118 on momentum continuation or successful retest of breakout zone
Early Entry: ₹105-107 for aggressive traders betting on breakout confirmation
Exit Strategy:
Initial Target: ₹140-145 (measured move from base depth)
Secondary Target: ₹175-180 (intermediate resistance zone)
Ultimate Target: ₹200+ (major resistance retest)
Trail SL: Use a 20% trailing stop once the initial target is achieved
Stop-Loss and Risk Management:
Ideal Stop-Loss: ₹95-98 (below breakout zone invalidation)
Conservative SL: ₹88-90 (below recent swing low with buffer)
Position Sizing: Risk 1.5-2% of portfolio capital given the high-conviction setup
Risk-Reward: Attractive 1:3 to 1:4 ratio to initial targets
Sectoral and Fundamental Backdrop:
Sector Outlook:
Sector: Telecom Infrastructure & Optical Fiber - benefiting from 5G rollout momentum
Relative Strength: Telecom capex cycle turning positive with the government's digital infrastructure push
Peer Performance: Optical fiber and telecom equipment stocks showing renewed interest
Stock Fundamentals:
Business Turnaround: The Company has been restructuring operations and reducing its debt burden
Growth Catalyst: 5G infrastructure deployment and the government's Digital India initiatives provide tailwinds
Financial Health: Improving operational efficiency, though still in recovery phase
Technical-Fundamental Alignment: Multi-year base formation coincides with business restructuring completion
Overall Trade Summary:
Reward-to-Risk Ratio: 3.5:1 to initial target, extending to 5:1+ for swing targets
Conviction Level: High- Textbook cup base with volume confirmation.
Ideal Trader Profile:
- Swing Traders: 4-8 week holding period for initial targets
- Positional Traders: 6-12 month horizon for major resistance retest
- Momentum Players: Quick 15-20% moves on breakout continuation
Key Insight: "After 3 years of pain, Sterlite Tech is displaying all the hallmarks of a classic turnaround story - the kind that can deliver multi-bagger returns for patient capital."
Key VSA Insight: "The 12x volume surge represents the moment when smart money stops accumulating and starts marking up - a classic VSA signal for trend initiation."
My Take:
Trade Thesis: This represents a high-probability, low-risk entry into a fundamentally improving story at a technically optimal juncture. The combination of multi-year base, volume breakout, and sector tailwinds creates a compelling risk-adjusted opportunity.
Keep in the Watchlist.
NO RECO. For Buy/Sell.
📌Thank you for exploring my idea! I hope you found it valuable.
🙏FOLLOW for more
👍BOOST if you found it useful.
✍️COMMENT below with your views.
Meanwhile, check out my other stock ideas on the right side until this trade is activated. I would love your feedback.
Disclaimer: "I am not a SEBI REGISTERED RESEARCH ANALYST AND INVESTMENT ADVISER."
This analysis is intended solely for informational and educational purposes and should not be interpreted as financial advice. It is advisable to consult a qualified financial advisor or conduct thorough research before making investment decisions.
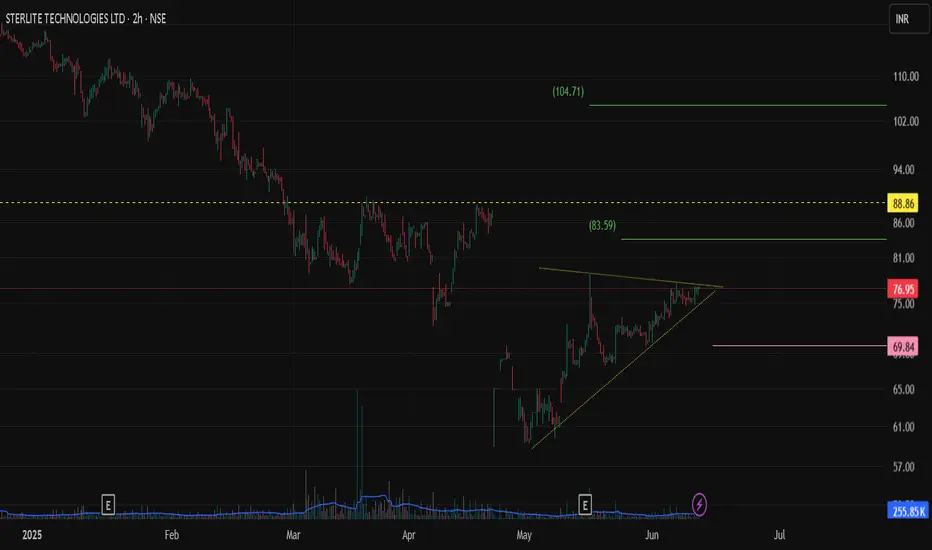
STLTECH- Swing Buy - Trend Reversal Strenght PatternSTLTECH
showing strenght in reverse
TRADE= SWING
STOP = 69.8 - 9%
TP = 83, 88, 104 - 9%, 15%, 35%
HOLDING = 5 days to 1 month
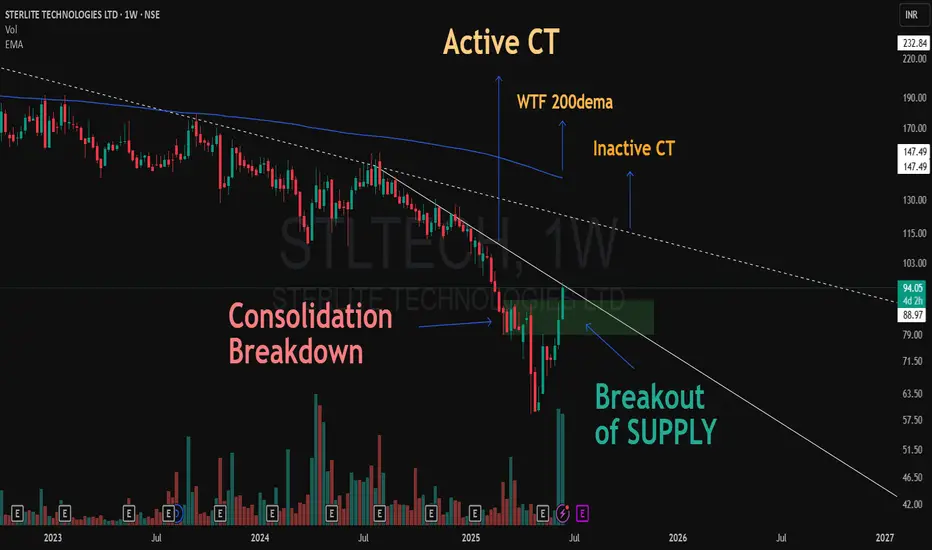
From Breakdown to Breakout: A V-Shaped Surprise!This chart of Sterlite Technologies (W1) tells a compelling price action story:
📉 The stock initially consolidated at a demand zone, only to break down sharply, flipping that zone into a fresh supply area.
💥 What followed was a strong V-shaped recovery, accompanied by significant volume expansion.
🚀 The reclaimed supply zone was decisively taken out, leading price right into the Active Counter Trendline (CT).
🔁 This Active CT now stands as a key structure; the stock needs to form a higher low near the reclaimed demand zone for structural strength.
⚠️ Ahead, we have two higher-timeframe resistances in sight:
📏 An Inactive Weekly CT (dotted)
📡 The WTF 200 DEMA, a major trend filter
While this is not a call or forecast, the shift in structure, volume, and reclaiming of supply tells a story of possible trend transition — something worth keeping on the radar.
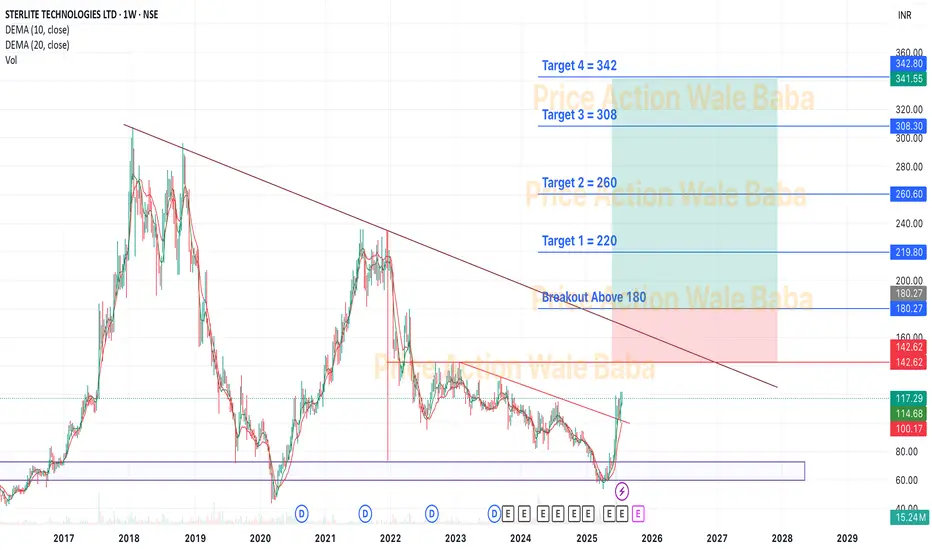
Can we see a shart upside soonBuy Sterlite tech cmp 116 target 270, 700+
Great accumulation is going on.
FII increased the stake
Profits are improving.
Couple of big orders in place and change of management (old unperforming management)

Sterlite technologies bullish and gaining strength on daily timesterlite technologies is bullish and gaining volume, it recently bagged the order from bsnl and is gaining strength on daily time frame, keep the SL at 114 and enjoy the move till 135 zone which looks easy for next available supply zone is there

Sterlite Technology Touching Multi year Support zone.Sterlite Technology is to be kept on radar now. Goldman Sachs & LIC are holding the equity. MF have also increased the holdings. Since Jan 2024 the stock has witnessed increased delivery %.
Accumulate at current level of 119
SL 118
Consult your financial advisor before investing, this is for educational purpose only.

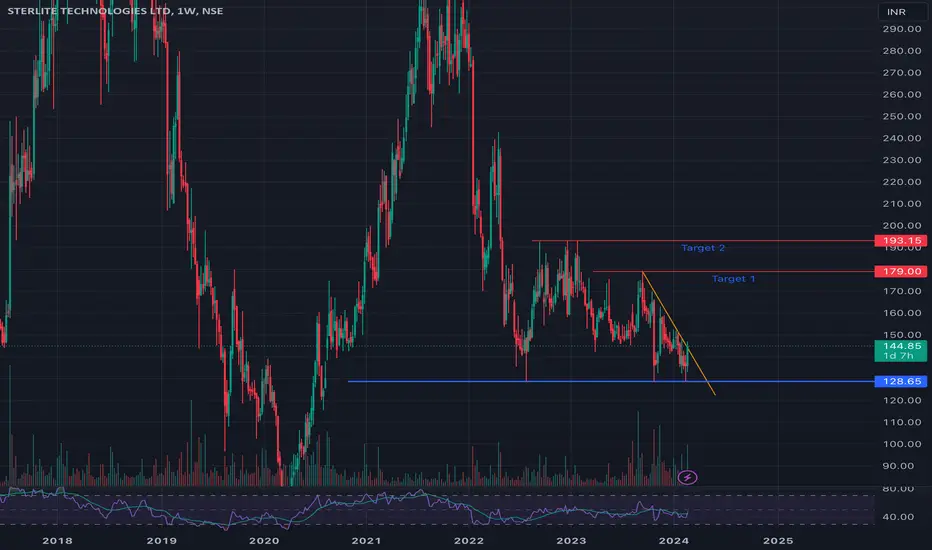
Support levels for Sterlite Technologies (STLTECH)STLTECH is currently near the support level of 132.28 and the next possible support level is at 126.90

STERLITE TECHNOLOGIES LTD Chart AnalysisConsider this chart analysis as a case study rather than a basis for taking a position. The company's business dynamics are currently volatile, but it has potential and could be worth monitoring over the next few quarters.

Sterlite Technologies, currently at support on monthly chartsWith chart showing turn around,took support of 110 levels on monthly and quaterly charts. A good volume candle on monthly should be good for entry with targets 0f 200 and 260 with an investment point of view.

Sterlite Technologies Limited medium term Sterlite Technologies Limited medium-term time frame
Double Bottom seen in April 2024 & June 2024
Please Follow Sl Of 120
Tar 160 & 220

Sterlite - Double bottom formation - Best Above 145Sterlite Tech - have bounced the base and formed a double bottom formation.
FII's /DII's have raised their stakes while Promoters have reduced.
There is a Double bottom neckline breakout at 140. One can take safe bet above 145 and average upwards. Targets 175/240/316 and above that Open Sky.
Strict stop loss of 125.
Disclaimer : Educational Content. Please do your own research.
My earlier views on this chart. I see mostly promoters selling their stakes to FII/DII's as the only change.

STLTECH- SG type 3STLTECH- SG type 3
1) Perfect w but VOlume gadbad hai, its decreasing with green candles upwards lets see what happens

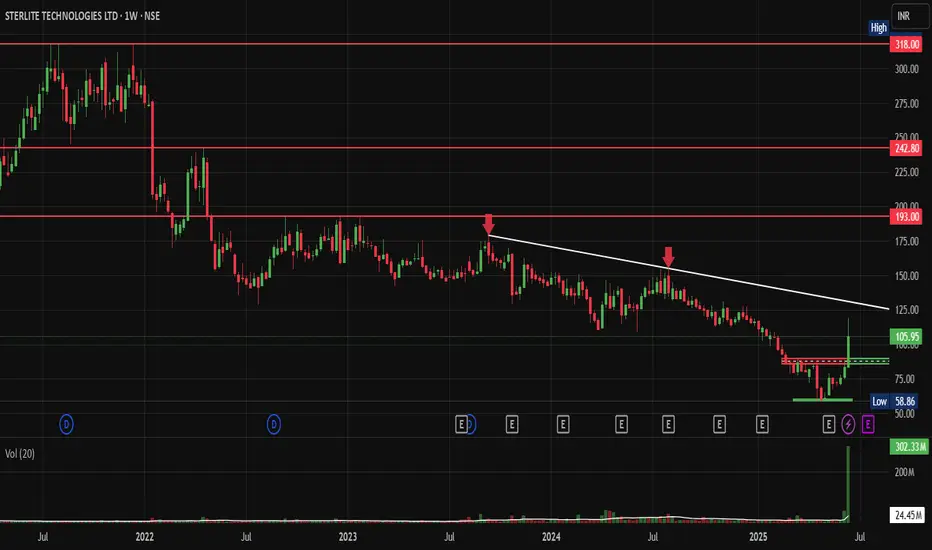
Sterlite Tech- Is it Going for Another Top..In technical analysis, we examine historical data of an instrument to anticipate its future course of action. We all would agree that Price and volume are the primary and perhaps the purest form of data in technical analysis and that’s why some traders, including me, are always more inclined towards them. In this idea, I would like to share some of my observations on Sterlite Tech. which just caught my attention due to the following reasons.
2018 TOP
On the left side of the chart, we had a strong uptrend followed by a top formation. Calling it a double top won’t be a misnomer. Almost a yearlong formation and then a sharp breakdown.
2021 TOP
The stock bottoms out in 2020 with an Inverted Head and Shoulders pattern and reverses up back into 2018 top. The stock spends almost 6months in this zone (300) and forms another top here in 2021.
BREAKDOWN FAILURE
On the right-hand side, we can see a huge consolidation (into the inverted H&S of 2020) from July2022 to Feb2024 and then a breakdown of support (128). But this breakdown could not hold, and the stock is now back above 128, indicating a breakdown failure.
ANOTHER TOP
Generally, we see a sharp rally after a breakdown failure. If that happens, the stock may rally for 2021 top (260 or so). As per timeline, the previous tops were formed in 2018 and 2021. We may expect another one with a 3years gap, that is by the end of 2024.
However, we should never lower our guard and approach cautiously if the stock fails to sustain above 125 again. That would require another take on the stock.
I hope you found this analysis useful.
Do press 🚀 and comment for more such analysis in future.

BUY TODAY SELL TOMORROW for 5%DON’T HAVE TIME TO MANAGE YOUR TRADES?
- Take BTST trades at 3:25 pm every day
- Try to exit by taking 4-7% profit of each trade
- SL can also be maintained as closing below the low of the breakout candle
Now, why do I prefer BTST over swing trades? The primary reason is that I have observed that 90% of the stocks give most of the movement in just 1-2 days and the rest of the time they either consolidate or fall.
INSIDE BAR Breakout in STLTECH
BUY TODAY SELL TOMORROW for 5%

Sterlite Tech - Looks good above 150Consider this chart for buying after it crosses above 150 on a weekly closing basis.
Capex undertaken by the company which could yield good sales in future.
Rights issue also expected in near future.
Stop Loss and all potential targets plotted on the chart

STLTECH WEDGE BREAKOUTSTLTECH broke wedge pattern and its in a correction and now it formed a bullish hammer pattern as well.so look for a buy,the first target itself gives 18% from CMP.once that resistance broken it might give near 50% as its next resistance is 242.

Sterlite Technologies Analysis- Strong Trend Breakout: Sterlite Technologies has experienced a very strong breakout after a 5-month consolidation period. This breakout suggests a potential shift in the stock's trend towards the upside.
- High Volume Confirmation: The breakout is supported by very high trading volume, indicating strong buying interest and validating the breakout.
- Strong Candle Closing: The stock has closed strongly above the trendline and the 50-day Exponential Moving Average (EMA). This is a bullish signal, suggesting that the stock may continue to move higher.
- Technical Outlook:
- Breakout Confirmation: The breakout from a long consolidation period is a strong signal of a potential uptrend.
- Volume Analysis: The high trading volume accompanying the breakout confirms the strength of the move and suggests that there may be further upside potential.
- EMA Support: Closing above the 50-day EMA is a positive sign, indicating that the stock is gaining strength and may continue to rise.
### Conclusion:
Sterlite Technologies has experienced a very strong breakout after a 5-month consolidation period, with high volume confirming the move. The strong candle closing above the trendline and the 50-day EMA further supports the bullish outlook for the stock. Traders and investors should monitor the stock's price action for further confirmation of the uptrend and consider potential entry points based on their trading strategies.

STLTECH Looking for breakoutTaking support at 128 on monthly chart. Breaking trendline at 144 on Daily and Weekly chart. Allow weekly candle to complete. Wait for retest and buy at breakout.