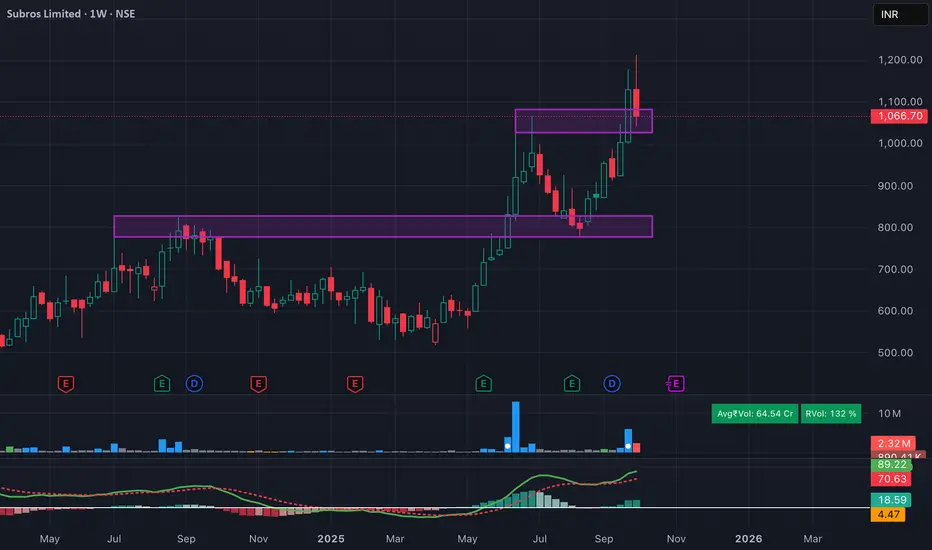
Subros Ltd – Breakout Retest in ProgressSubros recently gave a strong breakout above 1,050–1,100 zone but faced selling pressure near the highs. Price is now retesting the breakout zone, which is a common & healthy technical move before resuming higher. Volumes and momentum indicators still support the broader uptrend.
📌 Swing Trade Setup
Entry Zone: Current levels (1,060–1,080)
Stop Loss (SL): 990 (Weekly closing basis)
View: As long as price holds 990, the structure remains bullish with potential for trend continuation in the coming weeks.
Trade ideas
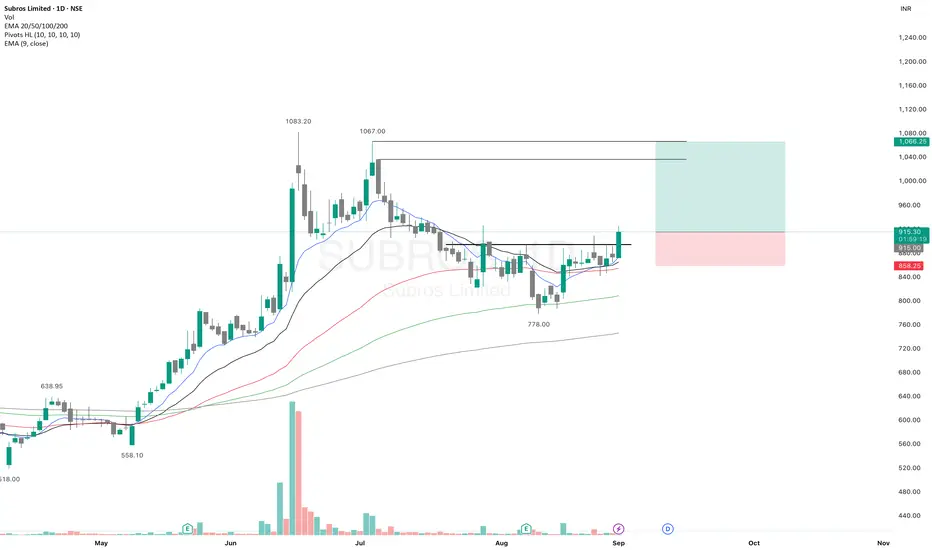
SUBROSSUBROS – After making an ATH, the price retraced and formed a new swing low at 778, followed by a brief consolidation.
Today, it has broken above the immediate resistance and is showing signs of strength.
All key EMAs are now aligned, further supporting the bullish setup.
✅ If you like my analysis, please follow me as a token of appreciation :)
in.tradingview.com/u/SatpalS/
📌 For learning and educational purposes only, not a recommendation. Please consult your financial advisor before investing.
Subros (D) - Hits New ATH, Breaking Out of ConsolidationSubros has demonstrated exceptional strength, surging to a new All-Time High (ATH) today with a significant +10.45% gain . This powerful move was supported by a massive spike in trading volume, suggesting the potential end of the sideways consolidation phase that has been in place since June 2025.
Comprehensive Bullish Confirmation 👍
The breakout is validated by a strong alignment of bullish signals across all major timeframes:
- Multi-Timeframe Momentum: The Relative Strength Index (RSI) is indicating a bullish state on the monthly, weekly, and daily charts , showcasing broad-based strength.
- Short-Term Confirmation: The short-term Exponential Moving Averages (EMAs) are in a strong bullish crossover, confirming the immediate upward momentum.
- Volume Thrust: The breakout was accompanied by an exceptionally high volume spike , indicating strong conviction from buyers.
Outlook and Key Levels
Following a significant breakout, a retest of the previous resistance trendline as new support would provide strong confirmation of a continued uptrend.
- Bullish Case 📈: If the upward momentum is sustained, the next potential price target on the upside is ₹1,347 .
- Bearish Case 📉: Conversely, if the breakout fails to hold and momentum is lost, the stock could pull back to find support near the ₹916 level.
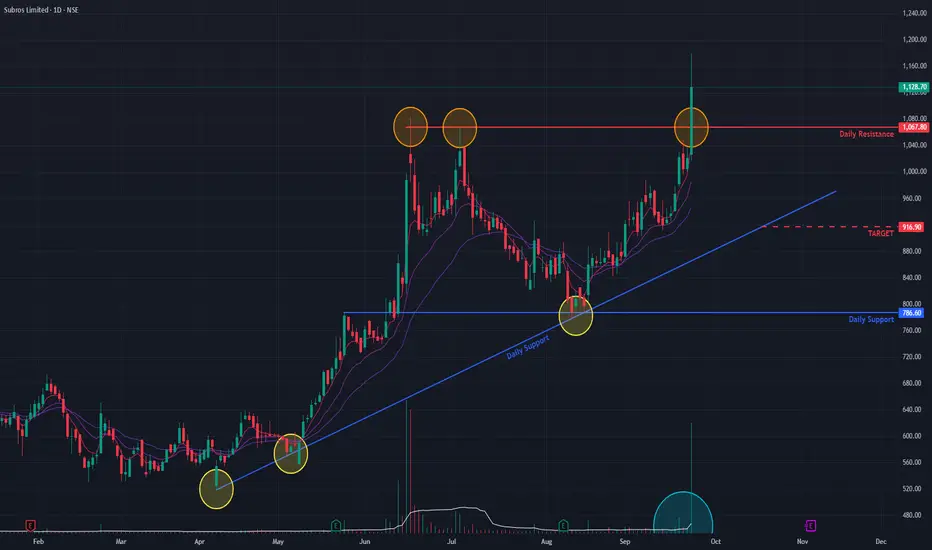
Resistance to support:Subros800 levels have acted as good resistance in sept 24 and now after a year it has acted as support.
This level is also 20week sma.
Target and SL on chart. This makes it a high probability bullish trade.
It will take 5~8 months for target.
#SUBROSAsset: Subros Ltd (SUBROS)
Breakout Level: 890
Potential Target: 1075
Stop Loss: 850 (~4%)
Timeframe: Short to Low Medium term
Risk to Reward ratio : 1:2
Rationale:
Fundamentals -
Fundamentally decent stock with the following attributes:
* ROCE - 20.9%
* ROE - 14.7%
* Debt to Equity - 0.00
* Stock PE 36.3 / Industry PE - 33.3 || Stock PBV 5.19 / Industry PBV 4.21 - Company is slightly overpriced
* EPS / Revenue - Increasing
Technicals -
⦁ The price has started to bounce off of 50% retracement which coincided roughly with the 100 DMA
⦁ The 200 DMA slope is giving a positive expectancy
⦁ 10 DMA is beginning to go above the 20 DMA indicating a short term move
⦁ Low volume pull back / consolidation
⦁ Price was generally in an uptrend and then experienced a pull back of ~27% (less than 30%)
Market analysis
* FIIs and Promoters have held steady without any sign of dilution
⦁ MFs are increasing stake this quarter
Cons
* Upside potential forecast is limited however that is speculative
This analysis is for educational purposes only and should not be considered as financial advice. Trading and investing in financial markets involve significant risk, and past performance is not indicative of future results. You should conduct your own research and consult with a qualified financial advisor before making any trading or investment decisions. The author is not responsible for any financial losses or damages that may result from the use of this information.

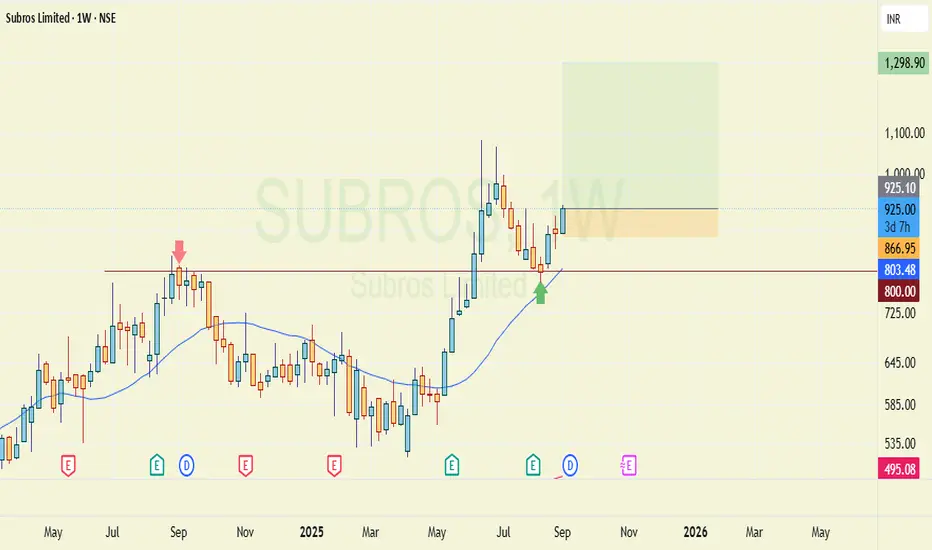
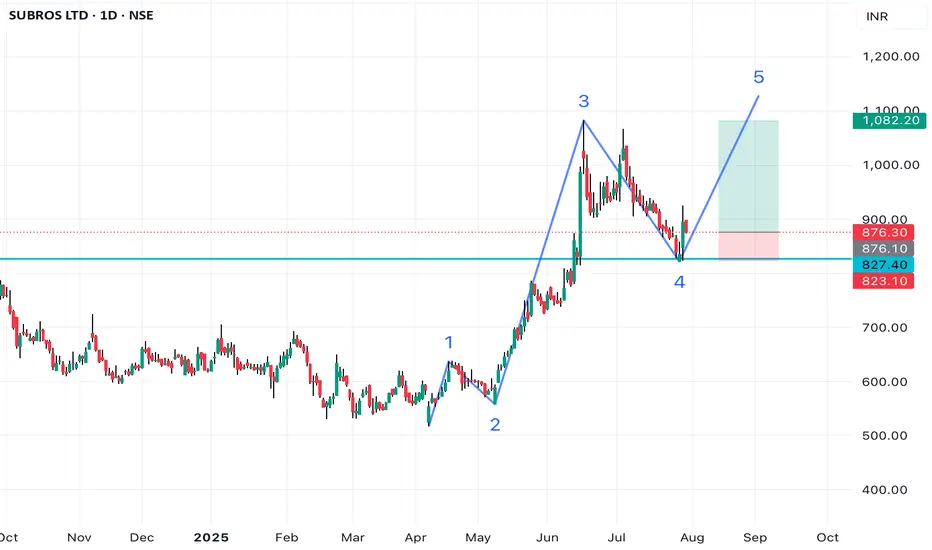
SUBROS may have started 5th waveThe stock is in clear uptrend on higher time frames (Weekly & Monthly).
It has given a break out on weekly time frame and now has come to retest the same level.
In daily TF we can see the bullish candle on support and a corrective wave (A-B-C).
It has also taken support on 50 EMA.
So the confluence of the 2 context gives some conviction on this chart. If NIFTY goes up then the chances of this stock going up increase dramatically.
NOTE: Pls do not take this as an advice, Just sharing my study.
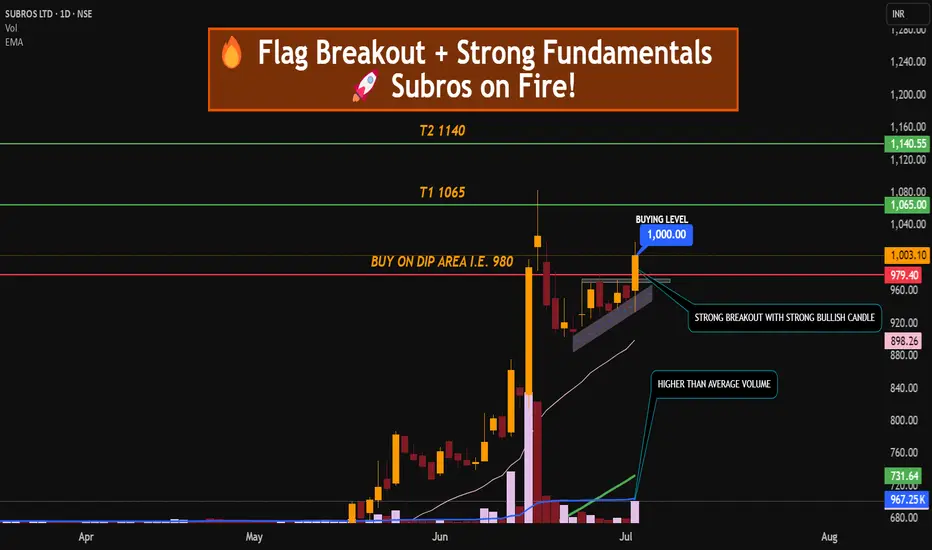
FLAG BREAKOUT + STRONG FUNDAMENTAL = AUTO STOCK ON THE MOVE SUBROS ON FIRE
Subros Ltd has formed and broken out of a bullish flag pattern on the daily chart, supported by strong volume, indicating continuation of its upward trend.
🔍 Technical Analysis:
Pattern: Bullish flag breakout
Breakout Confirmation: Strong bullish candle above consolidation (flag zone) with volume
Strong uptrend, supported by both EMA 20 and EMA 50
Support Zone: ₹950–₹960 (previous flag top)
Volume Spike: Confirms bullish momentum on breakout
QUIK FUNDAMENTAL KEYS WHICH CONFIRM ITS BULLISHNESS.
📈 Price Strength: Strong momentum with recent 52-week high
💰 ROCE: ~17.3% (efficient capital usage)
🏦 ROE: ~12.5% (shareholder return strength)
📉 Debt to Equity: ~0.2 (low debt = financially stable)
📊 Net Sales Growth: ~20% YoY (consistent top-line growth)
🔧 Sector: Auto Ancillary – strong demand recovery cycle
💡 Trade Rationale:
Subros is technically strong with a clean flag breakout and volume confirmation. Fundamentals support this move, with consistent revenue growth, efficient capital usage, and a low-debt structure.
TRADE PLAN :
Entry: Around ₹1000 (CMP) or on dip near ₹960–₹970 (retest)
Stop Loss: ₹940 (below consolidation)
Target 1: ₹1065
Target 2: ₹1120–₹1140
Risk-Reward: ~1:2.5+
Amazing breakout on WEEKLY Timeframe - SUBROSCheckout an amazing breakout happened in the stock in Weekly timeframe, macroscopically seen in Daily timeframe. Having a great favor that the stock might be bullish expecting a staggering returns of minimum 25% TGT. IMPORTANT BREAKOUT LEVELS ARE ALWAYS RESPECTED!
NOTE for learners: Place the breakout levels as per the chart shared and track it yourself to get amazed!!
#No complicated chart patterns
#No big big indicators
#No Excel sheet or number magics
TRADE IDEA: WAIT FOR THE STOCK TO BREAKOUT IN WEEKLY TIMEFRAME ABOVE THIS LEVEL.
Checkout an amazing breakout happened in the stock in Weekly timeframe.
Breakouts happening in longer timeframe is way more powerful than the breakouts seen in Daily timeframe. You can blindly invest once the weekly candle closes above the breakout line and stay invested forever. Also these stocks breakouts are lifelong predictions, it means technically these breakouts happen giving more returns in the longer runs. Hence, even when the scrip makes a loss of 10% / 20% / 30% / 50%, the stock will regain and turn around. Once they again enter the same breakout level, they will flyyyyyyyyyyyy like a ROCKET if held in the portfolio in the longer run.
Time makes money, GREEDY & EGO will not make money.
Also, magically these breakouts tend to prove that the companies turn around and fundamentally becoming strong. Also the magic happens when more diversification is done in various sectors under various scripts with equal money invested in each N500 scripts.
The real deal is when to purchase and where to purchase the stock. That is where Breakout study comes into play.
Check this stock which has made an all time low and high chances that it makes a "V" shaped recovery.
> Taking support at last years support or breakout level
> High chances that it reverses from this point.
> Volume dried up badly in last few months / days.
> Very high suspicion based analysis and not based on chart patterns / candle patterns deeply.
> VALUABLE STOCK AVAILABLE AT A DISCOUNTED PRICE
> OPPURTUNITY TO ACCUMULATE ADEQUATE QUANTITY
> MARKET AFTER A CORRECTION / PANIC FALL TO MAKE GOOD INVESTMENT
DISCLAIMER : This is just for educational purpose. This type of analysis is equivalent to catching a falling knife. If you are a warrior, you throw all the knives back else you will be sorrow if it hits SL. Make sure to do your analysis well. This type of analysis only suits high risks investor and whose is willing to throw all the knives above irrespective of any sectoral rotation. BE VERY CAUTIOUS AS IT IS EXTREME BOTTOM FISHING.
HOWEVER, THIS IS HOW MULTIBAGGERS ARE CAUGHT !
STOCK IS AT RIGHT PE / RIGHT EVALUATION / MORE ROAD TO GROW / CORRECTED IV / EXCELLENT BOOKS / USING MARKET CRASH AS AN OPPURTUNITY / EPS AT SKY.
LET'S PUMP IN SOME MONEY AND REVOLUTIONIZE THE NATION'S ECONOMY!
Subros Ltd. on the Move: Key Breakout and Strong Growth Drivers!Stock: Subros Ltd.
NSE Symbol: NSE:SUBROS
Industry Group: Auto/Truck-Original Equipment
Market Cap: INR 4,900 crore
50-Day Avg. Volume: INR 16 crore
Buy Range: INR 777-816
Company Overview:
Subros Limited, established in 1985, is a leading manufacturer of thermal products for automotive applications in India. The company operates multiple manufacturing plants across India and boasts a robust R&D center in Noida, developed in collaboration with Denso Corporation of Japan.
Ownership:
Indian promoters: 36.79%
Denso Corporation, Japan: 20%
Suzuki Motor Corporation, Japan: 11.96%
Manufacturing Capabilities:
Six manufacturing plants in India
Annual capacity: 1.5 million AC kits
Q1 FY25 Results Update:
Revenue: Increased by 16.8% y/y to INR 809.8 crore, driven by higher volumes and a new SOP launch.
EBITDA: Increased by 65% y/y to INR 80.4 crore.
EBITDA Margin: Expanded by 190bps y/y to 9.96% due to softening commodity prices.
PAT: Increased by 159% y/y to INR 34.9 crore.
Growth Drivers:
Content Localization:
Achieved 85% localization, aiming for 90% over the next three years.
Aims to reduce risks from exchange rate volatility and logistics disruptions.
Mandatory Air-Conditioned Cabins in Trucks:
New regulation mandates AC cabins in trucks from October 1.
Subros is positioned as a key beneficiary, with advanced discussions with OEMs.
Increasing Penetration in EV Buses:
Government plans to boost EV bus penetration.
Subros has developed kits for EV buses, offering higher revenue potential compared to ICE buses.
Strong Future Outlook:
The management is optimistic about sustaining double-digit growth, barring any significant external disruptions. The penetration of air conditioners in trucks is expected to improve significantly from the current 15-17%. The company's strong localization strategy will support its profile over the next few quarters.
Technical Analysis:
The provided chart shows that Subros Ltd. is currently trading near resistance levels after a recent breakout. Here are some key observations:
Resistance Level: The stock has faced resistance around the INR 800-820 range.
Volume: Trading volume has been steady, with some spikes on upward moves, indicating interest at these levels.
Trend: The stock is in an uptrend, supported by key moving averages

Getting ready for New ATH+ Consolidating around ATH
+ volume & Volatility contraction
+ Above Key EMAs

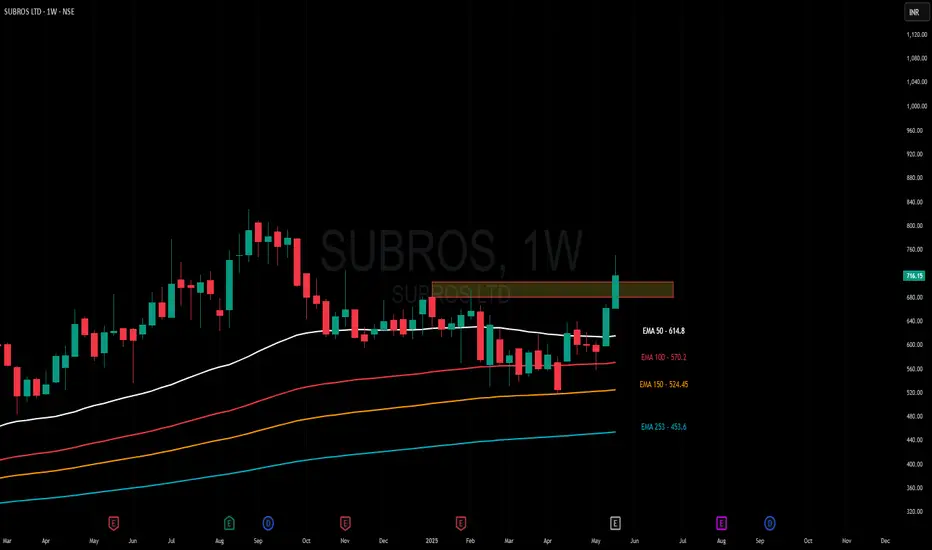
SUBROS LTD - CONSOLIDATION BREAKOUT Subros Ltd. is an interesting stock with following
1. RSI on all time frames DWM above 60
2. Narrowing Bollinger Bands on daily and Weekly time
3. Price Trading by touching upper Bollinger bands on both daily and weekly
4. Strong price breakout of more than 7 months long consolidation in price zone of 512 - 710 with huge Eiffel tower like volume candles on daily chart
5. ABCD Pattern under formation on Weekly chart
6. Major support near 640- 680 zone as price can re-test the breakout zone
Lets See How it Evolves.
Disclaimer: NOT A BUY / SELL RECOMMENDATION I am not an expert I just share interesting charts here for educational purpose and not to be taken as buy/sell recommendation. Please seek expert opinion before investing and trading as trading/ investing in market is subject to market risks. I do not hold any position in the stock as on date but I may look to buy on dips with my own Risk Reward matrix.

Buy when price retreats to 500Buy when price retreats to 500 with 460 as sl target
1-678
2-774
Time frame 6 months once trade triggers

SUBROSEntry: above 440
SL: weakness below 424
Setup Invalid : If price goes below 410
● EMA's : EMA 10 > EMA 21 > EMA 50 > EMA 150 > EMA 200.
● BO with high volumes
● After BO price retesting with lower volumes

Subros gave breakout @ 380 on 01 June 2023. Subros gave breakout @ 380 on 01 June 2023.
Second chance to Buy in November around breakout point at 380.
CMP 527 Hold and add for upside of 660.

SUBROSVolatility Contraction Pattern is popularized by Mark Minervini, who is a two times US Investing Champion. Last year he won the championship with a record-beating 300+% in the year. He primarily uses VCP for his trading setups. It is a twist on the ascending triangle pattern with some variation.
It has the following characteristics:
The Stock must be in stage 2 uptrend.
A period of price consolidation must take place in thebase.
Price consolidation occurs after a stock has moved up in the price, the consolidation (or correction) is a constructive chart pattern that allows the stock to digest the bullish price movement.
Price volatility must contract through the base (from left to right).
During this period of price consolidation the stock price will correct.
Price must correct through a series of smaller contractions.
Each contraction should be tighter than the last, representing the absorption of more weak holders. Ideally this pattern has between2-4 contractions.

A retest on the weekly charts - Worth an attempt? Staying with the overall market is very important to make the best in trading.
Further, knowing when to trade breakouts vs when to wait for retests is also important and that comes with knowledge of overall market.
I am sharing a retest chart on the weekly time frame where volumes are visible on the green side.
This is a stage 2 continuation breakout and retest and has the potential to give another 80% from here.
Keep an eye!!

SUBROS - Can you afford to ignore it?Gave a strong breakout after 5+ years (>444) supported with volumes and taking a breather for now before it take another leap.
A self explanatory textbook breakout.

BREAKOUT, SUBROS LTD, 48% RETURNS!!!BUY - SUBROS LTD
CMP - Rs. 451
Target - 1: Rs. 588
Target - 2: Rs. 671
.
Timeframe - 3-6 months
.
Technicals - Bullish Triangle Breakout
.
This is just a view by an expert analyst, please invest at your own risk.
.
Follow me for more!


SUBROSSUBROS is forming a triangle pattern and is about to give a breakout. Keep it under the radar.

Expecting Breakout ✌✌✌This scrip is expected to give breakout in the coming days. So traders keep on your radar to catch the momentum. Thanks to all 🙏🙏🙏

Expecting Breakout ✌✌This scrip is expected to give breakout in the coming days. So traders keep on your radar to catch the momentu. Thanks to all 🙏🙏🙏

Subros Ltd - 17.01.2022Subros Ltd - 17.01.2022
The stock is trading @ 385.85 levels
The prices are above EMA
There is a SPINNING TOP in Daily Chart
RSI is above 60 in Weekly Chart
One can initiate a buy position @ current levels with support @ 369
Watch out for the price action
