SUNDARMHLD : Breakout stock (Swing pick)#SUNDARMHLD #flagbreakout #breakoutstock #channelbreakout #swingtrading #momentumtrading
SUNDARMHLD : Swing / Short term (1-3 months)
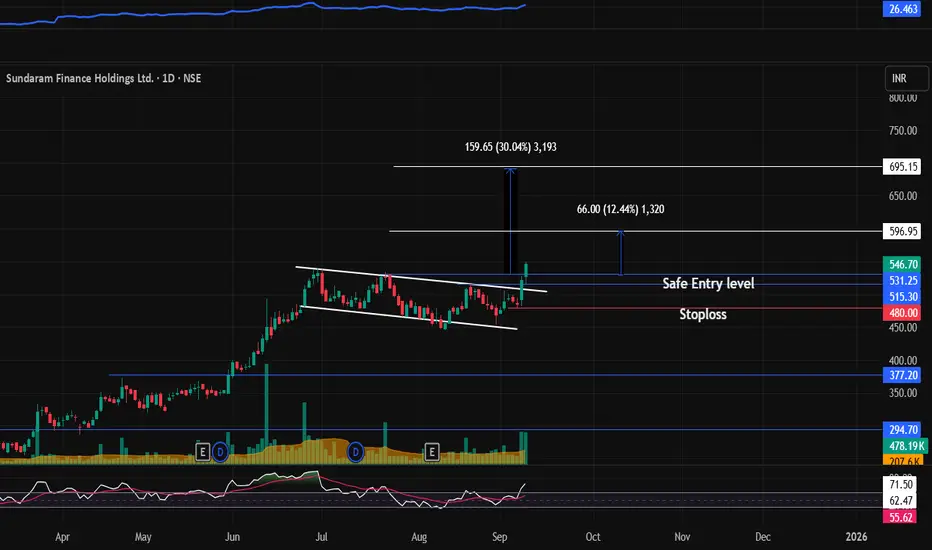
>> Flag Breakout or Channel Breakout
>> Good Strength in stock
>> Volumes picking up
>> Low PE Stock
>> Swing Traders can Look for 10-12% Levels & Short term traders can go for Higher Levels
>> Enter at Retracement
Swing Traders can lock profit at 10% and keep Trailing
Please Boost, comment and follow us for more Learnings
Disc : Charts shared are for learning purpose only, not a Trade recommendation. Do your own research and consult your financial advisor before taking any position.
SUNDARMHLD trade ideas
#SUNDARMHLD - VCP BreakOut in Daily Time Frame.📊 Script: SUNDARMHLD
Key highlights: 💡⚡
📈 VCP BreakOut in Daily Time Frame.
📈 Price consolidating near Resistance.
📈 Volume spike during Breakout
📈 MACD Cross
📈 Can go for a swing trade
BUY ONLY ABOVE 378 DCB
⏱️ C.M.P 📑💰- 376
🟢 Target 🎯🏆 – 21%
⚠️ Stoploss ☠️🚫 – 10.50%
⚠️ Important: Market conditions are Okish, Position size 50% per Trade. Protect Capital Always
⚠️ Important: Always Exit the trade before any Event.
⚠️ Important: Always maintain your Risk:Reward Ratio as 1:2, with this RR, you only need a 33% win rate to Breakeven.
✅Like and follow to never miss a new idea!✅
Disclaimer: I am not SEBI Registered Advisor. My posts are purely for training and educational purposes.
Eat🍜 Sleep😴 TradingView📈 Repeat 🔁
Happy learning with MMT. Cheers!🥂
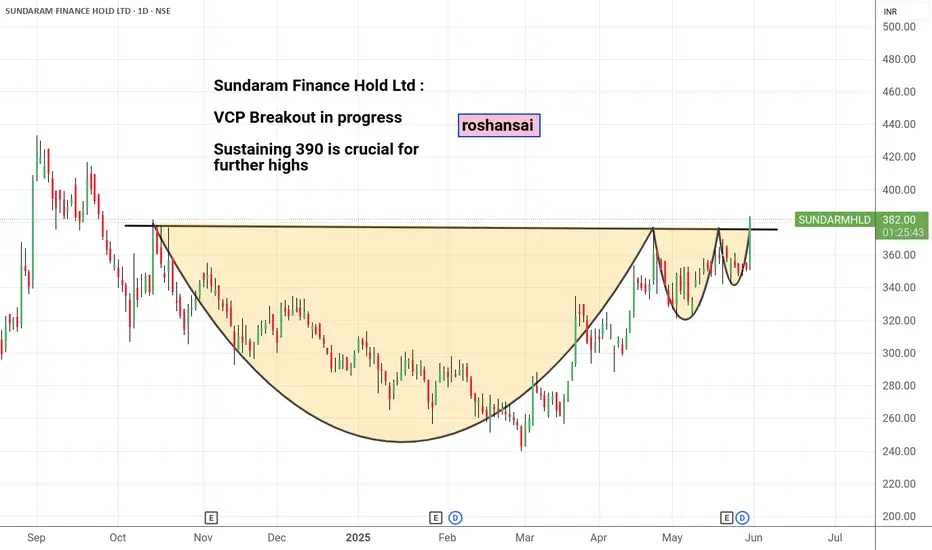
Sundaram Finance Holdings - VCP BreakoutSundaram Finance Hold. :
VCP Breakout in progress
Sustaining 390 is crucial for further highs
Sundaram Finance Ltd:- Ascending TriangleSundaram Finance Ltd:- Ascending Triangle
25 % Upside potential
Plan your trade accordingly.
Views are for ‘’EDUCATIONAL PURPOSE ONLY’’,trade at your own risk.
"Trade what you see, Not what You Think"
Happy Trading(:)

Sundaram Finance Holdings Ltd - Breakout Setup, Move is ON...#SUNDARMHLD trading above Resistance of 365
Next Resistance is at 460
Support is at 260
Here are previous charts:
Chart is self explanatory. Levels of breakout, possible up-moves (where stock may find resistances) and support (close below which, setup will be invalidated) are clearly defined.
Disclaimer: This is for demonstration and educational purpose only. This is not buying or selling recommendations. I am not SEBI registered. Please consult your financial advisor before taking any trade.

Sundaram Finance Holdings Ltd - Breakout Setup, Move is ON...#SUNDARMHLD trading above Resistance of 305
Next Resistance is at 365
Support is at 246
Here are previous charts:
Chart is self explanatory. Levels of breakout, possible up-moves (where stock may find resistances) and support (close below which, setup will be invalidated) are clearly defined.
Disclaimer: This is for demonstration and educational purpose only. This is not buying or selling recommendations. I am not SEBI registered. Please consult your financial advisor before taking any trade.

Sundaram Finance Holdings Ltd - Breakout Setup, Move is ON...#SUNDARMHLD trading above Resistance of 246
Next Resistance is at 305
Support is at 168
Here are previous charts:
Chart is self explanatory. Levels of breakout, possible up-moves (where stock may find resistances) and support (close below which, setup will be invalidated) are clearly defined.
Disclaimer: This is for demonstration and educational purpose only. This is not buying or selling recommendations. I am not SEBI registered. Please consult your financial advisor before taking any trade.

SUNDARMHLD swing call#SUNDARMHLD CMP: 266, Target 1:300
Fundamentally Strong Stock; Results are on the way
#Charts

BREAKOUT IN SUNDARAM FINANCEAscending Triangle Breakout
RSI above 65 and rising
Trading above EMA50
Volume spurt
Testing ATH
Disc: for study, not a recommendation

SUNDARAM FINANCE - RISING WEDGE SINCE AN YR Hi All,
This idea is about Sundaram Finance Holding
Fundamentals
Market Cap - 6k Cr
Mkt Cap/Sales - 20.9
ROE - 12%
P/BV - 1.27
Div Yield - 2.81%
Technicals
Price action has been in a rising wedge pattern since Jul 23 & currently consolidating at the bottom of channel for past few days. It can give a upmove of nearly 25% in very short term.
Traders can take positional trades to capture the move.
There is a small resistance for which traders need to be careful. Price reverted twice from that level
SL will be lower channel breach
Hope for a successful trade,
Thanks,
Stock-n-Shine

Sundaram Finance Holdings Ltd - Long Setup, Move is ON...#SUNDARMHLD trading above Resistance of 200
Next Resistance is at 246
Support is at 136
Here are previous charts:
Chart is self explanatory. Levels of breakout, possible up-moves (where stock may find resistances) and support (close below which, setup will be invalidated) are clearly defined.
Disclaimer: This is for demonstration and educational purpose only. This is not buying or selling recommendations. I am not SEBI registered. Please consult your financial advisor before taking any trade.

SUNDARMHLDstock : sundarmhld
trade : long (cash segment)
buy @ 198 above
sl @ 190
t1 @ 224
t2 @ 234
note :
this information is for education only

SUNDARM HLDSUNDARM HLD
up momentum stock
debt free company.
Piotroski score-7.00
ROE=7.23 %
Debt to equity=0.01
Promoter holding=55.6 %
Return on equity=7.23 %
be simple buy simple.
keep momentum investing.
pls like and follow and press boost for momentum.
thanks.

Sundaram Finance Holdings Ltd - Flag & Pole Breakout #SUNDARAMHLD
CMP : ₹.168.35/-
Date : 07-01-2023
Sundaramhld is involved in the business of financial services. Technically a strong performing company which is giving consistent returns for the last five years. ROE,ROA & ROCE improving for the last 2 years with increasing profit margin. A nil debt company with zero promoter pledge. Stock is now near it's 52 week high with a flag and Pole Pattern breakout identified. Waiting for a retest for the further move as it's in an overbought zone. Profit booking can be expected. After that a steady surge towards 200 levels can be stoploss below ₹.155 levels.
Disclaimer : Post only for educational purpose. Not a buying / selling recommendation. This is only my personal view. I am not a SEBI registered analyst . Do your own analysis and act accordingly .

Stock of the Week: SUNDARMHLD - A Bullish Opportunity Unfolding.Weekly Time Frame:
On the weekly chart, SUNDARMHLD is displaying strong bullish signals. The stock is currently undergoing a retest, which often signifies a robust support level. What's particularly noteworthy is the formation of a rounding structure, indicating a potential reversal or continuation of the current uptrend. This structure has the potential to set the stage for a sustained upward move.
Daily Time Frame:
Zooming in on the daily chart, we observe a breakout from the rounding structure mentioned earlier. This breakout not only validates the strength of the bullish trend but also provides an excellent entry point for traders. The gradual consolidation and accumulation over the past few days indicate a healthy and controlled price action, allowing for strategic entry positions.
Key Technical Indicators:
Higher Highs and Lower Lows: SUNDARMHLD is consistently establishing higher highs and lower lows, a classic sign of a healthy and sustainable uptrend. This pattern suggests a strong buying interest and potential for further price appreciation.
Risk Management:
As with any trade, it's essential to implement a robust risk management strategy. Consider setting stop-loss orders to protect your capital and adhere to sound risk-reward ratios. Additionally, stay informed about relevant news and market developments that may impact the stock's performance.
In conclusion, SUNDARMHLD is shaping up to be an exciting opportunity for traders seeking a bullish play. Keep a close eye on the stock's price action, and may the markets favor your trades! Happy trading! 📈💰
(Note: This analysis is for informational purposes only and does not constitute financial advice. Please conduct your own research and consult with a financial advisor before making any investment decisions.)

#SUNDARMHLD #NSE - FLAG BREAKOUTSundaram Finance Holdings Ltd.
Bull flag Breakout in a daily timeframe.
PAT margin has surged by 13.76%.
The company is trading at 0.47 times the book value.
Disclaimer:
For educational purpose only.
Please do your own research before taking any trades.
Happy Trading!

SUNDARMHLD - Nov 2023 Multiyear 52 Week High BO ConfirmedSUNDARMHLD - Nov 2023 Multiyear 52 Week High BO Confirmed.
This is not a buy sell reccomdation. This is for my learning and recording purpose.
For Tradingview Premium plan, Can go with the below link
in.tradingview.com

SUNDARMHLD | Swing Trade📊 Details
Sundaram Finance Holdings Ltd is primarily engaged in the business of Investments, business processing, and support services. It has a 100% subsidiary which is an outsourcing company offering various support services to large and mid-sized firms in and outside India.
Disclaimer: This analysis is solely for educational purposes and does not make me a SEBI registered analyst.
If you found this analysis helpful, I encourage you to like and share it. Your observations and comments are also welcomed below. Your support, likes, follows, and comments motivate me to consistently share valuable insights with you.
🔍 More Analysis & Trade Setups 🔍
For more technical analysis and trade setups, make sure to follow me on TradingView: www.tradingview.com

Sundaram Fin Holding Short Term TradeDetails in the image
for more info - plz visit my profile
dont miss to Like/Share this idea
Regards,
Naresh G
SEBI Reg. RA

SUNDARMHLD - Ichimoku BreakoutStock Name - Sundaram Finance Holdings Ltd
Ichimoku Cloud Setup :
1). Today's close is above the Conversion Line
2). Future Kumo is Turning Bullish
3). Chikou span is slanting upwards
All these parameters are showing bullishness at Current Market Price
and more bullishness AFTER crossing 134
#This is not Buy and Sell recommendation to any one. This is for education purpose and a helping hand to learn trading in Market.
#CloudTrading
#IchimokuCloud
#IchimokuFollowers
#Ichimokuexpert
I hope you all like my analysis.
Please do share your thoughts into comment section.
Please give a like, share & subscribe for daily analysis.

Sundaram Fin Holding Analysis Stock has given BO on daily and weekly chart with good volume pop up, follow chart for proper support and resistance levels.

SUNDARMHLD BULLISHThis stock currently trading at PE of 8 & also posted very good results and volumes are also increasing one should buy this stock on every dip for the tgt of 150

SUNDARMHLD - Ichimoku Bullish Breakout Stock Name - Sundaram Finance Holdings Ltd
Ichimoku Cloud Setup :
1). Today's close is above the Conversion Line
2). Future Kumo is Turning Bullish
3). Chikou span is slanting upwards
All these parameters are showing bullishness at Current Market Price
and more bullishness AFTER crossing 100
#This is not Buy and Sell recommendation to any one. This is for education purpose and a helping hand to learn trading in Market.
# Cloud Trading
# Ichimoku Cloud
# Ichimoku Followers
I hope you all like my analysis.
Please do share your thoughts into comment section.
Please give a like, it motivates me to do analysis.
