Sundaram Fasteners: Potential Buying OpportunitySundaram Fasteners is currently at a strong support level around ₹1,000, having declined 30% from its all-time high. This presents a potential buying opportunity for investors.
Fundamental Points for Sundaram Fasteners (2024):
Market Capitalization: Approximately ₹22,566 crore.
P/E Ratio: Around 43.26, indicating a premium valuation.
Return on Equity (ROE): Approximately 16.33%, reflecting good profitability.
Debt-to-Equity Ratio: Low at 0.18, suggesting strong financial stability.
Dividend Yield: About 0.64%, providing some income to investors.
With solid fundamentals and current pricing near key support levels, Sundaram Fasteners may be an attractive investment opportunity for cautious investors.
SUNDRMFAST trade ideas

Sundram Fasteners Ltd Chart AnalysisDetailed Chart Analysis for Sundram Fasteners Ltd. (4-Hour Timeframe):
The chart uses **Heikin Ashi candles**, which are designed to smooth price movements and highlight trends. Below is a breakdown of the key elements:
### 1. **Price Action and Heikin Ashi Candles**:
- **Trend Analysis**:
- The chart shows a clear **downtrend** followed by a consolidation phase and a potential reversal in the last few candles.
- The **Bottom 1 and Bottom 2** labels suggest a possible **double-bottom pattern**, a bullish reversal indicator.
- **Resistance and Support Levels**:
- The purple line at **₹1,399.90** represents a major **resistance level**.
- The green and red arrows highlight areas where the price struggled, indicating critical decision zones.
### 2. **Volume**:
- **Increasing Volume at Bottom 2**:
- A spike in volume at the second bottom indicates buying interest, supporting the reversal possibility.
- **Volume Divergence**:
- While the price declined, the volume remained relatively low, indicating reduced selling pressure during the fall.
### 3. **MACD Indicator**:
- **MACD Lines**:
- The MACD line (blue) is crossing above the signal line (red) around Bottom 2, which is a **bullish crossover**.
- **Histogram**:
- The histogram bars are turning green and increasing, signaling strengthening bullish momentum.
### 4. **RSI (Relative Strength Index)**:
- **Trend**:
- RSI is rising from oversold levels (below 30), confirming increasing bullish momentum.
- **Current Value**:
- The RSI is nearing the **neutral zone (50)**, suggesting that the price is still in the early stages of recovery.
### 5. **ATR Trailing Stops**:
- The **ATR (Average True Range)** trailing stops suggest the price has broken above a previous level of resistance, adding to the bullish case.
### 6. **Zones**:
- **Green Zones**: Represent potential buying or accumulation phases.
- **Red Zones**: Represent selling or distribution phases. The switch from red to green further supports the bullish reversal.
### **Conclusion**:
This chart indicates a potential bullish reversal:
1. **Double Bottom Formation** near strong support.
2. Bullish **MACD crossover** and RSI divergence.
3. Increased **volume at support** levels.
### **Next Steps for Trading**:
- **Entry Point**: Consider entering above **₹1,180** if the price sustains.
- **Stop Loss**: Place a stop loss below **₹1,120** (recent swing low).
- **Target Levels**: The first target could be **₹1,300**, with the second target near **₹1,400**.

SUNDRMFAST Trading Within Tested Demand ZoneSUNDRMFAST is currently trading at ₹1164.2, positioned within its tested demand zone between ₹1153.6 and ₹1125, established on 15th May 2024. This zone has already shown support in the past, suggesting continued buying interest around these levels. Investors may consider this range for potential accumulation, expecting a possible rebound from this proven support area.
Disclaimer: This analysis is for informational purposes only and should not be considered as financial advice. Please conduct your own research or consult a financial advisor before making any investment or trading decisions.

SUNDRAM FASTENERS LTD - SHORT TERM TRADESUNDRAM FASTENERS LTD good above 1430 on CLB.
Momentum Indicators are Bullish.
Forming Base now ready for breakout.
Weak Below 1300 on CLB.
Ready For upside 1600-1700-1800+

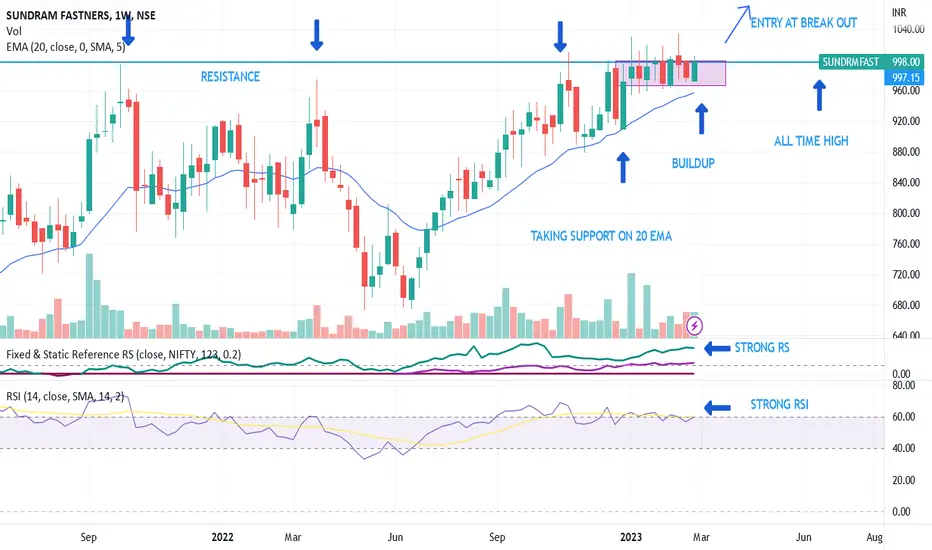
medium term trading opportunity in Sundaram FastenersHi,
NSE:SUNDRMFAST has given a Bullish Flag Breakout on Weekly charts with very good volume.
MACD is also on the bullish side on Weekly time frames. RSI is also on the bullish side on daily, weekly and monthly time frames.
In the current market scenario, I am expecting that the bullish momentum will continue.
Complete price projection like entry, stop loss and targets mentioned on the charts for educational purpose.
Don't Forget to Follow me to get all the updates.
Please share your feedback or any queries on the study.
Disclaimer: Please consult your financial advisor before making any investment decision.

SUNDRAM FASTENERSSUNDRAM FASTENERS is near the weekly support area of 1300.
BUY at 1300
STOP LOSS at 1200
TARGET 1500

SUNDRMFAST CMP 1340Strong fundamentals. Expecting it to raise 20% due to the revenue outlook. Have a read of their concal..looks promising.

Sundram Fastners - Breakout Setup, Move is ON...#SUNDRMFAST trading above Resistance of 1400.75
Next Resistance is at 1887
Support is at 1003
Here are previous charts:
Chart is self explanatory. Levels of breakout, possible up-moves (where stock may find resistances) and support (close below which, setup will be invalidated) are clearly defined.
Disclaimer: This is for demonstration and educational purpose only. This is not buying or selling recommendations. I am not SEBI registered. Please consult your financial advisor before taking any trade.

Target 4 (94%) achieved in Sundram Fastners. Target 5 is ON...This is follow-up on Sundram Fastners. Can check link to related ideas.
Target 4 achieved. More than 94%. Target 5 is ON.
Chart is self explanatory. Entry, Targets and Trailing Stop Loss are mentioned on the chart.
Disclaimer: This is for demonstration and educational purpose only. This is not buying or selling recommendations. I am not SEBI registered. Please consult your financial advisor before taking any trade.


SUNDRMFAST | Good for Long |NSE:SUNDRMFAST
CMP: 1103.15
Reason for Trade : Bullish Trend
Entry : Cmp or near Support 1040
Stop Loss: According to one's Risk Reward ratio
#Study, Learn & Earn.
If you love this post please like and comment your thoughts below. That will be a great motivation for me to post similar ideas ahead.
Disclaimer: All the information posting on this page are for the educational purpose only, we are not SEBI registered financial advisor. We wont recommend any BUY/SELL of stocks. Contact your financial advisor before taking any action

Sundram Fasteners LtdIts a part of the TVS Group of Companies and is engaged in manufacturing critical, high precision components such as fasteners, power train components etc for the automotive, infrastructure, windmill, and aviation sectors.
Fundamentals:-
Debt is less than reserves.
Dividend giving stock.
Good ROCE & ROE.
Promoters holding is Good & No promoters pledged.
Piotroski score is 6.
Technical:-
Demand Zone is marked as Green shaded horizontal area.
Resistances are marked as red horizontal lines.
Stoploss is marked as orange horizontal line.
Support is marked as green horizontal line.
Price is above 200 Weekly EMA , May dip to this level & take support (White Line).
Positional Trade:-
Buy 1000 - 950 - 900
Stoploss 850
Tgt 1200 - 1300 - 1600
This idea is for Educational purpose and paper trading only. Please consult your financial advisor before investing or making any position. Facts or Data given above may be slightly incorrect. We are not SEBI registered.

SUNDRMFAST | Swing Trade📊 DETAILS
Sector: Trading
Mkt Cap: 26,424 cr
Sundaram fasteners ltd, a part of the TVS Group of Companies, is engaged in manufacturing critical, high precision components such as fasteners, power train components etc for the automotive, infrastructure, windmill, and aviation sectors.
TTM PE : 52.55 (High PE)
Sector PE : 41.11
Beta : 0.13
📚 INSIGHTS
Strong Performer
Stock with consistent financial performance, quality management, and strong technical momentum indicating good investor enthusiasm. Currently valued at Good to expensive valuation
6.09% away from 52 week high
Underperformer - Sundram Fasteners up by 0.12% v/s NIFTY 50 up by 2.76% in last 1 month
📈 FINANCIALS
Piotroski Score of 8/9 indicates Strong Financials
Disclaimer: This analysis is for educational purposes only, and I'm not a SEBI registered analyst.
If you found this analysis helpful, I encourage you to like and share it. Your observations and comments are also welcomed below. Your support, likes, follows, and comments motivate me to consistently share valuable insights with you.
🔍 More Analysis & Trade Setups 🔍
For more technical analysis and trade setups, make sure to follow me on TradingView: www.tradingview.com

Short Term Idea SUNDRMFAST
Entry 1270-1282
Sl 1237 (D.C.B)
Tgt 1325 -1350
Disclaimer : I'm not a sebi registered advisor and this is not any recommendation to buy or sell.
Thanks and Plz Like, Comment and Follow me guys.


SUNDRAM FASTNER---RIIGHT TIME TO ENTER~All the information given in the chart is for the educational purpose only.
~Do your own research before investing.
~This is not my recommendation.
~My recommendation--LEARN MORE EARN MORE.
SUNDARAM FASTNERS - 20% RETURNS!!!Short Position - SUNDARAM FASTNERS
CMP - Rs. 982
Target - Rs. 800
.
.
Technicals - 1) Harmonic Pattern - Navarro 200
.
.
Follow me for more!

LIFE TIME HIGH STOCKStock is near life time high,expected good move from this level.
Trend is upside

SUNDRAM FASTNER-BULLISH~THE information given in the chart is for educational purpose only
~Do your own analysis before investing.
~LEARM MORE EARN MORE/

breakout soon on weekly chart ATH resistance is challenged with increasing volumes
volatility is showing contraction


Sundram Fasteners LimitedSUNDRMFAST:- Stock has also given breakout by forming rounding bottom pattern and has come for retesting as well volumes are also good keep your eye on it
Hello traders,
As always, simple and neat charts so everyone can understand and not make it too complicated.
rest details mentioned in the chart.
will be posting more such ideas like this. Until that, like share and follow :)
check my other ideas to get to know about all the successful trades based on price action.
Thanks,
Ajay.
keep learning and keep earning.

Sundaram Fastners - Ascending Triangle BreakoutSundaram Fastners :
Ascending Triangle breakout Done
At resistance level(s) currently
Long only above 985 with support at 969
