STRONG BUYERS HAND IN SUNPHARMA!!!!!!!!!!!!! READY TO ZOOM 12%Holding above 61.8% for a very long-time.
SUNPHARMA trade ideas

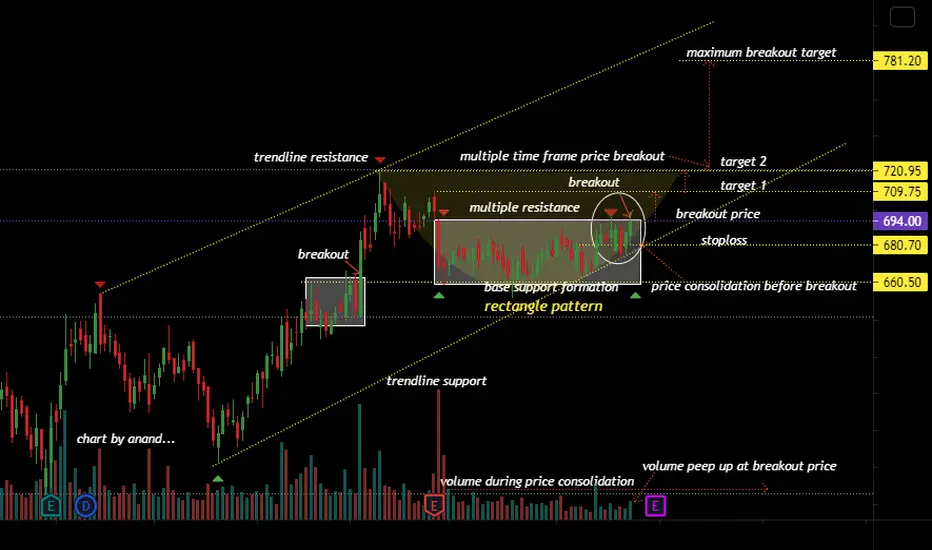
rectangle breakout trade !sunpharma : 694
trade set up :
1. buy above 694
2. keep stop loss as 680 on closing basis
3. targets 710/721/781 +
technical buy based on :
1. rectangle
2. rounding bottom
3. multiple time frame analysis
4. breakout concept


SUNPHARMA - Price and Trend SetupSUNPHARMA is gaining strength and may give breakout in coming days. PHARMA sector has shown positive recovery today.

SUNPHARMA Current Price 699.00 Bullish ViewSUNPHARMA seen breaching resistance levels here at Rs.700. Stock in a continues uptrend and is now breaking the earlier resistance suggesting the uptrend to continue for some more time. Keep watch.


sunpharma - buy Buy from cmp to 675
easy target - 700
Disclaimer : This is my personal analysis for study purpose not intended for trading

SUNPHARMASUNPHARMA: Looking Good
Rounding Bottom Pattern Breakout Sustaining Closing/Above 708.10-721.85
Buy Above/CMP 703.40

SUNPHARMA ready for breakoutBasic observation:
a. Between 2020 and now Sun Pharma has grown 131%. The last time it showed such considerable growth was between 2013 and 2014 where it grew by 166%.
b. Post having a falling trendline for 59 months (-74.15%) it has been within a rising channel for over 16 months (108%).
c. RSI and KST currently showing positive signs
d. Prices have been consolidating for for 56 days.
e. The price has currently surpassed the 46 days resistance
f. In daily time frame, 10 and 20 DMA have cut above 50 DMA and positive movement has begun. DMA's in order when used in Monthly and Weekly time frame too.
g. Currently Trading at 703.40
Entry @ 703.80
Target @709.45
Stoploss @ 701.94 (-1.86)
Risk to Reward Ratio @ 3.03

Sun Pharma ready to breakoutBasic observation:
a. Between 2020 and now Sun Pharma has grown 131%. The last time it showed such considerable growth was between 2013 and 2014 where it grew by 166%.
b. Post having a falling trendline for 59 months (-74.15%) it has been within a rising channel for over 16 months (108%).
c. RSI and KST currently showing positive signs
d. Prices have been consolidating for for 56 days.
e. The price has currently surpassed the 46 days resistance
f. In daily time frame, 10 and 20 DMA have cut above 50 DMA and positive movement has begun. DMA's in order when used in Monthly and Weekly time frame too.
g. Currently Trading at 703.40
Entry @ 703.80
Target @709.45
Stoploss @ 701.94 (-1.86)
Risk to Reward Ratio @ 3.03


Sunpharma Multi year breakoutSunpharma stock is near multi year breakout. If price get success on breakout sure we will stock on new highs.


A healthy breakout or not?? SunpharmaAfter a long uptrend and the a consolidation at higher level resulting in prices moving out side that range .

Sunpharma BO Retest & bounceNSE:SUNPHARMA
can add now and more on dip till 670
SL 630
T 725, 760 800+

SUN PHARMA | TRADE SETUP 26-07-2021NSE:SUNPHARMA
It have broken the trendline with good volume and also our level of 689 and hit our target 1 placed at 695. It closed at 694.
Trade Setup for 26-07-2021.
1) If it goes down till level of 691 let it go don't try to short it. If it gets support from 691 and trade above it then it will be easy to go long and all the targets are mentioned on the chart.
2) If it fails to hold the level of 691 then next support is at 689. If it gets support from 689 and trade above it then it will be easy to go long in trade. All the targets are mentioned on the Chart.
3) At this moment there is no short/sell trade opportunity in SUNPHARMA. It will only give opportunity for sell/short trade below 680 and then the fall will be till 670.
4) Don't chase if it open with gap up. Let it cool down for initial 15-20 minutes and judge the price action and only trade on levels.
Have a good weekend.
Comment if my ideas are helping you to understand price action and levels.
Do comment if you have any doubt.

Sun Pharma: A Safe Bet!
1. Stock has given breakout from its minor resistance of 682 – 689,
2. RSI is above 50,
3. SuperTrend has turned positive,
4. Price has closed above 8 days EMA, &
5. More importantly stock has not given close below its strong weekly support of 651 since Apr’21.
Considering these facts, one can buy at CMP
1st Target: 717 – 722
2nd Target: 756
3rd Target: 861 (For long term investment)
Last but not the least; keep Stop Loss at 643 closing prices.
Disclaimer:
This idea is presented just for educational purpose only. You will be solely responsible for your own money & decisions you take.

Sunpharma Cup & handle BOSunpharma Cup & handle BO
can add now and more on dip till 650
SL 630
T 710, 735, 760
TF - 4 weeks

SunPharma Swing Trade AnalysisBuy above 690 for target 720 and above
sl below 650 close
Trade at ur own risk.

SUNPHRAMA Hi guys its a good chart pattern .
: with the " Supply and Demand " and in the uptrend with "double top ".


SUNPHARMA - Swing CandidateThe stock has been taking support from the green trendline.
We are going to enter for the E wave .
SUNPHARMA
Buy- Above 690 (Add More @ 665)
Sl - 650
Target - 770
Duration - 1-2 Week.
