San Pharma Above 610 Closing basis Risk vs Reward is 1: 5 . Taking support at 50EMA. Following Trend
600 Bellow Closing day Candle and next day sustain bellow 600 till 12 O'clock.
Reward is open
positional player
Pharma Sector Index is weak but i would like to risk 10 Rs
SUNPHARMA trade ideas


Sunpharma - Positional View , Long Term investment ( 40 % gain )Fundamentals :
-------------------
- The whistle blower case got settled down
- Stock was on 3 years consolidation
- Now it's on the same resistance level of 654 after 2018
- Chances are very high for Break Out
Technicals :
---------------
- Rounding bottom formation in the weekly chart
- Bullish candlestick pattern ( Morning Star ).
- if it crossed the resistance level of 655. Then by the end of 2021, it may hit the target of 940
- RSI > 60
- Bollinger Band challenged
- MACD +ve cross over
- above 50 EMA
- ADX strength is Bullish


#sunpharma #nifty50 #nifty #banknifty #niftybank #niftypharmaNSE:SUNPHARMA
long only if find perfect reversal from PRZ
******whatever charts or levels sharing here are just for educational purpose only not a recommendation. please do your own analysis before taking any trade on them. we are not SEBI registered.


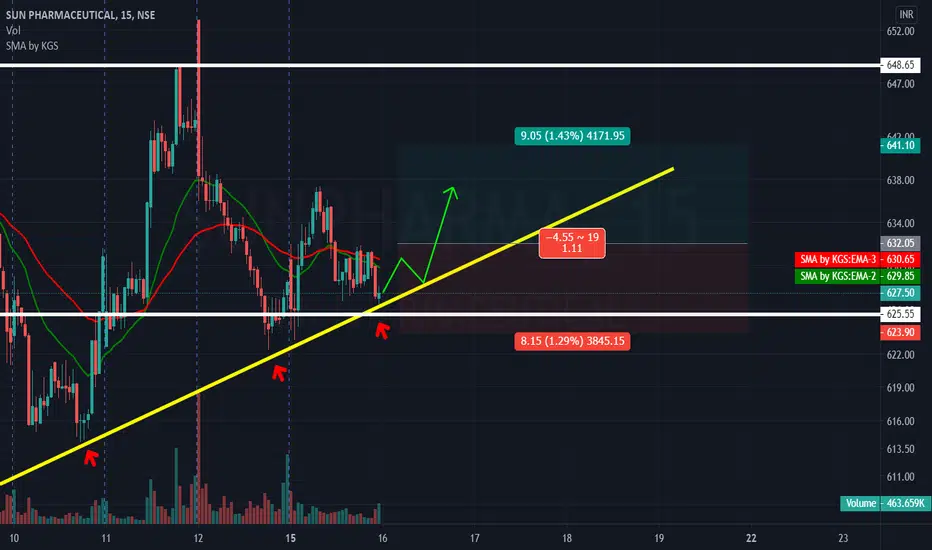
Intraday Setup for SUNPHARMALevels are shown in the chart.
If the Trade triggers, it should go in the direction indicated in chart.
sun pharma bullish trade NSE:SUNPHARMA
Too early to comment on sun pharma right now since the data is from only last 5 days and 2 sessions.
624 looks support zone and 631 is breakout zone for higher targets.
IF nifty is bullish one can go for buying ONLY at SUPPORT provided MACD. RSI, SQZ_MOM indicate a bullish trade.
Volume can never be forgotten always :)

Sunpharma Short @650-640Sunpharma Cash Levels (Weekly Chart )
Bearish Butterfly Bearish RSI Divergence
CMP 634.6 Short @650-640 For Target 620-600-580-560-540+ SL 661


Sunpharma Following Double Top Pattern Sunpharma Following Double Top Pattern :- This Level is assume to possess a resistance which cannot be broken

SunPharma Stock Good Trade Setup For 12-02-2021SunPharma Breakout Trade For 12-02-2021
S/R Breakout On 15 Min Chart
For educational Purposes Use Only
Im Not SEBI Registerd

SUNPHARMA: PALGO SIGNALHOW TO FOLLOW ALGO SIGNAL:
Deciding buy/sell
1.Strictly use only on 1 hour time frame.
2.Wait for a ‘X’ sign before mind make up. A red ‘X’ means look for selling opportunity , a green ‘X’ means look for buying opportunity.
Taking a position:
3.Wait for an arrow before entering into any position. A red arrow on upside of a bar pointing downward means open short position. A green arrow below the bar pointing upward means open buy position.
4.NOTE: Only after the the signalling of X , look for arrow. Do not buy/sell if you see any arrow before the signal of X.
5.STOP LOSS should be the most recent swing high/low or most recent STRONG CANDLE’S high/low.
While maintaining the position :
6.The small triangles after the each bar completion tells you to hold the position. The red triangles appearing upside on the bar tells you to hold the short position, whereas the green triangles appearing below the bars tells you to hold the long position.
Exiting the position:
7.After you create a buy position , if you see a green arrow above any bar pointing downward, then you should either book partially/leave the position for sometime. You will get another signal to re-enter.
8.Similarly, after you create a sell position , if you see a red arrow below any bar pointing upward, then you should either book partially/leave the position for sometime. You will get another signal to re-enter.
9.While being in position if you see any X signal which is opposite of your trade , then leave your position immediately.
10.When you see a big red circle dot then you must exit all your short positions. Contrary , when you see a big green circle dot , you must exit all your long positions. And then wait for a X-signal.
No Trading Zone:
11.When you get frequent X-signals in green-red-green-red & that too very close, then its means that stock is going to form a range. One should wait for the range break & move away to another stock. (THIS IS WHERE YOU WILL REQUIRE A PRACTICE TO IDENTIFY THE RANGE)

long sun pharmaSun Pharma
positive reversal
about to breal dd+ channel
daily rsi took support at 60
monthly rsi took support at 60
target 700 after it crosses 650

SUNPHARMA, Rising Wedge Rejection, 600 within this weekSunPharma after consolidating in the range 630-640 broke its last 3 day lows, which shows clear rejection from 650 odd levels, the price is now returning towards the lower trendline which maybe around 560.


Buy Sun PharmaIn an uptend it gives a breakout of Provious High. And consolidate little over there. It might give good move toward up side.
Buy price, SL and target are mentioned 👍🏻

