SW SOLAR (1H)🔥 Bounce Play from Strong Support | STERLINGANDWILSON (1H)
Clean reaction from demand zone around ₹195–198 after heavy selling pressure. Buyers stepping in with momentum confirmation on RSI.
If price holds above ₹200, we may see continuation towards ₹215+.
📌 Key Levels:
Support: 195–198
Resistanc
Sterling And Wilson Renewable Energy Limited
No trades
Next report date
—
Report period
—
EPS estimate
—
Revenue estimate
—
−16.64 INR
814.50 M INR
63.02 B INR
126.71 M
About Sterling And Wilson Renewable Energy Limited
Sector
Industry
CEO
Chandra Kishore Thakur
Website
Headquarters
Mumbai
Founded
2011
IPO date
Aug 20, 2019
Identifiers
2
ISIN INE00M201021
Sterling & Wilson Renewable Energy Ltd. provides solar engineering, procurement and construction (EPC) solutions. The firm provides EPC services primarily for utility-scale solar power projects with a focus on project design and engineering and manage all aspects of project execution from conceptualizing to commissioning. It also provides operations and maintenance services, including for projects constructed by third-parties. The company was founded in 2011 and is headquartered in Mumbai, India.
Related stocks

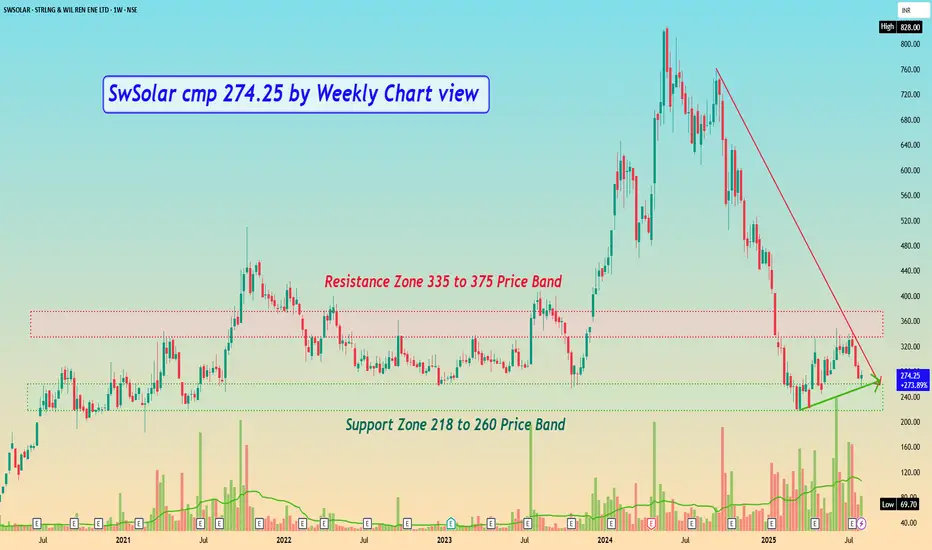
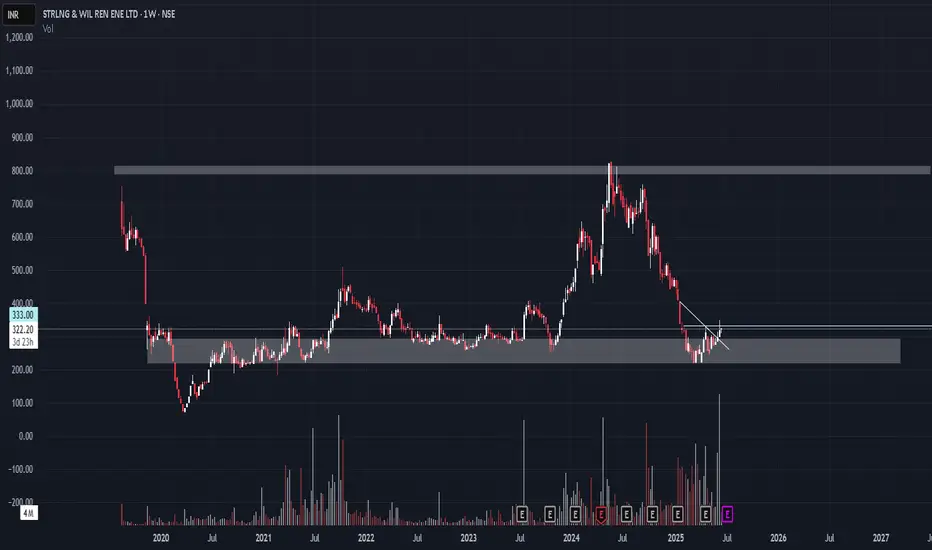
SwSolar cmp 274.25 by Weekly Chart viewSwSolar cmp 274.25 by Weekly Chart view
- Support Zone 218 to 260 Price Band
- Resistance Zone 335 to 375 Price Band
- Stock Price currently around Old Times Strong Support Zone
- Price reversal probability by past chart data seen basis Support Zone is sustained
- Price will need good incremental
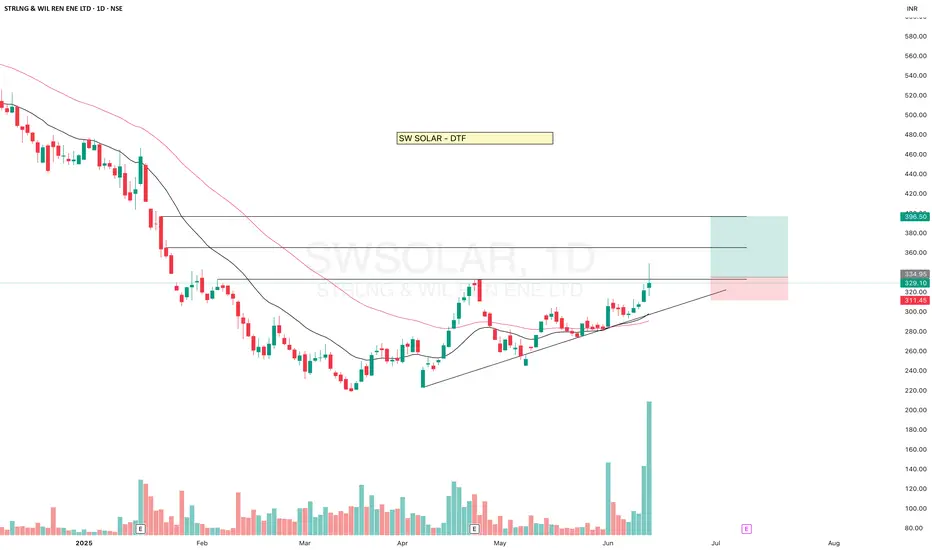
SW SOLARSW SOLAR gave BO but came down, heavy volume, if sustain this level then it may give a good upside move.
Moving above 20-50ema.
✅ If you like my analysis, please follow me as a token of appreciation :)
in.tradingview.com/u/SatpalS/
📌 For learning and educational purposes only, not a recomme
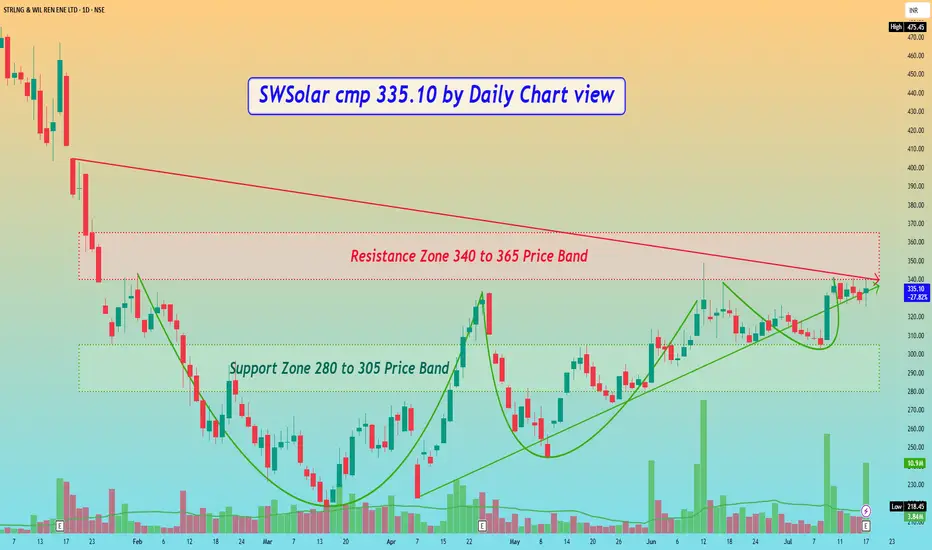
SWSolar Sterling & Wilson cmp 335.10 by Daily Chart viewSWSolar cmp 335.10 by Daily Chart view
- Support Zone 280 to 305 Price Band
- Resistance Zone 340 to 365 Price Band
- Bullish VCP Pattern completed on stock chart
- Volumes spiking heavily at regular intervals by demand based buying
- Resistance Zone Neckline Breakout maybe seen unfolding in the ne
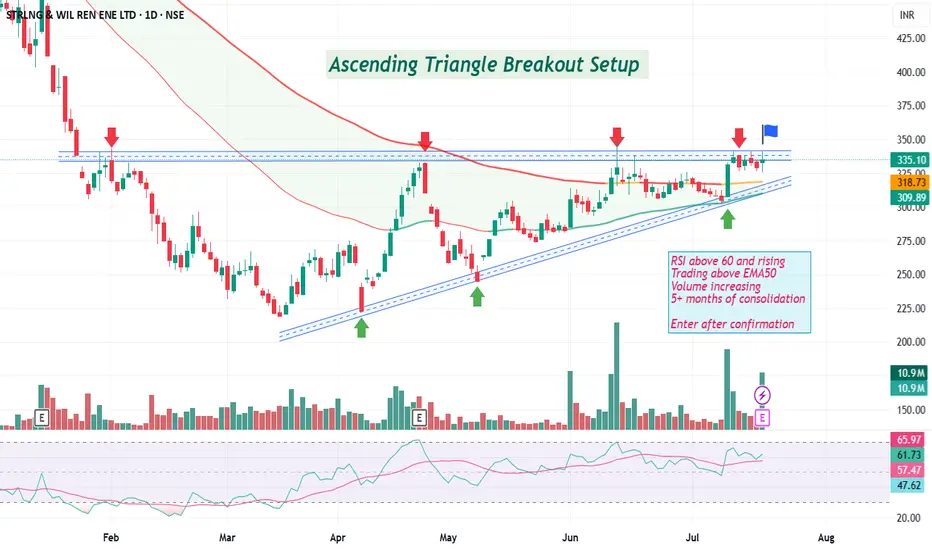
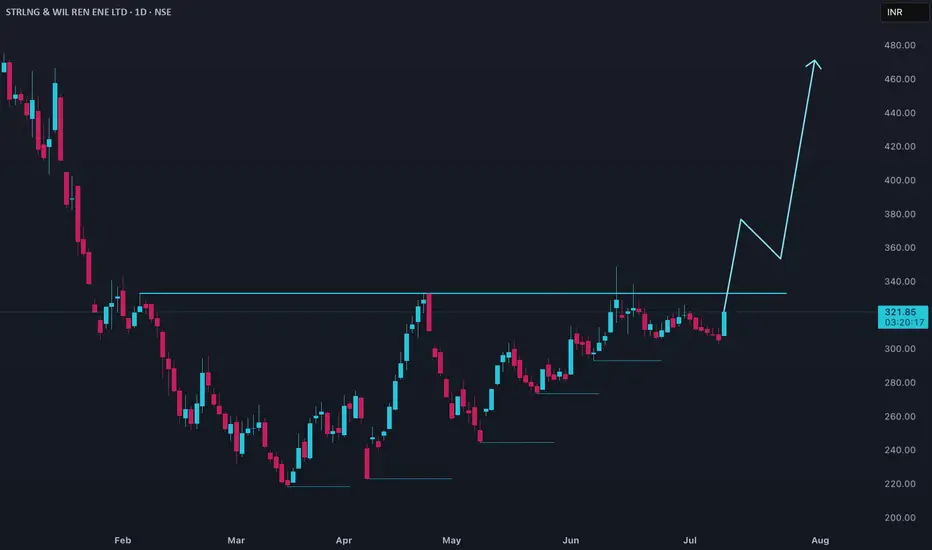
Breakout Soon in SWSOLARAscending Triangle Breakout Setup
RSI above 60 and rising
Trading above EMA50
Volume increasing
5+ months of consolidation
Enter after confirmation
Disc: not a recommendation, DYOR
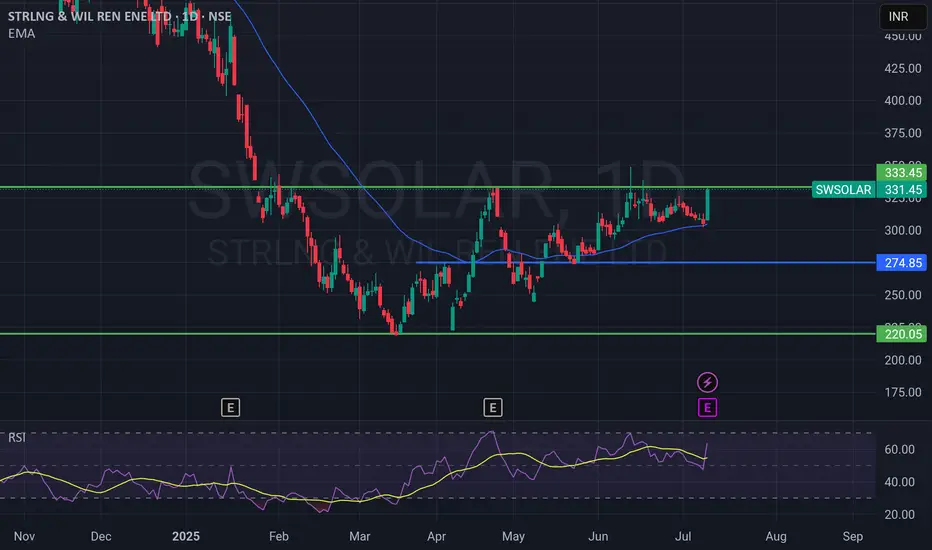
SWSOLAR Breaks Out of Key ResistanceSWSOLAR has given a strong breakout above ₹330 resistance zone with volume support and 8.5% upmove!
Here’s what’s notable:
📈 Breakout above ₹333.45 – a major resistance level.
📊 EMA Support – Price trading above the 50 EMA (~₹304).
💪 RSI at 63.77 – Showing strong bullish momentum but not overboug
BUY TODAY SELL TOMORROW for 5%DON’T HAVE TIME TO MANAGE YOUR TRADES?
- Take BTST trades at 3:25 pm every day
- Try to exit by taking 4-7% profit of each trade
- SL can also be maintained as closing below the low of the breakout candle
Now, why do I prefer BTST over swing trades? The primary reason is that I have observed that

SWSOLAR Price action### SWSOLAR Price Analysis
#### Current Price and Performance
- Sterling and Wilson Renewable Energy (SWSOLAR) is trading near ₹305 as of early July 2025.
- The stock has seen significant volatility over the past year, with a 52-week high near ₹400 and a low around ₹230.
- Over the last month, the
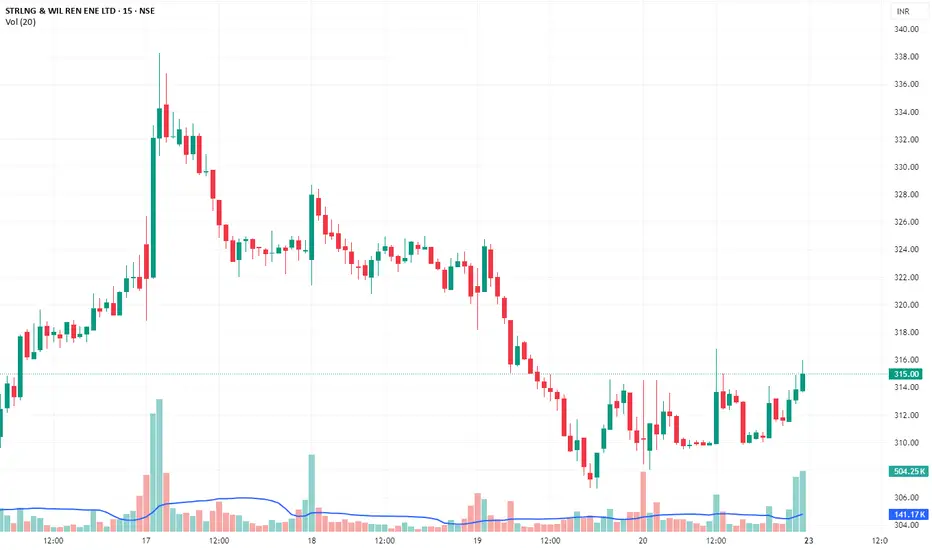
SWSOLAR – Tight Range Breakout with Volume SWSOLAR – Tight Range Breakout with Volume | BTST & 3–Day Swing Trade
CMP: ₹314.55
Trade Type: BTST / Short-Term Positional (2–4 Days)
Confidence Level: ⭐⭐⭐⭐½ (90%)
🧠 Technical Setup & Reasoning:
✅ Tight Consolidation Breakout: Price has broken out of a narrow sideways range between ₹307–311, clo
swsolar at the verge of breakout!!!???most people will see this post after the big movement is already done!
give me a follow if u r seeing this post after the movement!
Increasing EPS
Company is expected to give good quarter
Debtor days have improved from 105 to 72.6 days.
Company's working capital requirements have reduced from 145 d
See all ideas
Summarizing what the indicators are suggesting.
Neutral
SellBuy
Strong sellStrong buy
Strong sellSellNeutralBuyStrong buy
Neutral
SellBuy
Strong sellStrong buy
Strong sellSellNeutralBuyStrong buy
Neutral
SellBuy
Strong sellStrong buy
Strong sellSellNeutralBuyStrong buy
An aggregate view of professional's ratings.
Neutral
SellBuy
Strong sellStrong buy
Strong sellSellNeutralBuyStrong buy
Neutral
SellBuy
Strong sellStrong buy
Strong sellSellNeutralBuyStrong buy
Neutral
SellBuy
Strong sellStrong buy
Strong sellSellNeutralBuyStrong buy
Displays a symbol's price movements over previous years to identify recurring trends.
Frequently Asked Questions
The current price of SWSOLAR is 202.39 INR — it has decreased by −3.53% in the past 24 hours. Watch Sterling And Wilson Renewable Energy Limited stock price performance more closely on the chart.
Depending on the exchange, the stock ticker may vary. For instance, on NSE exchange Sterling And Wilson Renewable Energy Limited stocks are traded under the ticker SWSOLAR.
SWSOLAR stock has risen by 4.76% compared to the previous week, the month change is a 1.61% rise, over the last year Sterling And Wilson Renewable Energy Limited has showed a −34.72% decrease.
We've gathered analysts' opinions on Sterling And Wilson Renewable Energy Limited future price: according to them, SWSOLAR price has a max estimate of 340.00 INR and a min estimate of 275.00 INR. Watch SWSOLAR chart and read a more detailed Sterling And Wilson Renewable Energy Limited stock forecast: see what analysts think of Sterling And Wilson Renewable Energy Limited and suggest that you do with its stocks.
SWSOLAR reached its all-time high on May 21, 2024 with the price of 828.00 INR, and its all-time low was 69.70 INR and was reached on Mar 31, 2020. View more price dynamics on SWSOLAR chart.
See other stocks reaching their highest and lowest prices.
See other stocks reaching their highest and lowest prices.
SWSOLAR stock is 5.01% volatile and has beta coefficient of 2.55. Track Sterling And Wilson Renewable Energy Limited stock price on the chart and check out the list of the most volatile stocks — is Sterling And Wilson Renewable Energy Limited there?
Today Sterling And Wilson Renewable Energy Limited has the market capitalization of 49.00 B, it has decreased by −0.63% over the last week.
Yes, you can track Sterling And Wilson Renewable Energy Limited financials in yearly and quarterly reports right on TradingView.
Sterling And Wilson Renewable Energy Limited is going to release the next earnings report on Jun 30, 2026. Keep track of upcoming events with our Earnings Calendar.
SWSOLAR net income for the last quarter is −27.70 M INR, while the quarter before that showed −4.73 B INR of net income which accounts for 99.41% change. Track more Sterling And Wilson Renewable Energy Limited financial stats to get the full picture.
As of Feb 11, 2026, the company has 2.5 K employees. See our rating of the largest employees — is Sterling And Wilson Renewable Energy Limited on this list?
EBITDA measures a company's operating performance, its growth signifies an improvement in the efficiency of a company. Sterling And Wilson Renewable Energy Limited EBITDA is 2.90 B INR, and current EBITDA margin is 4.29%. See more stats in Sterling And Wilson Renewable Energy Limited financial statements.
Like other stocks, SWSOLAR shares are traded on stock exchanges, e.g. Nasdaq, Nyse, Euronext, and the easiest way to buy them is through an online stock broker. To do this, you need to open an account and follow a broker's procedures, then start trading. You can trade Sterling And Wilson Renewable Energy Limited stock right from TradingView charts — choose your broker and connect to your account.
Investing in stocks requires a comprehensive research: you should carefully study all the available data, e.g. company's financials, related news, and its technical analysis. So Sterling And Wilson Renewable Energy Limited technincal analysis shows the neutral today, and its 1 week rating is sell. Since market conditions are prone to changes, it's worth looking a bit further into the future — according to the 1 month rating Sterling And Wilson Renewable Energy Limited stock shows the sell signal. See more of Sterling And Wilson Renewable Energy Limited technicals for a more comprehensive analysis.
If you're still not sure, try looking for inspiration in our curated watchlists.
If you're still not sure, try looking for inspiration in our curated watchlists.