Momentum TradeSymphony CMP 1275
Add dips 1250
SL CLB 1230
Tgt upto 1400 & More
Don't miss to like/Boost 🚀 this idea
For more such ideas - Follow me & Do visit my profile
Rgds,
Naresh G
Sebi Reg.RA
SYMPHONY trade ideas

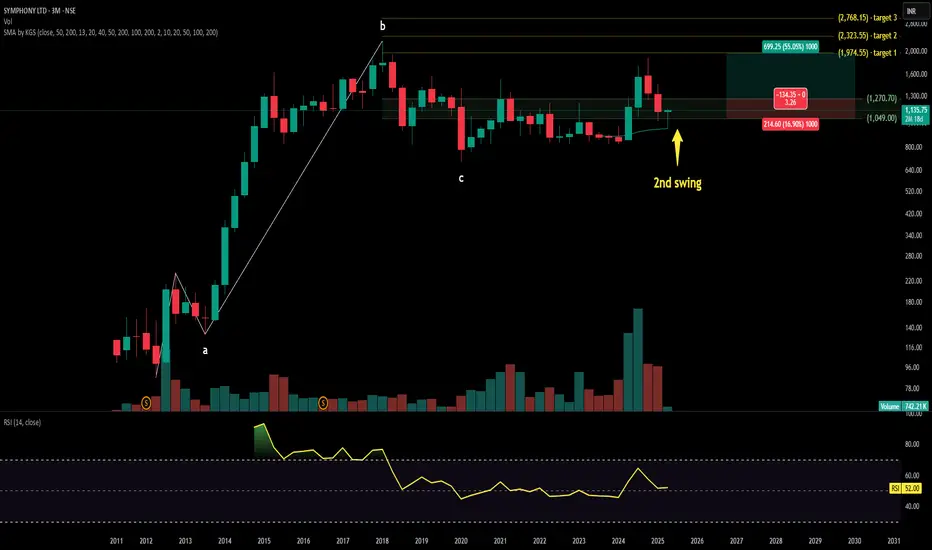
SYMPHONY technical analysis Stock Overview: Symphony Ltd., listed on the NSE, is currently trading at INR 1,135.75. The company specializes in manufacturing air coolers and industrial cooling solutions, recognized for its energy-efficient and innovative products.
Key Levels: The stock has a key support level at INR 576.15. The upside swing zone lies between INR 925.15 and INR 1,270.70. Possible upside levels are INR 1,974.55, INR 2,323.55, and INR 2,768.15.
Technical Indicators: The Relative Strength Index (RSI) is at 50.24, indicating neutral momentum as it is neither in the overbought nor oversold range. The trading volume is moderate at 742.21K, reflecting steady market participation.
Sector and Market Context: Symphony Ltd. operates within the consumer goods sector, particularly in the cooling solutions market. The sector has experienced consistent demand due to rising temperatures and a growing preference for energy-efficient products. Despite macroeconomic challenges like inflation and fluctuating interest rates, the consumer goods sector has shown resilience, supported by innovation and sustainability initiatives. Symphony’s performance aligns with these sectoral trends, maintaining stability amidst broader market volatility.
Risk Considerations: Key risks include potential fluctuations in raw material costs, which could impact production expenses. Additionally, heightened competition within the cooling solutions market and shifts in consumer preferences may influence market share. Broader macroeconomic factors, such as inflation, interest rate changes, and geopolitical events, could also affect stock performance. Regulatory changes and environmental policies may pose operational and financial challenges.
Analysis Summary: Symphony Ltd. demonstrates a stable performance with clearly defined support and upside levels. The RSI indicates neutral momentum, while trading volume reflects moderate activity. The flat MA lines suggest a consolidation phase. The stock’s alignment with sector trends highlights its resilience, though investors should remain cautious of risks such as raw material price volatility and competitive pressures. Overall, Symphony Ltd. presents a balanced outlook, with no direct buy or sell recommendations provided.
SYMPHONY LTD ANALYSISFOR LEARNING PURPOSE
SYMPHONY LTD - The current price of SYMPHONY LTD is 1349.95 rupees
I am going to buy this stock because of the reasons as follows-
1. Its coming out from a good consolidation base
2. It broke a strong resistance zone with great volume and now retesting that level
3. It is showing better relative strength as it stood strong in volatile times
4. The risk and reward is favourable
5. The recent results has been great and it will act as some catalyst
6. The stock has not done much in last few years but it looks like that it can perform better in coming months
I will buy it with minimum target of 35-40% and then will trail after that.
My SL is at 1177 rupees
I will be managing my risk.

SYMPHONY Breaking Out from Consolidation Zone, Keep In Radar
✅ The stock has successfully broken out of a consolidation zone near 1800, indicating a potential for further upside. The breakout is supported by increasing volume, and the price is trading above the 100 EMA, suggesting strong bullish momentum.
✅ The RSI is at 70, indicating the stock is approaching overbought levels but still has some room for further gains. If the breakout sustains, the next target could be around 1950-2000.
✅ A successful retest of the breakout zone near 1800 could offer an entry point for traders looking to capitalize on the upward move. Keep an eye on the price action for confirmation of strength.

Symphony Short Term TradeThe stock is in an overall uptrend
After the breakout in august, price exhibited consolidation in a rectangular pattern
Now there has been breakout through this pattern, with a rise in volume and atr on the breakout candle
Thus, there is a short term trade
tgt 1868, sl 1723

Potential Multi-Year Breakout: Monthly Timeframe: Month Oct-24 Potential Multi-Year Breakout: Monthly Timeframe: Month Oct-24
Price, Volume, RSI, Timeframe of breakout & Timeframe of analysis
Stock is about to break its all time high (1819.20) it made in Jan'18. Ignoring the wick of the Jan'18 candle since the wick is much larger than the body
Volume in the month of Oct'24 is currently (10-Oct'24) NOT above the 9 SMA
RSI in the month of Oct'24 (79.38) is above 60 as of 10-Oct'24
A multi-year (6+ years) breakout on a monthly time frame
Numbers
Breakout analysis High (Jan-18) = 1819.20/-
Drawdown (marked on chart) = 1040.50/-
SuperTrend (Oct'24) = 1112.83 is positive
ATR (Sep'24) = 174.53
Low made in the last analysis time frame (Sep'24) = 1436.85
Entry = TBD (~ 1959 see below)
Target = Breakout level + Drawdown during consolidation phase = 1819.20 + 1040.50 ~ 2850
Stop Loss = 1 ATR below analysis candle's (TBD) low = 1436.85 - 174.53 ~ 1260
Risk:Reward = 1:1.27
Exit criteria = Reaches Target || Supertrend turns negative || Price goes below 18 EMA
Will enter on a green monthly candle, if it closes comfortably above the breakout level (1819.20/-).
Will also enter if price goes in the range of 1959.
1959 was computed using ATR to identify a price level, which if reached, gives the stock a good chance that it shall also close above the breakout level by the end of the month. Since 3 weeks of a total of 5 weeks remain in the month of Oct, on the day of the analysis (10-Oct), I take 4/5th of the ATR at the previous candle (Sep'24) and add it to the level above which I would like the monthly candle to close.
ATR (Sep'24) = 174.53
4/5th of ATR (Sep'24) = 139.62
Level above which I would like the stock to close = Breakout level = 1819.20
4/5th of previous month's ATR + Breakout level ~ 1959
Additional Notes
The trade can be made more attractive if we consider the close of the Aug'24 cande, rather the consider the low of the Sep'24 candle for computing the stoploss
Using the Aug'24 candle close the stoploss becomes = 1562 - 174.53 ~ 1380

SYMPHONYSYMPHONY has given resistance breakout with decent volume. Showing trend continuation pattern.

Symphony 1616Symphony Ltd
₹ 1,617
1.00%
27 Sep - close price
EXPORT TO EXCEL
FOLLOW
symphonylimited.com
BSE: 517385
NSE: SYMPHONY
ABOUT
Symphony was established in 1988, in Ahmedabad, India. The company is engaged in the manufacturing and trading of residential, commercial, and industrial air coolers in the domestic and international markets. It is the largest air cooler manufacturer in the world.
97% of the revenue comes from the sale of Air coolers.
KEY POINTS
Product Portfolio
Symphony Limited is the world leader in evaporative air coolers. It addresses every cooling need with a product range comprising household, commercial and industrial air coolers. As of FY23, company has 97+ designs, 20+ copyrights, 55+ patents 417+ trademarks in its name. It has sold 25+ mn air coolers worldwide.
READ MORE
Market Cap
₹ 11,150 Cr.
Current Price
₹ 1,617
High / Low
₹ 1,749 / 820
Stock P/E
52.6
Book Value
₹ 109
Dividend Yield
0.80 %
ROCE
18.8 %
ROE
18.0 %
Face Value
₹ 2.00


Symphony LTD Breakout done!Polarity of price is happening here, taking support at its previous resistance zone! Price hovering above its keys moving averages. Stage 2 stock. Fundamentally a good stock as well. Can be traded for short to medium term here.

SYMPHONYPlease consult your financial advisor before investing.This is only for learning purpose of chart.
We are NISM certified EQ and MCX trader but not SEBI register investment advisor.

SYMPHONY Please consult your financial advisor before investing.This is only for learning purpose of chart.
We are NISM certified EQ and MCX trader but not SEBI register investment advisor.
You can connect me on INSTA for further query at _prem_.23
target are 2530-2550 hold for 6 months

SYMPHONY - Keep your eye on this for good swing tradeLooks like SYMPHONY is ready for the next move. In the weekly timeframe, it is ready to give a breakout. If you expect some 50% to 60% move, I would say this one will be a good choice.
Note: Sharing only for educational purposes. Do your analysis before trading

SYMPHONY TRIANGLE PATTERN INTRADAY TRADE The stock has formed TRIANGLE PATTERN pattern on the
15 MINUTES TIME FRAME chart.
One can enter above 1740 with a strict Stoploss of 1696
Target 1 - 1770
Target 2 - 1800
Target 3 - 1820
#INTRADAY TRADE
What is your view please comment it down and also boost the idea this help to motivate us. All views shared on this channel are my personal opinion and is shared for educational purpose and should not be considered advise of any nature.

Symphony has given the breakoutSymphony has given the breakout.
Chart is self explanatory. Please follow the price action & take the trade as per your appetite.
The information provided here is only for educational purpose. The information provided here is not intended to be any kind of financial advice, investment advice, and trading advice. Investment in stock market is very risky and trading stocks, options and other securities involve risk. The risk of loss in stock market can be substantial. Moreover, I am not a SEBI registered analyst, so before taking any decision or before investing in any Share consult your financial advisor and also do your analysis and research.
Request your support and engagement by liking and commenting & follow to provide encouragement.

SYMPHONY Triangle PatternThere is a triangle break out seen in Symphony in monthly time frame. Sustain above trendline leads to up

Dont Miss the opportunity to buy these two stocksStocks are showing good technical at current price and we may see good upside from here

SymphonySymphony has broken out multi year range and ready to rocket upside but once it may retest the trendline as a pullback.
Educational purposes only.

Symphony LTD Analyasis on 16 Jun 24Symphony LTD Analyasis on 16 Jun 24
Double bottom formation
stock PE (58) less than Industrial PE (89)
Stock is above all moving average
Monthly RSI is above 65-
try to buy on dip til 1200 to 1225
Keep strict stoploss 1100
target 1300 1350 - 1400 - 1500
Double bottom target 1580

SYMPHONY chart analysisSYMPHONY looks good by breaking out monthly trendline resistance.
It has long way to go as per techincal chart view.
STOPLOSS will be channel lower line.
Lets plan for long term investing.

Symphony-A support reversal with volumesSymphony is a good positional trade as it has given monthly reversal breakout
However, stock has not shown growth in previous few quarters which can lead to slow rally.
Q1 is always fruitful for AC-Fridge manufacturers. Lets wait and watch how this stock goes.

Symphony CMP 932, Target 1200Consumer Durable Stocks expected to do well, triple bottom structure in place. Making higher lows and higher highs in daily time frame. Good volumes also seen.
