a cup n handle. Correct me if wrongI can see a cup and handle pattern in TATA CHEM correct me If I am wrong. I think in short term we can get the target of 820
Trade ideas
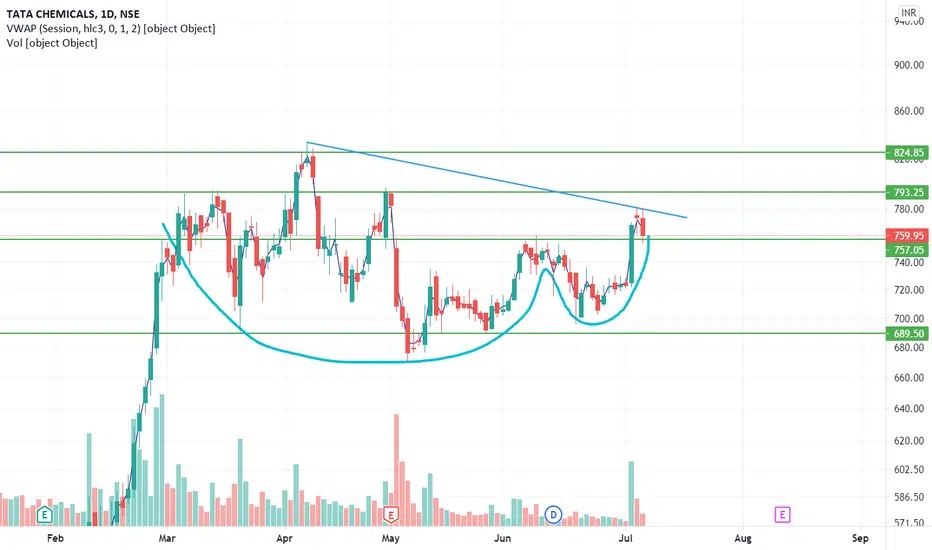
TATACHEM IS ON RETRACEMENTGood opportunity In Tatachem is on Retracement mode After Breaking Triangle pattern Buy @760 Sl 746 Target 793 , 824


#FLAG AND POLE PATTERN #TATACHEM #1DHEY FELLAS, Have a look at tatachem . It has formed a flag and pole pattern and it has given a breakout with a good volume in daily timeframe . So, according to my analysis go long till it reaches 950.

#FLAG AND POLE PATTERN #TATACHEM #1DHEY FELLAS, Have a look at tatachem. It has formed a flag and pole pattern and it has given a breakout with a good volume in daily timeframe. So, according to my analysis go long till it reaches 950.

tata chemicals longtata chemicals forms symetrical triangle with huge volumes
buy at 760 to 765 or wait for a pullback
stop loss at 720
target at 820 (8%)

Tatachem looking good !A trendline bo done near 755-758 zone.
Closed above previous high.
Buy on dips. lvl 760.
TGT 791/816
Sl 752 clbs
Disclaimer: Ideas for learning Only.
Learn Regularly. Not occasionally.

Tata Chemicals - Coming out of consolidation soon!Key Highlights:
1. Bullish market structure
2. Trendline breakout
3. Price moving in a channel
4. Major resistance: 735
5. Support zone: 675-695
6. Target: 757, 797, 833
7. Stop loss: 690
You are always advised to use an appropriate Risk-Reward ratio as per your strategy.
P.S: This is NOT investment advice. This chart is meant for learning purposes only. Invest your capital at your own risk.

ASCENDING_PENANT_CHART BREAKOUT TATA CHEMICALS has given a breakout in ASCENDING_PENANT_CHART PATTERN but the risk-reward ratio is not favorable at all there is more risk rather than profit RR is 1.12:1 If someone wants to ride its bullish momentum he/she must have high-risk apatite as high reward means high reward targets would be 795 and 838 and Stopp-Loss would be 760 735 702 trade on your on analysis I'm here just to learn and share what I know Thanku.
If you don't have a Demat Account you may go to my Profile and open one using the links that would help me a lot thank you

triangle breakoutprobably it will hit the upper range of the triangle. sl is shown in the chart. Simple analysis.

Tata Chemicals Trendline Breakout with Good Volume (Bullish)Buying Opportunities
---------------------------
1. If Price Come for Retest We can buy @732 Levels
2. If Price Break 770 level and sustain We can go Long upto 790 levels
3. If Price Break 790 levels with good Volume and if price Sustain above 790 levels then We can Go long upto 830 levels.
4. chances of Raise upto 1060 levels.
>> Always Enter With good confirmation & Maintain proper Risk Reward.
******* Knowledge Purpose only ******** This is my view about Stock/Indices Based on Technical analysis & Price Action .The market cannot be accurately predicted or completely controlled, no investment is risk-free.
>> Visit My Ideas Page for Daily Stock Analysis and check my previous stock analysis performance. I usually prefer Swing & Intraday Trades with Good Breakout confirmations and Best Risk Reward Stocks.

TATA Chemicals Triangle BreakoutLevels are Mentioned in the chart... Good for Swing...
Note:
1. Views are personal. Recheck and take the trade as per your RR.
2. Always remember SL is your lifeline not the big target...
3.Follow us for more patterns and like, share so that we feel it is helpful to many and share more patterns...
3. Views given here is not a tip rather it is for educational purpose... After market opens, the condition might change so learn to handle for different conditions..
4. To learn more about patterns, Psychology behind the trade and price action trading... contact us.. Thanks..


Wait for retest of breakoutThe price has given a breakout from a downtrend and also from a resistance zone. Now this is a huge breakout in a day. Ideally price should lose momentum reaching to resistance zone and then give a breakout. So here we will let the price test this zone (pullback) and then buy once the uptrend is confirmed.


Tata Chemicals Ltd Long @ Rs. 680 or BelowNSE:TATACHEM
Entry 680 or Below
Target 770
SL 645
Stock is trading at 680, Recently has shown support at 677 Zone. Overall trend is UP and stock can also make new high. Buy and hold to 12-15 trading sessions.
Disclaimer: author may enter in trade, take your own decision , This is an trading idea not an trading or Investment advice.

Tatachem - BreakoutTatachem Breakout above resistance and Trendline with supporting volume. Looks good for Swing trading.

TATACHEMStock has given beautiful breakout from triangle pattern. Buy above 770, TGT 8 to 10%, SL 720. For educational purpose only. Kindly contact your financial advisor before entering any trade.


TATACHEMTATACHEM Looks good. You can enter now and/or wait for the pullback or retest.
if you enter now and retest/pullback happen, add more quantity.
