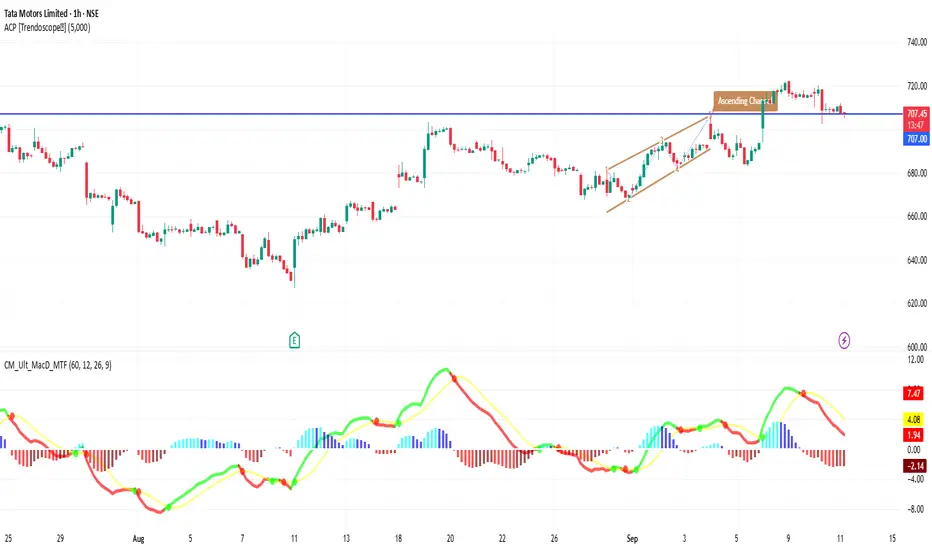
TATA MOTOR LOOKS BULLISHTata Motors is trading near 719, holding strong above the crucial support zone of 705. The price has formed a clear higher-lows trendline, indicating sustained buying interest. Currently, it is testing the resistance around 720, and a breakout above this level could open the way towards 730–740 in the short term.
🔑 Key Levels:
✅ Support: 705
✅ Resistance: 720 / 740
✅ Trend: Bullish bias with ascending structure
📈 Volume activity shows steady participation, and technical structure suggests buyers are in control. If price sustains above 720 with strong volume, upside momentum can accelerate.
⚠️ This analysis is for educational purpose only, not a buy recommendation.
TATAMOTORS trade ideas

Sectoral Rotation & India’s Growth StoriesIntroduction
India is one of the fastest-growing economies in the world, standing at the intersection of tradition and innovation. From being an agrarian economy to becoming a services-driven powerhouse and now steadily rising as a manufacturing hub, India’s growth story has been shaped by shifting macroeconomic cycles, government reforms, global trade patterns, and evolving consumer demand.
One of the most powerful ways to understand and capture this growth is through sectoral rotation – the process by which capital moves from one industry to another, depending on the stage of the economic cycle. For investors, traders, policymakers, and business leaders, analyzing sectoral rotation is not just an exercise in market timing—it is a way to understand how India’s story unfolds across different industries.
In this essay, we will dive deep into:
The concept of sectoral rotation.
How sectoral rotation plays out in the Indian economy.
India’s key growth stories and emerging sectors.
Case studies of sectoral transitions in the past two decades.
How investors and businesses can benefit from sectoral rotation.
Understanding Sectoral Rotation
Sectoral rotation refers to the systematic movement of investments across different sectors of the economy, depending on which industries are expected to outperform at a given point in the business or economic cycle.
In early expansion phases, cyclical sectors like banking, automobiles, infrastructure, and capital goods tend to outperform as demand revives and investments pick up.
In the mid-cycle, consumer durables, IT, and manufacturing-driven sectors show strength as income rises and companies expand.
In the late cycle or slowdown phases, defensive sectors like FMCG, healthcare, and utilities gain momentum since they provide stable returns even in uncertain times.
Globally, sectoral rotation is a well-documented strategy, but in India, it carries a unique flavor due to:
Strong government policy interventions.
Rapid demographic shifts.
Dependence on monsoons and agriculture in rural demand.
The interplay of global commodity cycles with domestic growth.
India’s Sectoral Journey Over Time
1. The 1990s – Liberalization & IT Boom
India opened its economy in 1991.
The IT sector became the flagbearer of India’s growth, driven by outsourcing, Y2K needs, and global cost arbitrage.
Banking reforms, private sector entry, and telecom deregulation created the foundation for future sectoral shifts.
2. The 2000s – Infrastructure & Real Estate Wave
A decade of strong growth (8–9% GDP).
Infrastructure, real estate, and capital goods were the stars, benefiting from urbanization and foreign capital inflows.
Power and steel sectors also thrived on global commodity booms.
3. The 2010s – Consumer & Financials Lead
After the global financial crisis, India saw stable growth.
FMCG, pharmaceuticals, IT services, and private banks became market leaders.
Real estate and infra cooled due to high debt and policy bottlenecks.
Digital adoption fueled e-commerce and fintech’s rise.
4. The 2020s – Manufacturing, Green Energy & Digital India
Post-pandemic, India has entered a new rotation cycle.
Manufacturing (PLI schemes, “Make in India”), renewable energy, semiconductors, and defense are emerging as sunrise sectors.
BFSI (Banking, Financial Services, Insurance) continues as a backbone.
Tech is shifting from services to product-based ecosystems (AI, SaaS, fintech).
Key Growth Stories Driving India
1. Banking & Financial Services (BFSI)
BFSI has been the single most consistent performer over the last two decades.
Private sector banks like HDFC Bank, ICICI Bank, and Kotak Mahindra Bank revolutionized lending, retail banking, and digital financial services.
NBFCs and microfinance institutions expanded financial inclusion.
Insurance and asset management gained prominence as savings moved from gold/land to financial assets.
Future Drivers:
Digital lending.
Unified Payments Interface (UPI) and fintech partnerships.
Rising credit penetration in semi-urban and rural India.
2. Information Technology (IT) & Digital India
The IT sector turned India into a global outsourcing hub.
TCS, Infosys, Wipro, and HCL became world-class giants.
Now, the focus is shifting from low-cost outsourcing to high-value areas: AI, blockchain, cloud services, SaaS exports.
Future Drivers:
Artificial Intelligence adoption globally.
India as a global innovation hub.
Growth of domestic tech startups and unicorns.
3. Manufacturing & PLI Push
India wants to become a global manufacturing hub like China.
The Production Linked Incentive (PLI) scheme is attracting investments in electronics, semiconductors, EVs, and pharma.
Automobile exports, mobile phone production, and defense manufacturing are picking up.
Future Drivers:
“China+1” strategy of global supply chains.
EVs and battery storage.
Defense exports and indigenous production.
4. Renewable Energy & Sustainability
India has committed to net-zero by 2070.
Solar, wind, and green hydrogen are becoming sunrise industries.
Adani Green, Tata Power Renewables, and ReNew Power are expanding capacity rapidly.
Future Drivers:
Rising energy demand.
Policy incentives for clean energy.
Global investors’ push for ESG-compliant investments.
5. Healthcare & Pharmaceuticals
India is the “pharmacy of the world.”
Generic drug manufacturing and vaccine production are key strengths.
Medical tourism is growing, making India a healthcare destination.
Future Drivers:
Biotechnology and R&D investment.
Digital health and telemedicine.
Preventive healthcare and wellness sector.
6. Consumer Story – FMCG, Retail & E-Commerce
Rising middle class and urbanization continue to boost demand.
FMCG players like HUL, Nestle, and Dabur thrive on rural consumption.
E-commerce platforms like Flipkart, Amazon, and Reliance Retail are reshaping retail.
Future Drivers:
Tier-2 and Tier-3 consumption.
Digital marketplaces and ONDC.
Premiumization trends (from basic needs to aspirational products).
7. Infrastructure & Real Estate Revival
Post-2015 slowdown, the real estate sector is rebounding.
Affordable housing, commercial spaces, and warehousing (e-commerce logistics) are growing.
Smart cities and highway construction are boosting infra.
Future Drivers:
Urbanization wave.
REITs offering investment access.
Logistics demand from digital economy.
Case Studies of Sectoral Rotation in India
1. IT vs. Infrastructure (2000s)
In the early 2000s, IT was dominant.
Mid-2000s saw infra/real estate outperform IT as global liquidity boosted construction.
Post-2008, infra crashed, IT regained leadership.
2. Private Banks vs. PSU Banks (2010s)
PSU banks struggled with NPAs.
Private banks gained market share, becoming market leaders.
The sectoral rotation within BFSI favored private institutions.
3. Renewables vs. Traditional Energy (2020s)
Earlier, coal and oil companies dominated India’s energy story.
Now, renewables and green hydrogen are attracting huge investments, showing sectoral shift toward sustainability.

TATAMOTORS 1D Time frameUpdated Snapshot
Current Price: ₹712 – ₹715
Day’s Range: ₹712 – ₹721.95
Previous Close: ₹705.85
🔹 Support & Resistance
Support 1: ₹710 – ₹708
Support 2: ₹700 – ₹705
Resistance 1: ₹721 – ₹725
Resistance 2: ₹735 – ₹740
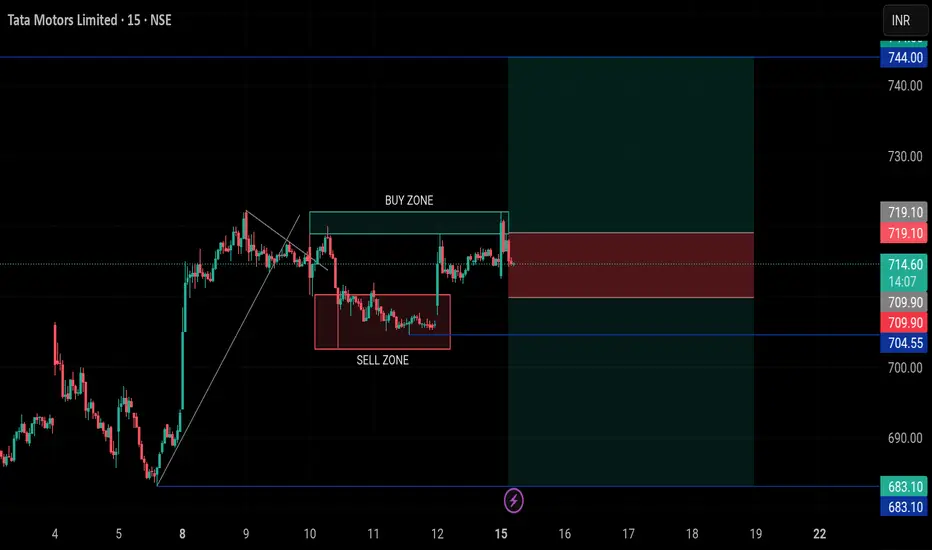
TATAMOTORS | Buy & Sell Setup | 15 Sep 2025 – 10:20 IST TATAMOTORS | Buy & Sell Setup | 15 Sep 2025 – 10:20 IST
Buy Zone: 722.00 – 718.90
Sell Zone: 710.25 – 702.55
Scenario : Buy
Entry: 719.10
Stop Loss: 709.90
Targets:
TP1 → 744.00
TP2 → 755.00
Analysis:
From Buy Zone (722.00 – 718.90) creates possibilities for a buy move.
Scenario 2 : Sell
Entry: 709.90
Stop Loss: 719.10
Targets:
TP1 → 704.55
TP2 → 683.10
Analysis:
From Sell Zone (710.25 – 702.55) creates possibilities for a sell move.
Stay alert on updates here.
⚠️ Disclaimer: This idea is shared for educational purposes only and should not be considered financial advice. Please do your own analysis before making trading decisions.
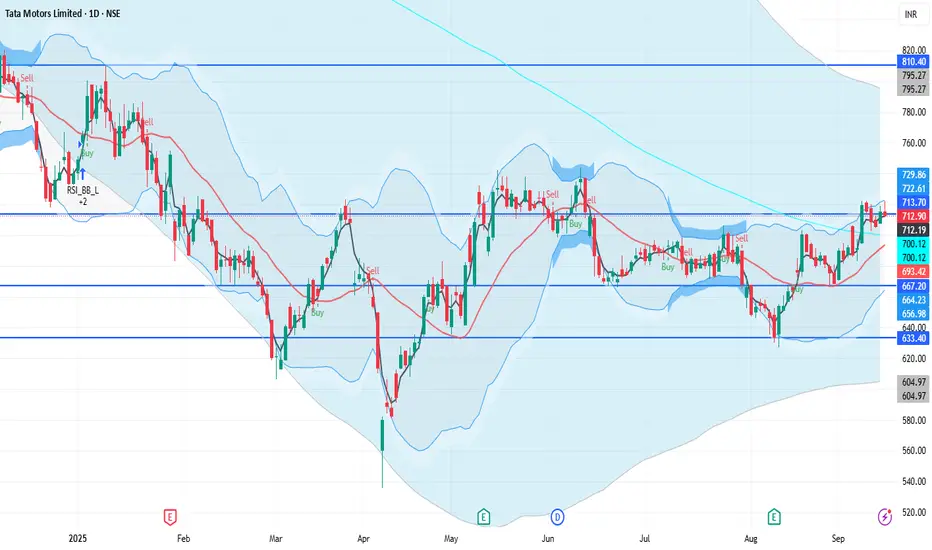
TATAMOTORS 1D Time frameCurrent Status
Price is around ₹715
The stock has been showing strength recently, with many of its moving averages (short- to long-term) supporting the rise.
Technical indicators like RSI, MACD, ADX etc. lean positive — buyers seem to have the upper hand.
There’s an inverted Head & Shoulders pattern forming, which is a bullish reversal signal if confirmed. Support zones are holding up so far.
Bullish Scenario
If Tata Motors stays above ₹700–705 support and breaks past ~₹720–725 with volume:
Possible upside to ~₹730-₹740
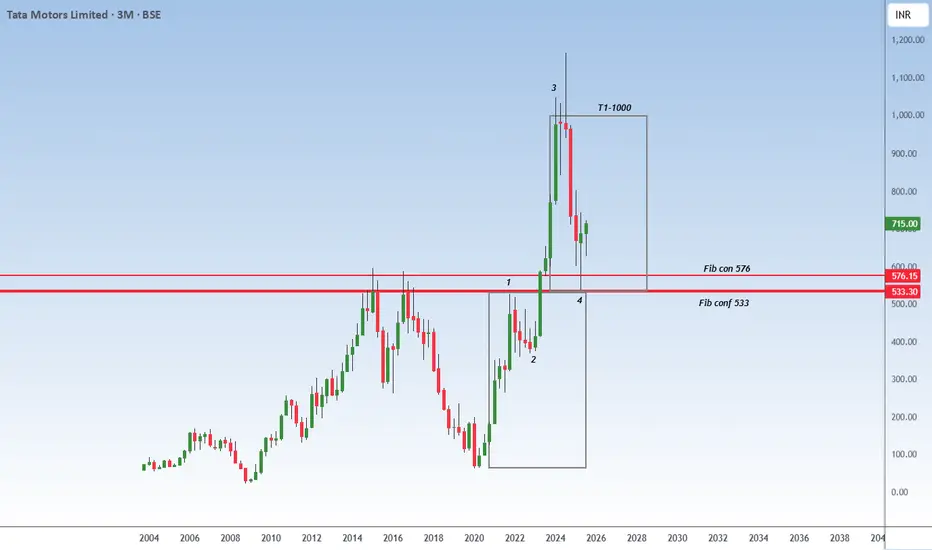
the last impulse wave is on the wayTata Motors Technical Analysis (CMP: 715)
Elliott Wave Analysis: The stock is in its 5th wave of the impulse wave, with a minimum target of 1000.
Fibonacci Analysis: Fibonacci confluence zones often mark the midpoint of a move. Given the midpoint at 533, the target of 1000 aligns with this structure.
Conclusion: With a potential upside of 40% from current levels, the stock remains an attractive buy opportunity, driven by its 5th wave target.
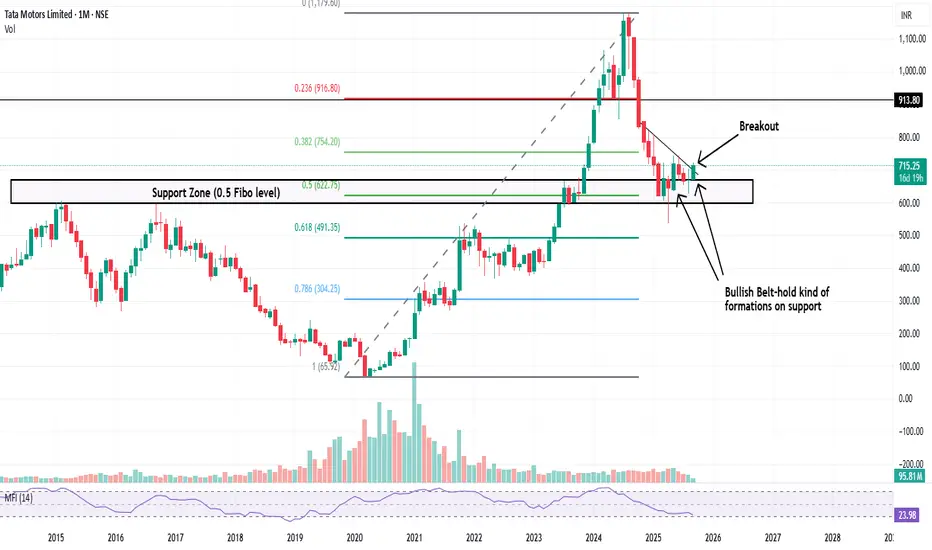
Bullish Setup in Tata Motors on 1M TFHello Everyone,
Here I have analysed the Tata Motors chart and it looks bullish for long term.
It has took Support on previous strong support.
And that zone is also 0.50 fibonacci level which is an healthly retracement considered in price action analysis.
Stock has also given breakout recently which looks good on 1W Timeframe.
So this stock looks good on 1M and 1W TF, hence this can be considered as bullish setup.
Disclaimer: This is just an a price action analysis of stock Tata Motors. Don't consider this as an stock tip or advice. Invest/Trade at your own risk.
TATAMOTORS 1D Time frame📍 Current Price
₹715.25 (closing price)
Short-Term Outlook
Bullish Scenario: A sustained move above ₹731.00 could lead to a test of the 52-week high around ₹1,006.00.
Bearish Scenario: A drop below ₹690.00 may signal a potential pullback toward ₹680.00.

Intraday Trading Tips1. Understanding Intraday Trading
Before diving into tips, let’s understand what intraday trading means.
Definition: Intraday trading involves buying and selling financial instruments—stocks, futures, options, or currencies—within the same trading session.
Objective: Profit from short-term price fluctuations.
Settlement: All open positions must be squared off before market close.
Leverage: Traders often use margin (borrowed money) to maximize gains, but this also increases risks.
For example: If you buy 100 shares of Reliance at ₹2,450 in the morning and sell them at ₹2,480 by afternoon, your profit is ₹3,000 (excluding brokerage).
2. Why Intraday Trading Attracts Traders
Quick profits: No need to wait for years like investors.
Leverage advantage: Small capital can control large trades.
Liquidity: You trade highly liquid stocks that allow easy entry/exit.
No overnight risk: Positions close before the market shuts.
However, the risks are equally high—overtrading, market volatility, and emotional decisions can wipe out capital quickly.
3. Golden Intraday Trading Tips
Tip 1: Choose the Right Stocks
Not all stocks are suitable for intraday trading.
Prefer liquid stocks (e.g., Reliance, Infosys, HDFC Bank).
Avoid penny stocks with low volumes.
Track stocks in the Nifty 50 and Bank Nifty basket—they have strong daily movement.
Look for stocks that follow market trends and are backed by news, earnings, or events.
Example: A stock with daily volume above 10 lakh shares is generally liquid enough for intraday trading.
Tip 2: Trade with a Plan
Trading without a plan is like sailing without a compass. Define:
Entry price – When to buy or sell.
Exit price – Where to book profits.
Stop-loss – How much you are ready to lose if the market goes against you.
A simple 2:1 risk-reward ratio is ideal. If you risk ₹1,000, target ₹2,000 profit.
Tip 3: Learn Technical Analysis
Intraday trading depends more on charts than company fundamentals.
Use candlestick patterns (Doji, Hammer, Engulfing).
Apply moving averages (50-day, 200-day) to spot trends.
Watch RSI (Relative Strength Index) for overbought/oversold zones.
Check Volume Profile to confirm momentum.
Example: If a stock breaks above a resistance level with high volume, it signals a potential intraday buying opportunity.
Tip 4: Follow Market Trend
“The trend is your friend.”
If the market is bullish, focus on buy opportunities.
If bearish, focus on short-selling opportunities.
Avoid going against the broader market trend.
Intraday traders often use Nifty and Bank Nifty movement as indicators of overall sentiment.
Tip 5: Use Stop Loss Religiously
The most important tool in intraday trading.
Decide in advance how much loss you can tolerate.
Place stop-loss orders immediately after entering a trade.
This prevents panic selling and large losses.
Example: Buy at ₹500, set stop-loss at ₹490. If the stock falls, you exit automatically, limiting loss.
Tip 6: Don’t Trade on Emotions
Greed and fear are the biggest enemies.
Avoid “revenge trading” after a loss.
Don’t chase stocks just because they are moving fast.
Stick to your trading plan, not your emotions.
Tip 7: Timing Matters
First 15 minutes after market opens = high volatility. Wait and observe.
Best trading hours: 9:30 AM to 11:30 AM and 1:30 PM to 2:30 PM.
Avoid trading just before market close unless you are squaring off.
Tip 8: Don’t Overtrade
Trading too many stocks at once increases confusion.
Focus on 2–3 quality trades per day.
Avoid random entry and exit without reason.
Remember: Fewer quality trades > Many random trades.
Tip 9: Keep Learning from Market News
Earnings results, RBI policy, crude oil prices, inflation data—all impact intraday trends.
Use reliable sources like Bloomberg, Moneycontrol, NSE updates.
Avoid tips from WhatsApp or Telegram groups without proper analysis.
Tip 10: Maintain Trading Discipline
Follow your rules strictly.
Keep a trading journal: Note entries, exits, reasons for trade, and results.
Review mistakes and improve.
4. Intraday Trading Strategies
Apart from general tips, let’s look at popular intraday strategies:
Breakout Trading: Enter when price breaks a strong support or resistance.
Momentum Trading: Buy rising stocks with strong volume, sell falling ones.
Scalping: Make multiple small trades for tiny profits.
Gap Trading: Trade based on price gaps at market opening.
Moving Average Crossover: Buy when short-term MA crosses above long-term MA, and vice versa for selling.
5. Risk Management in Intraday Trading
Without risk management, even the best trader will fail.
Never risk more than 1–2% of your capital per trade.
Diversify trades instead of betting everything on one stock.
Use proper leverage—don’t borrow excessively.
Conclusion
Intraday trading can be profitable, exciting, and rewarding, but it demands discipline, knowledge, and patience. Following intraday trading tips like choosing liquid stocks, sticking to stop-loss, respecting market trends, and avoiding emotions can make a big difference between success and failure.
Remember: In trading, survival is more important than speed. If you protect your capital and manage risks well, profits will follow.
Part 8 Trading Master ClassIntroduction to Options
Financial markets provide several instruments to trade and invest. Among equities, futures, commodities, and currencies, options trading has gained significant popularity worldwide, including India. Options are not just speculative tools; they are also powerful instruments for hedging, income generation, and risk management.
An option is essentially a derivative contract—its value is derived from an underlying asset like a stock, index, commodity, or currency. Unlike direct stock ownership, an option gives the buyer rights but not obligations. This unique feature makes them versatile but also complex for beginners.
To truly master options, one must understand not only the basic definitions but also pricing, market psychology, and strategies.
Basic Terminology
Before diving deeper, let’s go through the essential terms:
Option Contract: Agreement between buyer and seller based on an underlying asset.
Underlying Asset: Stock, index, commodity, or currency.
Strike Price: Pre-decided price at which the option can be exercised.
Expiry Date: The last date on which the option can be exercised.
Premium: Price paid by the buyer to acquire the option.
Lot Size: Minimum quantity for which an option can be traded.
European vs. American Options: European can be exercised only on expiry; American anytime before expiry.
Call & Put Options Explained
At the heart of option trading are two instruments: Calls and Puts.
Call Option: Gives the buyer the right (not obligation) to buy the asset at the strike price.
Buyers expect prices to rise.
Sellers (writers) expect prices to stay flat or fall.
Put Option: Gives the buyer the right (not obligation) to sell the asset at the strike price.
Buyers expect prices to fall.
Sellers expect prices to stay flat or rise.
📌 Example:
If Reliance stock trades at ₹2500:
A ₹2600 call may cost ₹50 premium. If the stock rises to ₹2700, profit = (2700-2600-50) = ₹50 per share.
A ₹2400 put may cost ₹40. If stock falls to ₹2200, profit = (2400-2200-40) = ₹160 per share.

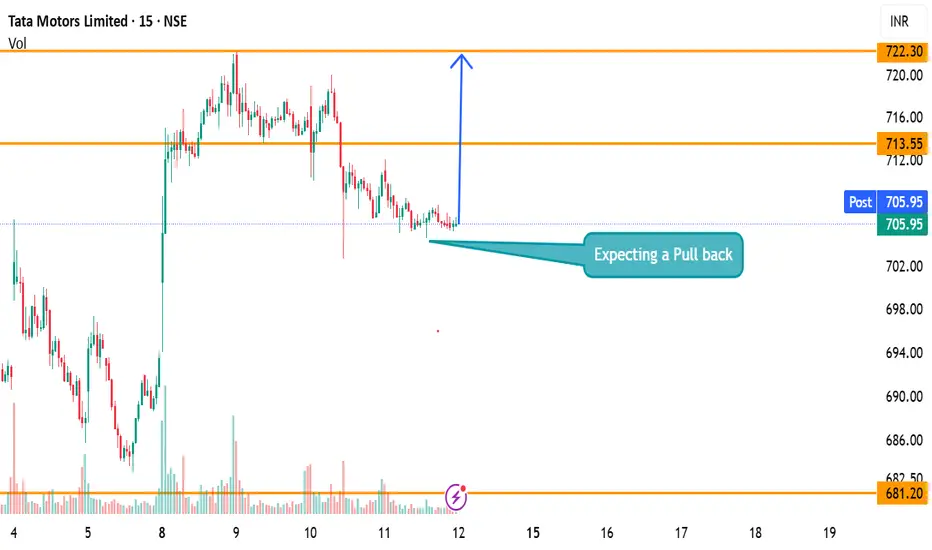
Tata Motors – 15 Min Chart AnalysisPrice is currently consolidating around ₹705 after a short-term down move.
I am expecting a pullback towards the resistance zone near ₹713.50, with a possible extension to ₹722.30 if momentum builds up.
🔑 Key Levels to Watch:
Support: ₹690 – 693
Immediate Resistance: ₹713.50
Target Zone: ₹722+
Inflation Nightmare ContinuesHistorical Background of Inflation Crises
To understand why current inflation feels like a nightmare, it is important to examine historical episodes where inflation destroyed economies and societies:
Weimar Germany (1920s) – After World War I, Germany printed money to pay reparations and fund government expenses. Prices doubled every few days, bread became unaffordable, and savings were wiped out. This hyperinflation destroyed the middle class and sowed political instability, eventually contributing to the rise of extremism.
Latin America (1980s–90s) – Countries like Argentina, Brazil, and Peru faced chronic inflation and hyperinflation due to poor fiscal discipline, currency devaluations, and external debt crises. Entire generations learned to spend salaries within hours of being paid, knowing that prices would rise dramatically by the next day.
Zimbabwe (2000s) – Perhaps one of the most extreme cases of hyperinflation, Zimbabwe experienced annual inflation in the billions of percent. Currency became worthless, and barter trade replaced the monetary system.
Global Stagflation (1970s) – Triggered by oil shocks and loose monetary policy, the developed world faced both high inflation and high unemployment. It was a nightmare scenario for policymakers, since raising interest rates to curb inflation also deepened unemployment, while stimulating growth further fueled inflation.
These examples highlight a crucial point: inflation is not simply about rising prices; it is about the breakdown of trust in money itself. Once the population loses confidence that their currency holds value, the entire economic and social order comes under threat.
Causes of the Current Inflation Nightmare
The ongoing global inflation wave is different from past episodes in its complexity. It is not caused by a single factor, but rather a convergence of multiple structural issues:
1. Post-Pandemic Demand Surge
When COVID-19 restrictions were lifted, pent-up demand for goods, travel, housing, and entertainment surged. Households that had saved during lockdowns spent aggressively. The sudden imbalance between strong demand and limited supply triggered price spikes.
2. Supply Chain Disruptions
Even though demand came back quickly, global supply chains took years to recover. Shipping costs skyrocketed, raw material shortages became common, and semiconductor shortages crippled industries from automobiles to electronics.
3. Energy Price Shocks
Geopolitical tensions, including the Russia–Ukraine war, severely disrupted oil and natural gas supplies. Europe in particular faced skyrocketing energy bills, which filtered into the cost of everything from heating to fertilizer.
4. Food Inflation
Climate change events such as droughts, floods, and heatwaves reduced agricultural productivity. Coupled with disrupted fertilizer supply chains, global food prices surged, creating a humanitarian as well as an economic crisis.
5. Loose Monetary Policy Legacy
For over a decade, central banks in the U.S., Europe, Japan, and other advanced economies pursued ultra-low interest rates and quantitative easing to stimulate growth. This cheap money created asset bubbles and an expectation of endless liquidity. When inflation surged, central banks had to pivot sharply, but the lag effect meant prices had already spiraled.
6. Labor Market Shifts
In many countries, post-pandemic labor shortages emerged due to early retirements, changes in work preferences, or immigration restrictions. Employers raised wages to attract workers, fueling wage-price spirals.
7. Geopolitical Fragmentation
The shift toward deglobalization, reshoring, and protectionism has added to costs. When supply chains are localized for security reasons, they often become less efficient and more expensive, driving structural inflation.
How Inflation Impacts Households
For ordinary families, inflation is not an abstract economic term—it is felt in daily struggles.
Erosion of Purchasing Power: Salaries often do not keep pace with rising prices, meaning households can afford less with the same income. Groceries, fuel, school fees, and healthcare eat up larger portions of budgets.
Savings Destruction: Fixed deposits and bank savings accounts yield little compared to inflation. A 6% annual return is meaningless when inflation is 8%. This pushes households into riskier investments.
Housing Stress: Rising interest rates make mortgages costlier. Rent also rises as landlords pass on higher costs.
Psychological Toll: The constant stress of managing finances in an inflationary environment reduces consumer confidence and long-term planning. Families delay weddings, education, and retirement investments.
Impact on Businesses
Rising Input Costs: Raw materials, energy, and transportation become more expensive, squeezing margins.
Unstable Pricing: Companies face difficulties in setting long-term contracts when costs are volatile.
Debt Burden: Higher interest rates increase borrowing costs, particularly painful for small businesses.
Investment Delays: Businesses often delay expansion projects due to uncertain demand and financing conditions.
Wage Pressures: To retain talent, companies must raise wages, further driving costs upward.
This environment often results in a vicious cycle where businesses either pass on costs to consumers, fueling further inflation, or cut back on production, worsening economic stagnation.
Policy Dilemmas
Central banks and governments face a unique challenge: how to curb inflation without destroying growth.
Central Bank Tightening – Raising interest rates helps reduce demand, but also risks triggering recessions.
Fiscal Policy – Governments can subsidize food, fuel, or housing, but that adds to fiscal deficits and sometimes worsens inflation.
Supply-Side Reforms – Long-term solutions like improving infrastructure, energy independence, or agricultural productivity take time.
Communication Crisis – Policymakers struggle to maintain credibility. If the public believes central banks cannot control inflation, expectations of rising prices become self-fulfilling.
This is the nightmare scenario: monetary tools are blunt, fiscal tools are politically constrained, and structural reforms are slow.
Global Perspective
United States: Persistent wage inflation, strong consumer demand, and housing shortages make it difficult for the Federal Reserve to achieve its 2% inflation target.
Europe: Energy dependence and fragmented fiscal policies complicate the European Central Bank’s task.
Emerging Markets: Countries like India and Brazil face imported inflation through higher oil and food prices. Weaker currencies exacerbate the problem.
Developing Nations: Many African and South Asian countries face “stagflation” – high inflation with weak growth, often worsened by debt crises.
Social and Political Fallout
Inflation is not just an economic issue; it destabilizes societies:
Rising Inequality: Wealthier households with assets like real estate or equities can hedge against inflation, while the poor, who spend most income on essentials, suffer disproportionately.
Erosion of Trust in Institutions: When inflation persists, people lose faith in central banks, governments, and financial systems.
Political Populism: Inflation often fuels populist movements promising subsidies, wage increases, or price controls—measures that may worsen long-term stability.
Unrest and Protests: History shows that food and fuel inflation often sparks protests, riots, and even revolutions.
The Nightmare if Inflation Persists
If the inflation nightmare continues unchecked, the world could face:
Currency Crises in weaker economies.
Debt Defaults by heavily indebted nations unable to finance rising borrowing costs.
Global Recession triggered by aggressive rate hikes.
Social Instability as unemployment and inequality rise.
Shift in Global Power – countries that manage inflation better may emerge as new economic leaders, while others fall behind.
Possible Pathways Out
While the nightmare seems relentless, there are strategies to stabilize the situation:
Technology and Productivity Growth: Innovation can reduce costs, offsetting inflationary pressures.
Energy Transition: Moving toward renewable energy reduces vulnerability to oil and gas shocks.
Global Cooperation: Trade agreements and supply chain resilience can bring stability.
Credible Monetary Policy: Central banks must maintain independence and act decisively to anchor expectations.
Targeted Fiscal Support: Protecting vulnerable households while maintaining overall fiscal discipline.
Conclusion
Inflation is more than rising prices—it is an erosion of stability, trust, and prosperity. When it becomes entrenched, it threatens not just economies but the very fabric of societies. Today’s inflationary pressures are unique in their complexity, fueled by supply shocks, geopolitical tensions, and structural economic changes. The nightmare continues because solutions are neither simple nor immediate.
Yet, history also shows that inflationary crises can be overcome with credible policies, innovation, and resilience. The real challenge lies in balancing short-term sacrifices with long-term stability. If policymakers and societies fail to rise to this challenge, the inflation nightmare will not just continue—it may define the economic future of an entire generation.
Short-Term and Long-Term TradingPart 1: Understanding Short-Term Trading
What is Short-Term Trading?
Short-term trading involves buying and selling financial instruments within a short time frame to capture smaller price fluctuations. These trades can last from a few seconds to a few weeks but rarely longer.
Traders use technical analysis, price action, and market news rather than focusing deeply on a company’s fundamentals. The idea is to profit from volatility rather than waiting for long-term growth.
Timeframes of Short-Term Trading
Scalping – Trades last seconds to minutes; small profits but many trades daily.
Day Trading – Positions opened and closed within the same trading day; no overnight risk.
Swing Trading – Holding for days to weeks to capture short-term price swings.
Momentum Trading – Riding strong trends until momentum fades.
Characteristics of Short-Term Trading
High frequency of trades
Technical charts used more than company financials
Requires constant monitoring of markets
Profits are often smaller per trade but accumulate over time
High leverage and risk compared to long-term investing
Advantages of Short-Term Trading
Quick Profits – Traders don’t have to wait years to see results.
Opportunities in Any Market Condition – Can profit in bull or bear markets.
No Overnight Risk (Day Trading) – Avoids surprises from global events.
Leverage Benefits – Small capital can control larger positions.
Active Engagement – Ideal for people who enjoy the excitement of markets.
Disadvantages of Short-Term Trading
High Transaction Costs – Brokerage, taxes, and fees eat into profits.
Stress and Time-Intensive – Requires discipline and constant attention.
High Risk of Losses – One mistake can wipe out multiple small gains.
Emotionally Draining – Fear and greed can influence decisions.
Less Focus on Fundamentals – Ignoring fundamentals may cause big losses if markets turn unexpectedly.
Part 2: Understanding Long-Term Trading (Investing)
What is Long-Term Trading?
Long-term trading, often referred to as investing, is about buying and holding assets for months, years, or even decades. Investors rely on fundamental analysis—studying financial statements, industry trends, and company management—to pick strong assets that will grow over time.
The goal is not quick profit but wealth creation through compounding returns, dividends, and capital appreciation.
Timeframes of Long-Term Trading
Position Trading – Holding for weeks to months based on fundamentals and macro trends.
Buy and Hold Investing – Keeping assets for years regardless of short-term volatility.
Value Investing – Buying undervalued assets with long-term growth potential.
Growth Investing – Focusing on companies with strong future prospects.
Characteristics of Long-Term Trading
Low frequency of trades
Fundamental analysis is the primary tool
Requires patience and discipline
Dividends and compounding play a major role in returns
Can survive short-term market volatility
Advantages of Long-Term Trading
Wealth Building Through Compounding – Small returns grow significantly over years.
Less Stress – No need to monitor markets every second.
Lower Costs – Fewer trades mean fewer fees.
Tax Efficiency – In many countries, long-term capital gains are taxed lower than short-term.
Riding Big Trends – Capturing multi-year bull runs can be very profitable.
Disadvantages of Long-Term Trading
Slow Results – Wealth takes years to accumulate.
Requires Patience – Not suitable for people seeking instant results.
Market Crashes Hurt – Long-term holders can see portfolios drop significantly during downturns.
Opportunity Cost – Money locked in assets can’t be used for other opportunities.
Emotional Rollercoaster – Watching markets swing for years requires strong psychology.
Part 3. Strategies in Short-Term Trading
1. Scalping Strategy
Aim: Capture very small price movements.
Tools: 1-minute and 5-minute charts, high liquidity stocks, tight stop-loss.
2. Day Trading
Enter and exit within the same day.
Relies on intraday volatility, news-based moves.
3. Swing Trading
Hold for a few days to weeks.
Uses candlestick patterns, support-resistance, moving averages.
4. Breakout Trading
Buying when prices cross resistance or selling when they break support.
5. Momentum Trading
Enter trades in the direction of strong volume-backed trends.
Part 4: Strategies in Long-Term Trading
1. Value Investing
Buy undervalued companies and hold until true value is realized.
Famous example: Warren Buffett.
2. Growth Investing
Focus on companies with strong future revenue and earnings growth.
Examples: Tech giants like Apple, Tesla, Infosys.
3. Dividend Investing
Buy companies with stable dividend payouts for regular income.
4. Index Investing
Invest in entire indexes (like Nifty 50, S&P 500) for broad exposure.
5. Position Trading
Hold for months based on fundamentals and macroeconomic conditions.
Psychology of Short-Term vs Long-Term
Short-Term Trader’s Psychology
Must control fear and greed.
Needs quick decision-making.
Overtrading is a big risk.
Long-Term Investor’s Psychology
Requires patience during market downturns.
Must avoid panic selling.
Focus on compounding rather than daily fluctuations.
Risks in Both Approaches
Risks in Short-Term Trading
Over-leverage
Market manipulation & sudden moves
Emotional stress
High losses from small mistakes
Risks in Long-Term Trading
Company going bankrupt
Decades of underperformance in certain sectors
Inflation eroding returns
Long wait for profits
Which Approach is Better?
The answer depends on personality, capital, and goals:
If you want fast action, can handle stress, and enjoy charts, short-term trading might suit you.
If you want wealth creation, passive growth, and peace of mind, long-term investing is better.
Many successful market participants combine both—short-term trading for active income and long-term investing for wealth creation.
Conclusion
Both short-term and long-term trading are powerful methods to make money in financial markets, but they cater to different mindsets. Short-term trading is like sprinting—fast, exciting, but exhausting. Long-term trading is like marathon running—slow, steady, and rewarding in the end.
The best approach isn’t about choosing one over the other, but about understanding your risk tolerance, goals, and personality. Some people thrive in fast-paced day trading, while others prefer sitting tight with long-term compounding investments.
In the end, successful traders and investors know one golden truth: discipline and consistency matter more than time horizon.

TATAMOTORS 1H Time frameMarket Snapshot
Current Price: ~₹708
Intraday Range: ~₹706 – ₹712
Bias: Sideways to mildly bullish
📈 Moving Averages (1H)
20-hour MA: ~₹707 → acting as short-term support
50-hour MA: ~₹704 → supportive level below
200-hour MA: ~₹699 → strong base, long-term intraday support
All moving averages are aligned above each other → bias is bullish.
🔎 Indicators
RSI (14, hourly): ~59 → Momentum positive, not overbought
MACD (1H): Bullish crossover, showing upward momentum
ADX: ~20 → Trend strength is still weak to moderate
Stochastic: Near overbought → caution for minor pullback
🔧 Key Levels
Support: ₹705 → first support, then ₹700 as stronger base
Resistance: ₹712 → immediate resistance, next at ₹715
🧭 Short-Term Outlook
Bullish Case: Break above ₹712–715 zone could push price toward ₹720+.
Bearish Case: Failure at resistance + RSI overbought may drag it back to ₹705 or even ₹700.
Overall Bias: Slightly bullish, but resistance is close and strong.
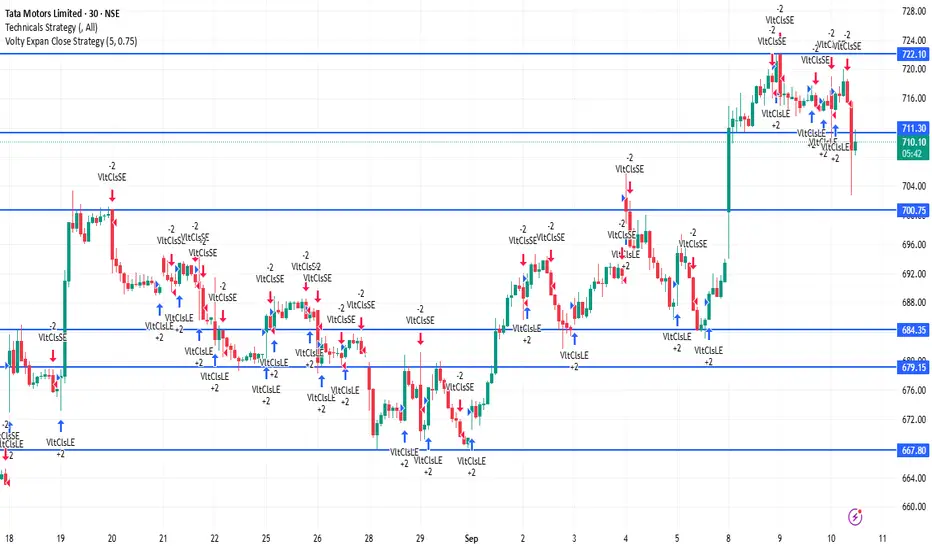
TATAMOTORS 30Minutes Time frame📊 Tata Motors – 30M Technical Levels
🔹 Support Zones
₹708 – ₹710 → Immediate intraday support
₹705 – ₹707 → Strong support zone
₹702 – ₹704 → Critical support; breakdown here can lead to further weakness
🔹 Resistance Zones
₹720 – ₹722 → First major resistance
₹724 – ₹726 → Strong supply zone
₹728 – ₹730 → Intraday breakout level; above this, momentum may pick up strongly
📈 30M Trend Outlook
Stock is sideways to mildly bullish on the 30-min chart.
Above ₹722 → Buyers gain control; possible upside to ₹726–₹730.
Below ₹708 → Weakness likely; price may slip to ₹705–₹702.
As long as it stays above ₹710, bias remains positive in the short term.
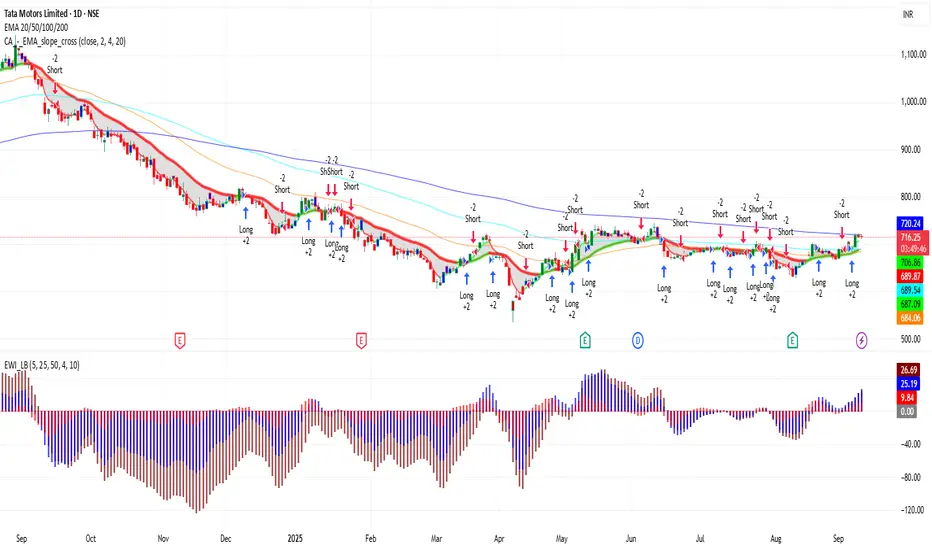
TATAMOTORS 1D Time frame📍 TATAMOTORS – 1D Important Levels (Current)
🔹 Support Zones
900 – 910 → Immediate daily support
870 – 880 → Strong support; buyers likely to defend here
835 – 850 → Major support; breakdown here may shift trend bearish
🔹 Resistance Zones
940 – 950 → Immediate daily resistance
970 – 980 → Strong resistance; breakout above this can fuel momentum
1,000 – 1,020 → Major psychological resistance; if crossed, bullish trend strengthens further
⚖️ Daily Trend Outlook
Tata Motors is in a bullish phase on the daily chart, making higher lows and sustaining above key supports.
As long as price holds above 900, the stock remains positive.
A breakout above 950 – 980 may open the path towards 1,000+.
A breakdown below 900 may lead to weakness toward 880 – 850.
TATAMOTOR 1H Tata Motors – 1 Hour Chart Analysis
🔹 Trend Overview
On the 1-hour chart, Tata Motors is currently showing bullish momentum with higher highs and higher lows.
However, price is also facing some resistance near the upper range, so intraday swings are possible.
🔹 Key Levels to Watch
Immediate Support Zone: around ₹706 – ₹709
Stronger Support: near ₹700
Immediate Resistance Zone: around ₹717 – ₹721
Major Resistance: around ₹734 – ₹735
🔹 Intraday Trading View
If price holds above ₹709, bulls may push towards ₹721 – ₹734.
If price slips below ₹706, a retest of ₹700 – ₹695 is possible.
Consolidation is likely in the ₹709 – ₹721 range before any major breakout.
🔹 Indicators (1-Hour Chart)
Moving Averages → Price trading above 20 EMA and 50 EMA, showing short-term strength.
RSI → Near the 60–65 zone, still bullish but close to overbought.
Volume → Slightly increasing on up-moves, showing buyers are active.
🔹 Summary
Bias: Bullish to range-bound
Support Levels: ₹706 / ₹700
Resistance Levels: ₹721 / ₹734
Intraday traders should watch the ₹709 – ₹721 band for breakout or breakdown trades.

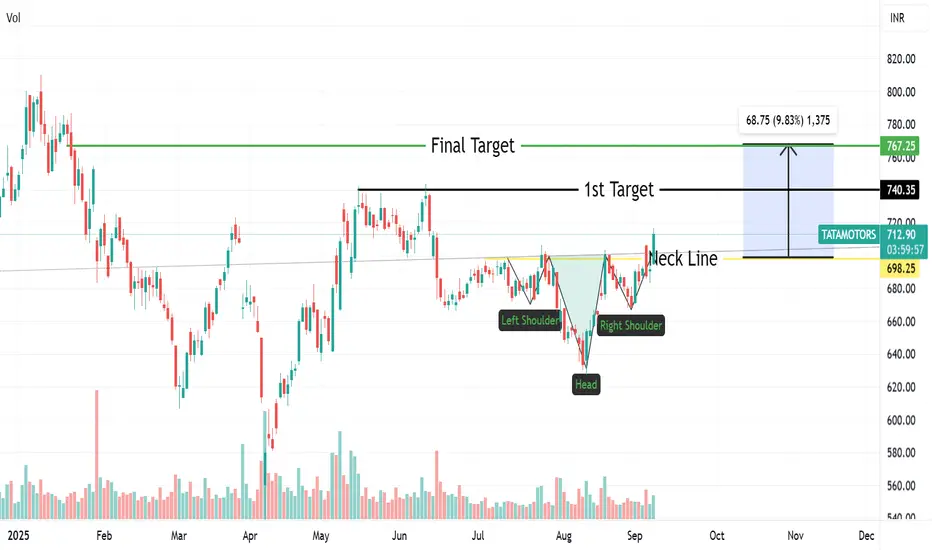
tatamotor inverted head and shoulders pattern formation in Day tatamotor inverted head and shoulders pattern formation in Day time frame check out chart

Tata Motors looking for BullsIt's time to Buy Tata Motors to bag yourself with good profits
Buy @ 691 CMP.
Stoploss - 627.05
Target - 834.70, 890.50, 965.40

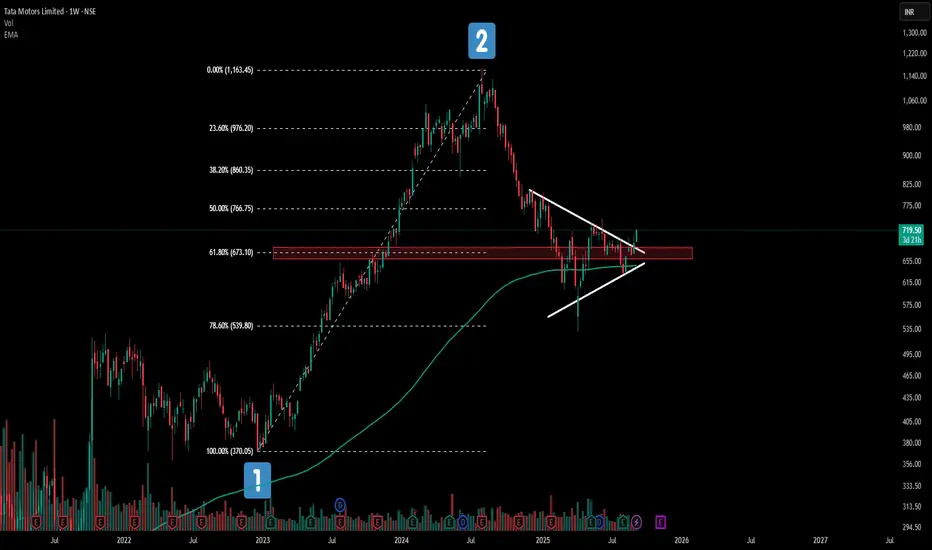
This Tata Motors Pattern Could Change Everything!Tata Motors weekly chart is painting a fascinating picture right now!
📊 Price action is dancing around the 61.8% Fibonacci retracement - a golden ratio traders love to watch.
🎯What makes this even more intriguing? The 200 EMA is playing perfect host to this consolidation party
✨While a symmetrical triangle pattern quietly takes shape. It's like watching three technical forces align in one.
Keeping it simple .
⚠️ This analysis is for educational purposes only and should not be considered as financial advice. Trading and investing in stocks involves substantial risk of loss. Please conduct your own research and consult with a qualified financial advisor before making any investment decisions
TATAMOTORS Price ActionTata Motors is trading close to ₹1,028 as of September 8, 2025, retaining its strong uptrend following a year of robust price appreciation. The company’s market capitalization exceeds ₹3.6 lakh crore, underlining its position among India’s largest automotive manufacturers. After reaching new 52-week highs, the stock is experiencing healthy consolidation, with volumes remaining elevated—reflecting continued institutional and retail investor interest.
Recent quarterly earnings have showcased remarkable performance: net profits have doubled year-on-year, with total revenue growth driven primarily by the continued success of its passenger vehicles, electric vehicle segment, and global subsidiary Jaguar Land Rover. Operating margins are stable at healthy levels, as cost control and efficiency gains offset input price volatility. The EPS has consistently improved, confirming strengthening core profitability.
Technically, Tata Motors trades well above its key support levels and major moving averages, confirming bullish momentum. RSI and MACD oscillators indicate the trend is not overextended, and the stock remains attractive for both momentum and value investors. The company maintains prudent leverage and increasing free cash flow, ensuring capacity for capital expenditure, dividend payout, and strategic investments.
Long-term prospects are optimistic: Tata Motors is benefiting from shifts toward EVs, resilient domestic demand, and strong exports. The outlook is constructive, with potential for further capital gains, provided operational progress continues and sector tailwinds remain supportive.

Reverse Head & Shoulder Pattern breakout in Tata motorTata motor given Reverse Head & Shoulder Pattern breakout form neck line arround 700 level .
Final Target of it will be arround 765 level ,With a stoploss of 680 Rs .
its not a buy or sell recommendation ..For education purpose only.
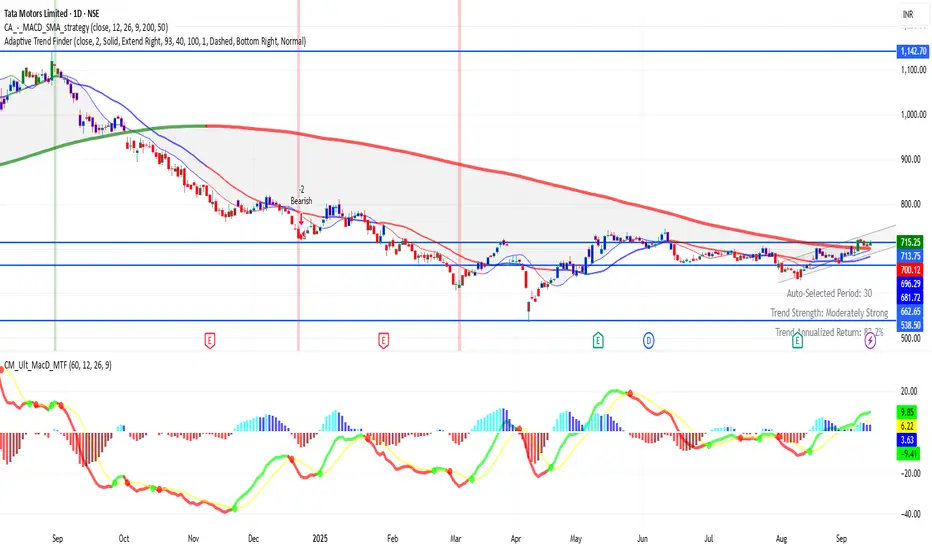
Algo & Quant Trading in IndiaIntroduction
Financial markets worldwide have witnessed a paradigm shift in the last two decades. Traditional trading, which once relied heavily on manual execution, intuition, and gut feeling, has now given way to sophisticated, technology-driven strategies. In India, this transformation has been especially visible with the rise of Algorithmic (Algo) Trading and Quantitative (Quant) Trading.
Algo trading refers to the use of computer programs that follow a defined set of instructions (algorithms) to place trades automatically. Quant trading, on the other hand, is rooted in mathematical, statistical, and computational models to identify trading opportunities. While the two often overlap, quant strategies form the brain of the model, and algos are the execution engine.
In India, the growth of algo and quant trading is not just a reflection of global trends, but also a product of domestic factors like regulatory changes, increased market participation, rapid digitization, and the rise of fintech. From institutional investors to retail traders, the Indian market is undergoing a revolution that is reshaping how trading is executed.
Evolution of Algo & Quant Trading Globally and in India
Global Origins
Algorithmic trading traces its roots back to the 1970s and 1980s in the US and Europe when exchanges began offering electronic trading systems. By the late 1990s and early 2000s, hedge funds and investment banks began adopting quant-driven models for arbitrage, high-frequency trading (HFT), and risk management. Today, in developed markets, more than 70–80% of trades on exchanges are executed through algos.
Indian Journey
India’s journey began much later but has picked up speed rapidly:
2000 – NSE and BSE adopted electronic trading, paving the way for automation.
2008 – SEBI formally allowed algorithmic trading in India, mainly targeted at institutional traders.
2010–2015 – Introduction of co-location services by exchanges allowed brokers and institutions to place their servers closer to exchange data centers, reducing latency.
2016–2020 – With fintech growth and APIs provided by brokers like Zerodha, Upstox, and Angel One, algo trading reached the retail segment.
2020 onwards – Post-pandemic, massive digitization, cheaper data, and increased retail participation fueled the adoption of quant-based strategies among traders.
Today, algo and quant trading in India account for over 50% of daily turnover on NSE and BSE in derivatives and equities combined.
Understanding Algo Trading
Definition
Algo trading uses predefined rules based on time, price, volume, or mathematical models to execute trades automatically without human intervention.
Key Features
Speed: Orders are executed in milliseconds.
Accuracy: Eliminates human error in order placement.
Discipline: Removes emotional bias.
Backtesting: Strategies can be tested on historical data before going live.
Common Algo Strategies in India
Arbitrage Trading – Exploiting price differences across cash and derivatives or across different exchanges.
Market Making – Providing liquidity by quoting both buy and sell prices.
Trend Following – Using indicators like moving averages, MACD, and momentum.
Mean Reversion – Betting that prices will revert to their historical average.
Scalping / High-Frequency Trading – Very short-term strategies capturing micro-movements.
Execution Algorithms – VWAP (Volume Weighted Average Price), TWAP (Time Weighted Average Price) used by institutions to minimize market impact.
Understanding Quant Trading
Definition
Quant trading involves developing strategies based on quantitative analysis – mathematical models, statistical techniques, and computational algorithms.
Building Blocks of Quant Trading
Data – Price data, fundamental data, alternative data (news sentiment, social media, macro indicators).
Models – Predictive models like regression, machine learning algorithms, time-series analysis.
Risk Management – Position sizing, stop-loss rules, drawdown control.
Execution – Often implemented via algorithms to ensure efficiency.
Popular Quant Strategies in India
Statistical Arbitrage (pairs trading, cointegration).
Factor Investing (momentum, value, quality factors).
Machine Learning Models (neural networks, random forests for pattern detection).
Event-Driven Strategies (earnings announcements, macro data, corporate actions).
Regulatory Framework in India
Algo and quant trading in India operate under the supervision of SEBI (Securities and Exchange Board of India). Key guidelines include:
Direct Market Access (DMA): Institutional traders can place orders directly into exchange systems.
Co-location Facilities: Exchanges provide space near their servers to reduce latency for HFTs.
Risk Controls: SEBI mandates pre-trade risk checks (price band, order value, quantity limits).
Approval for Brokers: Brokers offering algos must get SEBI approval and ensure audits.
Retail Algo Trading (2022 draft): SEBI expressed concerns about unregulated retail algos offered via APIs. Regulations are evolving to protect small investors.
While SEBI encourages innovation, it is equally cautious about market stability and fairness.
Technology Infrastructure Behind Algo & Quant Trading
Essential Components
APIs (Application Programming Interfaces): Provided by brokers to allow programmatic order execution.
Low-Latency Networks: High-speed internet and co-location access for institutional players.
Programming Languages: Python, R, C++, and MATLAB dominate strategy development.
Databases & Cloud Computing: MongoDB, SQL, AWS, and Azure for storing and analyzing data.
Backtesting Platforms: Tools like Amibroker, MetaTrader, and broker-provided backtesters.
Rise of Retail Platforms in India
Zerodha’s Kite Connect API
Upstox API
Angel One SmartAPI
Algo platforms like Tradetron, Streak, AlgoTest
These platforms democratized algo and quant trading, allowing retail traders to build, test, and deploy strategies without deep coding knowledge.
Advantages of Algo & Quant Trading
Speed & Efficiency – Execution in microseconds.
No Human Emotions – Reduces fear, greed, or panic.
Scalability – Strategies can run across multiple stocks simultaneously.
Backtesting Capability – Historical simulations improve reliability.
Liquidity & Market Depth – Enhances overall efficiency of markets.
Challenges and Risks
Technology Costs: Infrastructure for serious HFT/quant models is expensive.
Regulatory Uncertainty: Retail algo rules are still evolving.
Market Risks: Backtested strategies may fail in live conditions.
Overfitting Models: Quant strategies may look perfect on paper but collapse in reality.
Operational Risks: Server downtime, internet issues, or software bugs can lead to losses.
The Rise of Retail Algo Traders in India
Traditionally, algo and quant trading were limited to large institutions, hedge funds, and prop trading firms. However, in India, retail adoption is rapidly increasing:
Young traders with coding skills are building custom strategies.
Platforms like Streak allow no-code algo building.
Social trading and strategy marketplaces let retail traders copy tested models.
This democratization is changing market dynamics, as retail algos now contribute significantly to volumes.
Role of Prop Trading Firms and Hedge Funds
Several proprietary trading firms and domestic hedge funds are aggressively building quant and algo strategies in India. These firms:
Employ mathematicians, statisticians, and programmers.
Focus on arbitrage, high-frequency, and statistical models.
Benefit from co-location and institutional-grade infrastructure.
Examples include Tower Research, Quadeye, iRage, and Dolat Capital.
Impact on Indian Markets
Higher Liquidity: Algo trading has improved depth and bid-ask spreads.
Reduced Costs: Institutional investors save on execution costs.
Efficient Price Discovery: Arbitrage strategies ensure fewer mispricings.
Volatility Concerns: Sudden algorithmic errors can lead to flash crashes.
Retail Empowerment: Access to professional-grade tools has leveled the playing field.
Future of Algo & Quant Trading in India
Artificial Intelligence & Machine Learning: AI-driven algos will dominate pattern recognition.
Alternative Data Usage: News analytics, social sentiment, and satellite data will gain importance.
Expansion to Commodities & Crypto: Once regulatory clarity improves, algo adoption will rise in these markets.
Wider Retail Participation: With APIs and fintech growth, retail algo adoption will skyrocket.
Regulatory Clarity: SEBI will formalize frameworks for retail algo safety.
Case Studies
Case Study 1: Arbitrage in Indian Equities
A quant firm builds a model exploiting price differences between NSE and BSE for highly liquid stocks like Reliance and HDFC Bank. The algo executes hundreds of trades daily, making small but consistent profits with low risk.
Case Study 2: Retail Trader Using Streak
A retail trader builds a moving average crossover strategy on Streak for Nifty options. Backtests show consistent profits, and the algo runs live with automated execution. While returns are smaller than HFT firms, it brings consistency and discipline to retail trading.
Conclusion
Algo and Quant trading in India are no longer niche activities reserved for a few elite institutions. They have become an integral part of the Indian financial ecosystem, transforming how markets function. The synergy of technology, regulation, and retail participation is reshaping trading culture.
While risks remain in terms of technology dependence and regulatory gaps, the benefits – efficiency, transparency, and democratization – far outweigh the challenges. The next decade will likely see India emerge as one of the fastest-growing hubs for algo and quant trading in Asia, supported by its large pool of engineers, coders, and financial talent.
Algo & Quant trading are not just the future of Indian markets – they are the present reality shaping every tick on the screen.