TATMOT looking nice after a long timeTata motors looking nice ready for break
all auto stocks are blasting
TATAMOTORS trade ideas
Part 6 Learn Institutional TradingHow Options are Priced
Options are more complex than stocks because they have two value components:
Intrinsic Value = Difference between spot price and strike price (if profitable).
Time Value = Extra premium traders pay for the possibility of future moves.
The pricing is influenced by The Greeks:
Delta: Sensitivity of option price to underlying asset moves.
Theta: Time decay (options lose value as expiry nears).
Vega: Impact of volatility on option price.
Gamma: Rate of change of delta.
Understanding Greeks is essential for advanced option strategies.
Types of Options
Options exist across asset classes:
Equity Options: Stocks like Reliance, TCS, Infosys.
Index Options: Nifty, Bank Nifty, Sensex.
Currency Options: USD/INR, EUR/INR.
Commodity Options: Gold, Crude oil, Agricultural products.

Part 3 Trading Master ClassHow Options Work in Practice
Let’s take a real-life relatable scenario:
👉 Suppose you think Nifty (20,000) will rise in the next week.
You buy a Nifty Call Option 20,200 Strike at premium ₹100.
Lot size = 50, so total cost = ₹5,000.
Now:
If Nifty goes to 20,400 → Your option is worth ₹200 (profit ₹5,000).
If Nifty stays at 20,000 → Option expires worthless (loss = ₹5,000).
So, with only ₹5,000, you controlled exposure worth ₹10 lakhs. That’s leverage.
Participants in Options Market
There are four main categories of traders:
Call Buyer → Expects price to go UP.
Call Seller (Writer) → Expects price to stay flat or go DOWN.
Put Buyer → Expects price to go DOWN.
Put Seller (Writer) → Expects price to stay flat or go UP.

Part 3 Learn Institutional Trading Why Trade Options?
Options are popular for several reasons:
Leverage: You can control a large number of shares with a relatively small investment (premium).
Hedging: Protect your portfolio against downside risk using options as insurance.
Income Generation: Selling options can provide regular income (premium received).
Flexibility: Options allow you to profit from upward, downward, or sideways movements.
Risk Management: Losses can be limited to the premium paid.
Types of Options Strategies
Options strategies can be simple or complex, depending on the trader’s goal:
Basic Strategies
Long Call: Buy a call expecting the stock to rise.
Long Put: Buy a put expecting the stock to fall.
Covered Call: Hold the stock and sell a call to earn premium.
Protective Put: Buy a put to protect against downside risk on a stock you own.

Futures Trading ExplainedIntroduction
Futures trading is one of the most powerful financial instruments in the world of investing and trading. Unlike traditional stock buying where you own a piece of a company, futures are derivative contracts that allow you to speculate on the price movement of commodities, currencies, indices, and financial assets without owning them directly.
The futures market plays a crucial role in global finance by providing price discovery, risk management (hedging), and speculative opportunities. From farmers locking in prices for crops to institutional traders speculating on crude oil, futures are everywhere in the financial ecosystem.
In this guide, we’ll explore futures trading in detail, covering everything from the basics to advanced strategies, with real-world examples.
1. What are Futures?
A futures contract is a legally binding agreement to buy or sell an underlying asset at a predetermined price at a specific time in the future.
Key points:
Underlying asset: The thing being traded (wheat, crude oil, gold, stock index, currency, etc.).
Standardized contract: The size, quality, and delivery date are pre-defined by the exchange.
Leverage: Traders can control large positions with small capital (margin).
Cash-settled or physical delivery: Some futures end with cash settlement, others with delivery of the actual asset.
For example:
A wheat farmer agrees to sell 1000 bushels of wheat at $7 per bushel for delivery in 3 months. The buyer agrees to purchase it. Regardless of where the price goes, both are bound to the contract terms.
2. History and Evolution of Futures
Futures are not new – they date back centuries.
Japan (1700s): The Dojima Rice Exchange in Osaka is considered the birthplace of futures. Rice merchants used contracts to stabilize income.
Chicago Board of Trade (1848): Modern futures trading started in the U.S. with grain contracts.
20th Century: Expansion into metals, livestock, and energy.
Late 20th to 21st Century: Financial futures (currencies, indices, interest rates) became dominant.
Today, futures are traded worldwide on major exchanges like CME (Chicago Mercantile Exchange), ICE (Intercontinental Exchange), and NSE (National Stock Exchange of India).
3. Futures vs. Other Instruments
To understand futures better, let’s compare them with other markets:
Futures vs. Stocks
Stocks = Ownership of a company.
Futures = Contract to trade an asset, no ownership.
Stocks are unleveraged by default; futures use leverage.
Futures vs. Options
Options = Right but not obligation.
Futures = Obligation for both buyer and seller.
Options limit risk (premium paid); futures have unlimited risk.
Futures vs. Forwards
Forwards = Customized, private contracts (OTC).
Futures = Standardized, exchange-traded, regulated.
4. How Futures Trading Works
Let’s break down the mechanics:
a) Contract Specifications
Every futures contract specifies:
Underlying asset (Gold, Nifty index, Crude oil, etc.)
Contract size (e.g., 100 barrels of oil)
Expiration date (e.g., March 2025 contract)
Tick size (minimum price movement)
Settlement type (cash/physical)
b) Margin and Leverage
Traders don’t pay full value; they post margin (a percentage, usually 5–15%).
Example: 1 crude oil futures contract = 100 barrels. If price = $80, contract value = $8,000. Margin required may be $800. You control $8,000 with just $800.
c) Mark-to-Market (MTM)
Futures are settled daily. Profits and losses are adjusted every day.
If your trade is in profit, money is credited; if in loss, debited.
d) Long and Short Positions
Long = Buy (expecting price rise).
Short = Sell (expecting price fall).
Unlike stocks, short selling in futures is easy because contracts don’t require ownership of the asset.
5. Participants in Futures Market
The market brings together different players:
Hedgers – Reduce risk.
Example: A farmer sells wheat futures to lock in price; an airline buys crude oil futures to hedge fuel cost.
Speculators – Profit from price movements.
Traders, investors, hedge funds.
They provide liquidity but assume higher risk.
Arbitrageurs – Exploit price differences.
Example: Buy in spot market and sell futures if mispricing exists.
6. Types of Futures Contracts
Futures are available across asset classes:
a) Commodity Futures
Agricultural: Wheat, corn, soybeans, coffee.
Energy: Crude oil, natural gas.
Metals: Gold, silver, copper.
b) Financial Futures
Index futures (Nifty, S&P 500).
Currency futures (USD/INR, EUR/USD).
Interest rate futures (10-year bond yields).
c) Other Emerging Futures
Volatility index futures (VIX).
Crypto futures (Bitcoin, Ethereum).
7. Futures Trading Strategies
Futures are flexible and allow many trading approaches:
a) Directional Trading
Going long if expecting price rise.
Going short if expecting price fall.
b) Hedging
Farmers hedge crop prices.
Exporters/importers hedge currency fluctuations.
Investors hedge stock portfolios with index futures.
c) Spread Trading
Buy one contract, sell another.
Example: Buy December crude oil futures, sell March crude oil futures (calendar spread).
d) Arbitrage
Exploiting mispricing between spot and futures.
Example: If Gold futures are overpriced compared to spot, arbitrageurs sell futures and buy spot.
e) Advanced Strategies
Pairs trading: Trade correlated futures.
Hedged positions: Combining futures with options.
8. Advantages of Futures Trading
High Leverage: Amplifies potential returns.
Liquidity: Major futures markets have deep liquidity.
Transparency: Regulated by exchanges.
Flexibility: Can trade both rising and falling markets.
Hedging tool: Reduces risk exposure.
9. Risks in Futures Trading
While powerful, futures are risky:
Leverage risk: Losses are amplified just like profits.
Volatility risk: Futures can swing widely.
Margin calls: If losses exceed margin, traders must add funds.
Liquidity risk: Some contracts may have low volume.
Unlimited losses: Unlike options, risk is not capped.
Example: If you short crude oil at $80 and it rises to $120, your losses are massive.
10. Practical Example of Futures Trade
Imagine you believe gold prices will rise.
Gold futures contract size: 100 grams.
Current price: ₹60,000 per 10 grams → Contract value = ₹600,000.
Margin requirement: 10% = ₹60,000.
You buy one contract at ₹60,000.
If gold rises to ₹61,000 → Profit = ₹1,000 × 10 = ₹10,000.
If gold falls to ₹59,000 → Loss = ₹10,000.
A small move in price leads to large gains or losses due to leverage.
Conclusion
Futures trading is a double-edged sword – a tool of immense power for hedging and speculation, but equally capable of wiping out capital if misused. Traders must understand contract mechanics, manage leverage wisely, and apply strict risk management.
For professionals and disciplined traders, futures offer unparalleled opportunities. For careless traders, they can be disastrous.
The bottom line:
Learn the basics thoroughly.
Start small with proper risk controls.
Treat futures trading as a skill to master, not a gamble.
If used smartly, futures trading can become a gateway to financial growth and protection against market uncertainty.
Indicators & Oscillators in Trading1. Introduction
In the world of financial markets, traders are constantly searching for ways to gain an edge. While fundamental analysis looks at company earnings, news, and economic trends, technical analysis focuses on price action, patterns, and market psychology.
At the core of technical analysis lie Indicators and Oscillators. These are mathematical calculations based on price, volume, or both, designed to give traders insights into the direction, momentum, strength, or volatility of a market.
In simple words, Indicators help you see the invisible — they take raw price data and transform it into something more structured, often plotted on a chart to highlight opportunities. Oscillators, on the other hand, are a special category of indicators that move within a fixed range (like 0 to 100), helping traders identify overbought and oversold conditions.
Understanding them is crucial because they:
Improve trade timing.
Help confirm signals.
Prevent emotional decision-making.
Allow traders to recognize trends earlier.
2. What Are Indicators?
Indicators are mathematical formulas applied to a stock, forex pair, commodity, or index to make market data easier to interpret.
For example, a simple indicator is the Moving Average. It takes the average of closing prices over a set number of days and smooths out fluctuations. This makes it easier to see the underlying trend.
Indicators can be broadly categorized into two groups:
Leading Indicators – Predict future price movements.
Example: Relative Strength Index (RSI), Stochastic Oscillator.
These give signals before the trend actually changes.
Lagging Indicators – Confirm existing price movements.
Example: Moving Averages, MACD.
They follow price action and confirm that a trend has started or ended.
3. What Are Oscillators?
Oscillators are a subcategory of indicators that fluctuate within a defined range. For example, the RSI ranges from 0 to 100, while the Stochastic Oscillator ranges from 0 to 100 as well.
Traders use oscillators to identify:
Overbought conditions (when prices may be too high and due for correction).
Oversold conditions (when prices may be too low and due for a bounce).
The key difference between indicators and oscillators is that while all oscillators are indicators, not all indicators are oscillators. Oscillators usually appear in a separate window below the price chart.
4. Types of Indicators
Indicators can be classified based on their purpose:
A. Trend Indicators
These show the direction of the market.
Moving Averages (SMA, EMA, WMA)
MACD (Moving Average Convergence Divergence)
ADX (Average Directional Index)
B. Momentum Indicators
These measure the speed of price movements.
RSI (Relative Strength Index)
Stochastic Oscillator
CCI (Commodity Channel Index)
C. Volatility Indicators
These show how much prices are fluctuating.
Bollinger Bands
ATR (Average True Range)
Keltner Channels
D. Volume Indicators
These use traded volume to confirm price moves.
OBV (On-Balance Volume)
VWAP (Volume Weighted Average Price)
Chaikin Money Flow
5. Popular Indicators Explained
Let’s break down some of the most commonly used indicators:
5.1 Moving Averages
Simple Moving Average (SMA): Average of closing prices over a period.
Exponential Moving Average (EMA): Gives more weight to recent data, reacts faster.
Use: Identify trend direction, support, and resistance.
Example: If the 50-day EMA crosses above the 200-day EMA (Golden Cross), it’s a bullish signal.
5.2 MACD (Moving Average Convergence Divergence)
Consists of two EMAs (usually 12-day and 26-day).
A signal line (9-day EMA of MACD) generates buy/sell signals.
Use: Trend-following, momentum strength.
Example: When MACD crosses above signal line → Buy signal.
5.3 RSI (Relative Strength Index)
Range: 0 to 100.
Above 70 = Overbought.
Below 30 = Oversold.
Use: Identify reversals, divergence signals.
Example: RSI above 80 in a strong uptrend may still rise, so context matters.
5.4 Stochastic Oscillator
Compares a closing price to a range of prices over a period.
Range: 0 to 100.
Signals:
Above 80 = Overbought.
Below 20 = Oversold.
Special feature: Generates crossovers between %K and %D lines.
5.5 Bollinger Bands
Consist of a moving average and two standard deviation bands.
Bands expand during volatility, contract during consolidation.
Use:
Price near upper band = Overbought.
Price near lower band = Oversold.
5.6 Average True Range (ATR)
Measures volatility, not direction.
Higher ATR = High volatility.
Lower ATR = Low volatility.
Use: Set stop-loss levels, position sizing.
5.7 OBV (On-Balance Volume)
Combines price movement with volume.
Rising OBV = buyers in control.
Falling OBV = sellers in control.
6. Combining Indicators
No single indicator is perfect. Traders often combine two or more indicators to filter false signals.
Example Strategies:
RSI + Moving Average: Identify oversold conditions only if price is above the moving average (trend filter).
MACD + Bollinger Bands: Use MACD crossover as entry, Bollinger Band touch as exit.
Volume + Trend Indicator: Confirm trend direction with volume support.
7. Advantages of Using Indicators & Oscillators
Clarity – Simplifies raw data into easy-to-read signals.
Discipline – Reduces emotional trading.
Confirmation – Supports price action with mathematical evidence.
Adaptability – Works across stocks, forex, commodities, crypto.
8. Limitations
Lagging nature: Most indicators follow price, not predict it.
False signals: Especially in sideways markets.
Over-reliance: Blind faith in indicators leads to losses.
Conflicting results: Different indicators may show opposite signals.
9. Best Practices for Traders
Keep it simple: Use 2–3 reliable indicators instead of clutter.
Understand context: RSI at 80 in a strong bull run may not mean “sell.”
Combine with price action: Indicators are tools, not replacements for reading charts.
Backtest strategies: Always test on historical data before applying in live trades.
Adapt timeframe: What works in daily charts may not work in 5-minute charts.
10. Real-World Example
Suppose a trader is analyzing Nifty 50 index:
50-day EMA is above 200-day EMA → Trend is bullish.
RSI is at 65 → Market is not yet overbought.
OBV is rising → Strong buying volume.
Bollinger Bands are expanding → High volatility.
Conclusion: Strong bullish momentum. Trader may enter long with stop-loss below 200-day EMA.
Conclusion
Indicators & Oscillators are like navigation tools for traders. They don’t guarantee profits but improve decision-making, discipline, and timing. The real skill lies in knowing when to trust them, when to ignore them, and how to combine them with price action and market context.
To master them:
Learn their math and logic.
Practice on historical charts.
Combine with market structure analysis.
Keep evolving as markets change.
A professional trader treats indicators not as magical prediction machines, but as assistants in understanding market psychology.
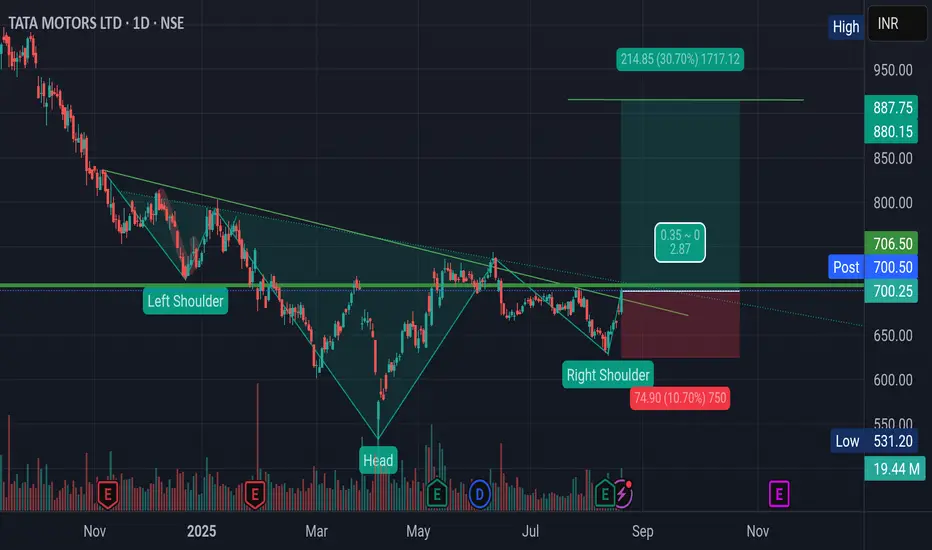
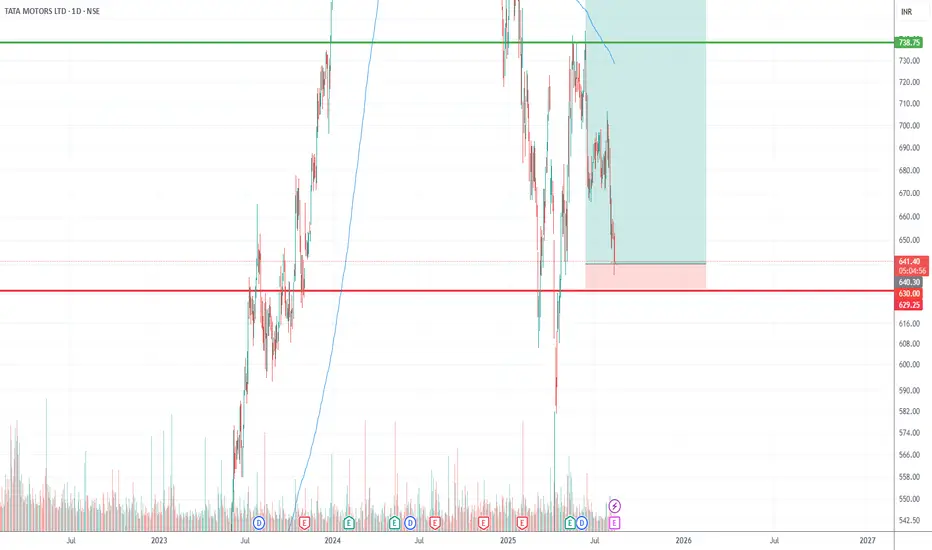
TATA MOTORS – Technical & Educational Snapshot📊 TATA MOTORS – Technical & Educational Snapshot
Ticker: NSE: TATAMOTORS | Sector: 🚗 Automobiles
CMP: ₹ ▲ (as of 20 Aug 2025)
Rating (for learning purpose): ⭐⭐⭐⭐
Pattern Observed: 📈 Channel Breakout
Tata Motors is showing strong bullish signals across multiple technical indicators. The RSI has broken out to 62, reflecting healthy buying momentum without being overbought, while the MACD remains bullish, confirming upward momentum. The SuperTrend and VWAP are both bullish, supporting the upward trend, and the CCI at 98 along with a Stochastic of 96 indicate strong near-term strength. Additionally, the Bollinger Band squeeze has released, suggesting increased volatility and a likely breakout. Altogether, these signals point toward a potential continuation of the bullish move in the near term.
Key Levels:
Resistance: 711 | 722 | 742
Support: 681 | 662 | 651
Pullback Area: 671–685
Invalidation level: 654
STWP Trade Analysis:
Entry (Long): Above 703.35
Stop Loss: 656 or below
Reference Levels: 750 | 796
⚠️ Disclaimer – Please Read Carefully
The information shared here is meant purely for learning and awareness. It is not a buy or sell recommendation and should not be taken as investment advice. I am not a SEBI-registered investment advisor, and all views expressed are based on personal study, chart patterns, and publicly available market data.
Trading — whether in stocks or options — carries risk. Markets can move unexpectedly, and losses can sometimes be larger than the money you have invested. Past performance or past setups do not guarantee future results.
If you are a beginner, treat this as a guide to understand how the market works — practice on paper trades before risking real money. If you are an experienced trader, remember to assess your own risk, position sizing, and strategy suitability before entering any trade.
Consult a SEBI-registered financial advisor before making any real trading decision.
By reading, watching, or engaging with this content, you acknowledge that you take full responsibility for your own trades and investments.
💬 Found this useful?
🔼 Give this post a Boost to help more traders discover clean, structured learning.
✍️ Drop your thoughts, questions, or setups in the comments — let’s grow together!
🔁 Share with fellow traders and beginners to spread awareness.
✅ Follow simpletradewithpatience for beginner-friendly setups, price action insights & disciplined trading content.
🚀 Stay Calm. Stay Clean. Trade With Patience.
Trade Smart | Learn Zones | Be Self-Reliant 📊

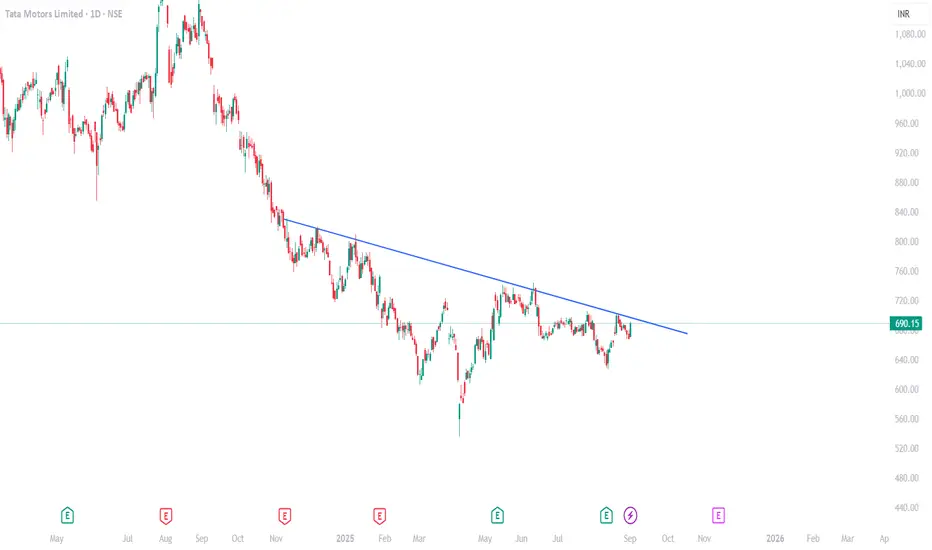
Inverted H&S Breakout in Tata MotorsMotor and electric Vehicle giant Tata Motors has given Breakout from Inverted Head and Shoulder pattern with good volume.
Once the price sustains and closes above Rs. 707. The stock should rally to its target of Rs. 880
One Should remain positive till price breaches and sustains below right Shoulder of the pattern.
The possibility of positive movement is fueled by the recent GST rate Cut possibility announced by PM modi. 👌
Also, there is positive news about fulfillment of Rare Earth Metals (very essential in EV vehicles) from China.😱
Note: This analysis is for Educational Purpose Only. Please invest after consulting a professional financial advisor.
Sustainability & ESG Investing TrendsIntroduction
Over the past two decades, the financial world has experienced a massive transformation in how investments are analyzed, structured, and valued. Traditional investment strategies focused almost exclusively on financial metrics such as revenue growth, earnings per share, P/E ratios, and cash flows. But today, a new dimension has been added: Sustainability and ESG (Environmental, Social, and Governance) investing.
Investors, institutions, governments, and even retail traders are no longer looking at financial returns in isolation. They are increasingly asking:
Is this company environmentally responsible?
How does it treat its employees and communities?
Are its governance practices transparent and ethical?
This movement is more than just a trend—it represents a structural shift in how capital is allocated globally. Sustainability and ESG investing is about aligning profits with purpose. It’s about creating wealth while ensuring that companies contribute positively to society and the planet.
In this article, we’ll explore the evolution, importance, drivers, challenges, and future of sustainability & ESG investing trends, breaking it down in an easy-to-understand and comprehensive way.
1. Understanding Sustainability & ESG
What is Sustainability Investing?
Sustainability investing refers to investment strategies that prioritize companies or assets contributing to long-term environmental and social well-being. Instead of short-term financial gains, the focus is on sustainable value creation.
What is ESG Investing?
ESG stands for:
Environmental – How a company manages its environmental impact (climate change, carbon footprint, renewable energy use, waste management).
Social – How a company treats people (employees, customers, communities, human rights).
Governance – How a company is managed (board structure, executive pay, transparency, shareholder rights).
An ESG-focused investor doesn’t just look at profit margins—they also ask: Is this company ethical? Is it sustainable in the long run?
Why ESG Matters
Climate change is now a financial risk.
Consumers prefer sustainable brands.
Regulators demand transparency.
Younger investors want purpose-driven investments.
2. Evolution of ESG & Sustainability Investing
Early Stage (1960s–1980s)
The origins can be traced back to socially responsible investing (SRI), where investors avoided “sin stocks” (alcohol, tobacco, gambling, weapons).
Religious and ethical considerations played a big role.
Growth Stage (1990s–2000s)
The 1990s saw globalization and rising awareness about corporate social responsibility.
Companies began publishing sustainability reports.
The UN launched initiatives like the Principles for Responsible Investment (PRI) in 2006.
Modern Stage (2010s–2020s)
Climate change, global warming, and social justice movements accelerated ESG awareness.
The Paris Climate Agreement (2015) reinforced global commitments to sustainability.
ESG assets under management (AUM) skyrocketed to $40+ trillion globally by 2025.
3. Key Drivers of ESG & Sustainability Investing
Climate Risks – Extreme weather, rising sea levels, and resource scarcity directly affect business operations and valuations.
Consumer Preferences – Millennials and Gen Z prefer eco-friendly and socially conscious brands.
Regulations & Policies – Governments mandate disclosures (EU’s SFDR, India’s BRSR, SEC proposals in the US).
Capital Flows – Global funds and pension plans increasingly allocate capital based on ESG scores.
Corporate Reputation – Companies with poor ESG practices face backlash, loss of trust, and higher costs.
4. Global ESG Investment Trends
Trend 1: Surge in ESG Assets
As of 2025, global ESG assets are projected to cross $50 trillion, representing nearly a third of total AUM worldwide.
Europe leads the charge, followed by North America and Asia.
Trend 2: Renewable Energy Boom
Solar, wind, and green hydrogen projects attract heavy investments.
Fossil fuel divestment is accelerating.
Trend 3: ESG ETFs & Index Funds
ESG-focused exchange-traded funds (ETFs) have exploded in popularity.
Major indices like the MSCI ESG Leaders Index guide institutional investors.
Trend 4: Technology & ESG Data
AI, blockchain, and big data help assess ESG scores more transparently.
ESG rating agencies (MSCI, Sustainalytics, Refinitiv) play a growing role.
Trend 5: Green Bonds & Sustainable Financing
Green bonds (funds raised for eco-projects) have surpassed $2 trillion issuance globally.
Social bonds and sustainability-linked loans are also gaining traction.
5. ESG in India: The Emerging Market Story
India, as one of the fastest-growing economies, is experiencing its own ESG wave.
Regulation: SEBI (Securities and Exchange Board of India) has mandated the Business Responsibility and Sustainability Report (BRSR) for top listed companies.
Investor Demand: Indian mutual funds are launching ESG-focused schemes.
Corporate Adoption: Firms like Infosys, Tata, and Wipro are global ESG leaders.
Green Finance: India issued its first sovereign green bonds in 2023.
Challenges in India:
Lack of standardized ESG reporting.
Limited awareness among retail investors.
Trade-off between growth and sustainability in a developing economy.
6. Sectoral ESG Trends
1. Energy
Fossil fuels are being replaced with renewables.
Oil & gas companies are investing in carbon capture.
2. Technology
Big tech faces scrutiny on data privacy and energy usage in data centers.
Tech firms lead in transparency reporting.
3. Banking & Finance
Banks integrate ESG into lending decisions.
Green finance and ESG loans are rising.
4. Healthcare & Pharma
Focus on ethical drug pricing, access to healthcare, and sustainable production.
5. Manufacturing
Supply chain sustainability is a big issue.
ESG compliance is crucial for exports.
7. Benefits of ESG Investing
Risk Management – ESG factors identify hidden risks (climate lawsuits, governance failures).
Long-Term Returns – ESG-compliant firms often outperform peers over the long run.
Investor Confidence – Transparency builds trust with stakeholders.
Competitive Advantage – Sustainable firms attract better talent and customers.
Global Alignment – Aligns with SDGs (UN Sustainable Development Goals).
8. Challenges in ESG Investing
Greenwashing – Companies exaggerate or falsely claim ESG compliance.
Data Inconsistency – ESG ratings differ widely across agencies.
Short-Term Costs – ESG transition requires heavy investments.
Lack of Awareness – Many retail investors still prioritize quick profits.
Policy Differences – No uniform global ESG standard.
9. Future of ESG & Sustainability Investing
Prediction 1: Stricter Regulations
Governments worldwide will enforce mandatory ESG disclosures.
Prediction 2: ESG in Emerging Markets
India, China, Brazil, and Africa will see exponential ESG adoption.
Prediction 3: Integration with Technology
AI-driven ESG scoring, blockchain-based supply chain tracking, and carbon credit markets will become mainstream.
Prediction 4: Mainstream Adoption
In the near future, ESG will not be a separate category—it will be the default way of investing.
Prediction 5: Retail ESG Investing
Just like mutual funds became mainstream, ESG-focused products will attract retail participation in India and abroad.
10. Practical Guide: How to Invest in ESG
Mutual Funds & ETFs – Invest in ESG-themed funds.
Direct Stocks – Pick companies with strong ESG ratings.
Green Bonds – Support eco-projects while earning fixed returns.
Thematic Portfolios – Build portfolios around sustainability themes (renewables, EVs, water management).
Due Diligence – Verify ESG claims; avoid greenwashing traps.
Conclusion
Sustainability & ESG investing is not a passing fad—it’s a megatrend shaping the future of finance. The world is moving towards a system where profit and purpose must co-exist.
For investors, this means:
ESG is becoming a risk management tool.
ESG compliance improves long-term performance.
Early adopters stand to benefit from the global shift in capital flows.
India, being at the cusp of massive economic growth, is perfectly positioned to ride the ESG wave. The government’s push for clean energy, digital governance, and responsible corporate practices will only accelerate this trend.
In short, the future of investing is sustainable investing. Capital is no longer blind; it is conscious, responsible, and forward-looking.

Tata Motors on the verge of breakoutTata motors looks good at current valuation for an upmove.
Disclaimer - Not a buy / sell recommendation. Do your own analysis before doing any investment.
Quarterly Results Trading in BanksIntroduction
Banking stocks hold a special place in the financial markets. Whether in India, the U.S., or any other part of the world, banks act as the backbone of the economy. Their quarterly earnings are closely tracked by investors, traders, regulators, and even policymakers because banks represent the health of credit growth, liquidity, interest rate transmission, and corporate activity.
Quarterly results trading in banks is a niche yet powerful strategy where traders position themselves before, during, or after the announcement of bank earnings. The volatility surrounding these results often creates opportunities for both short-term and swing traders. However, this is not a simple “buy on results day” strategy—success depends on understanding earnings drivers, market expectations, macroeconomic context, and technical setups.
This guide explores quarterly results trading in banks in-depth—covering how to analyze reports, predict moves, trade around volatility, and manage risks.
1. Why Bank Quarterly Results Matter
Banks are interest-rate-sensitive and macro-sensitive businesses. Their results reflect not just their own performance but also the broader economy. Let’s break down why they matter:
1.1 Indicators of Economic Health
Banks’ loan growth signals demand from businesses and consumers.
Non-Performing Assets (NPAs) show stress in corporate and retail borrowers.
Net Interest Margins (NIMs) indicate efficiency in lending vs borrowing costs.
1.2 Policy and Liquidity Sensitivity
RBI (or Fed in the U.S.) interest rate decisions directly impact banks’ earnings.
Liquidity conditions affect treasury gains/losses.
1.3 Heavyweights in Indices
In India, banks form a large chunk of Nifty 50 and Bank Nifty. Thus, quarterly results of major banks (HDFC Bank, ICICI Bank, SBI, Axis Bank, Kotak Bank) can swing the entire index.
1.4 Investor and FII Interest
Foreign Institutional Investors (FIIs) actively trade banking stocks, making them liquid and volatile during results season.
2. Anatomy of a Bank’s Quarterly Results
Unlike manufacturing or IT companies, banks have unique reporting metrics. Traders must understand these before making moves.
2.1 Key Metrics to Track
Net Interest Income (NII): Interest earned from loans minus interest paid on deposits.
Net Interest Margin (NIM): Profitability of lending.
Loan Growth: Total advances YoY and QoQ.
Deposit Growth: CASA (Current Account Savings Account) ratio is crucial.
Non-Performing Assets (NPA): Gross NPA and Net NPA indicate asset quality.
Provision Coverage Ratio (PCR): Measures buffer against bad loans.
Fee Income & Treasury Gains: Non-interest revenue streams.
Return on Assets (ROA) & Return on Equity (ROE): Profitability indicators.
2.2 Segment-Wise Performance
Retail vs Corporate lending.
Infrastructure/SME lending trends.
Digital banking adoption.
2.3 Market Expectations
Results are judged not in isolation but against analyst expectations and guidance. Example:
If HDFC Bank posts 20% profit growth but analysts expected 25%, the stock may fall.
A small improvement in NPAs can trigger a rally even if profits are flat.
3. Market Psychology Around Quarterly Results
Quarterly results trading is less about numbers and more about expectations vs reality.
3.1 Pre-Result Rally (Speculation Phase)
Traders anticipate strong/weak results and position themselves early.
Stocks often run up 5–10% before results, only to correct after the announcement (“buy the rumor, sell the news”).
3.2 Result Day Volatility
Options premiums shoot up due to high implied volatility (IV).
Directional moves are sharp but unpredictable.
3.3 Post-Result Trends
The first reaction may be wrong; big players (FIIs, mutual funds) enter gradually, leading to multi-day trends.
Example: A bank stock might dip on profit miss but later rally when analysts highlight improved asset quality.
4. Trading Strategies Around Quarterly Results
Now comes the actionable part—how traders actually make money from quarterly results.
4.1 Pre-Result Trading
4.1.1 Momentum Play
Look for stocks showing strong buildup in price and volume before results.
Example: If ICICI Bank is rising steadily with delivery-based buying, traders may ride the momentum expecting strong numbers.
4.1.2 Options Straddle/Strangle
Since results bring volatility, traders use long straddles/strangles (buying both call and put options) to benefit from big moves.
Works best if IV is not too high.
4.1.3 Sectoral Sympathy Play
If HDFC Bank posts strong results, peers like Axis and Kotak may also rally even before their results.
4.2 Result Day Trading
4.2.1 Intraday Reaction Trading
Trade the immediate move after numbers are announced.
Example: Profit beats + lower NPAs = bullish candle = intraday long.
4.2.2 Fade the Overreaction
Sometimes the market overreacts.
Example: Stock falls 4% on slightly weak profit but asset quality improved—smart traders buy the dip.
4.2.3 Options IV Crush Strategy
Results announcement causes implied volatility to collapse.
Traders can sell straddles/strangles just before results to capture premium decay.
4.3 Post-Result Trading
4.3.1 Trend Following
Strong results often lead to multi-week rallies.
Example: SBI after strong quarterly results in 2023 kept rising for weeks.
4.3.2 Analyst Upgrade/Downgrade Reaction
Monitor brokerage reports. Stocks move sharply when Goldman, CLSA, or Nomura revise targets.
4.3.3 Pair Trading
Go long on strong-result bank and short on weak-result peer.
Example: Long ICICI Bank (good results), short Kotak Bank (disappointing results).
5. Case Studies: Quarterly Results Trading in Indian Banks
5.1 HDFC Bank Q1 FY24
Profit grew 30%, NII rose strongly.
Stock initially fell due to merger concerns but rallied later as analysts upgraded.
Lesson: First-day reaction is not always final.
5.2 SBI Q3 FY23
Record profits + lowest NPAs in decades.
Stock rallied 8% in 2 days.
Lesson: Asset quality improvement drives big moves.
5.3 ICICI Bank Q2 FY23
Strong NIMs, digital growth.
Stock jumped 10% in a week, leading Bank Nifty higher.
Lesson: Market rewards consistency.
6. Risk Management in Quarterly Results Trading
6.1 Position Sizing
Never go all-in on result day. Limit exposure to 2–5% of portfolio.
6.2 Volatility Protection
Use options to hedge positions. For example, buy puts if holding large long positions.
6.3 Avoid Overtrading
Many traders burn capital chasing every tick. Results volatility is sharp; patience pays.
6.4 Macro Factors
Even if bank results are strong, global factors (Fed hikes, crude oil, FII outflows) may drag stocks down.
7. Tools and Analysis Methods
7.1 Technical Analysis
Support/Resistance Levels for pre-result positioning.
Volume Profile to track accumulation/distribution.
Candlestick Patterns post-results for confirmation.
7.2 Fundamental Analysis
Compare QoQ and YoY trends.
Peer comparison to judge relative performance.
7.3 Sentiment Analysis
Track news, social media, and analyst expectations.
7.4 Options Data
Open Interest (OI) buildup signals trader positioning.
PCR (Put-Call Ratio) indicates sentiment.
8. Opportunities & Pitfalls
8.1 Opportunities
Volatility-driven profits.
Strong trending moves after results.
Options strategies like IV crush trading.
8.2 Pitfalls
Overestimating results impact.
Ignoring macro/global triggers.
Getting trapped in whipsaws.
Holding naked option positions.
9. Quarterly Results Trading vs Other Earnings Plays
Banks: Highly macro-driven, sensitive to RBI/Fed.
IT Sector: More dependent on U.S. client spending and forex.
FMCG: Stable, less volatile.
Thus, bank results trading = high risk, high reward.
10. Long-Term Implications of Quarterly Results
While traders focus on short-term gains, quarterly results also help investors:
Identify consistent compounders like HDFC Bank or ICICI Bank.
Spot early signs of stress (like Yes Bank before its collapse).
Gauge sectoral shifts—retail vs corporate lending trends.
Conclusion
Quarterly results trading in banks is not just about reacting to numbers—it’s about interpreting expectations, economic signals, market psychology, and technical setups. The volatility around earnings gives traders multiple opportunities: pre-result speculation, result-day intraday plays, and post-result trend following.
But it is also one of the riskiest forms of trading because moves can be unpredictable. Success depends on discipline, risk management, and a balanced approach combining fundamentals with technicals.
In India, where banking stocks dominate indices like Nifty and Bank Nifty, mastering quarterly results trading can give traders a serious edge. The key is not just to chase profits but to understand the story behind the numbers.
Trading Psychology & Discipline1. What Is Trading Psychology?
Trading psychology refers to the mental and emotional aspects of trading that influence your decision-making. It’s how your mind reacts to:
Profits and losses
Winning and losing streaks
Uncertainty and market volatility
Temptation to break your rules
Two traders can have the same chart, same strategy, and same entry point — yet one will exit calmly and profitably, while the other will panic-sell at the bottom or hold a losing position too long. The difference? Mindset management.
Why It Matters:
Prevents emotional trading
Encourages rule-based decision-making
Builds resilience after losses
Allows consistent execution over years
In short, psychology determines whether your trading plan is a machine or a lottery ticket.
2. Core Psychological Biases That Hurt Traders
Even the smartest traders are vulnerable to mental shortcuts (biases) that distort judgment.
a) Loss Aversion
Losing ₹1,000 feels more painful than the joy of gaining ₹1,000.
This causes traders to hold losers too long and cut winners too early.
Example: You short Nifty futures, it moves against you by 50 points. You refuse to close, thinking “it will come back,” but it keeps falling.
Solution: Predefine your stop-loss before entering the trade.
b) Overconfidence Bias
Believing you “can’t be wrong” after a winning streak.
Leads to oversized positions, ignoring risk limits.
Example: After three profitable Bank Nifty scalps, you double your lot size, only to get stopped out instantly.
Solution: Keep position sizing rules fixed regardless of winning streaks.
c) Recency Bias
Giving too much weight to recent events, ignoring the bigger picture.
Example: Because last two trades were losses, you think your strategy “stopped working” and change it prematurely.
Solution: Judge performance over at least 20-30 trades, not 2-3.
d) FOMO (Fear of Missing Out)
Chasing entries after a move has already happened.
Example: Nifty gaps up 100 points, you jump in late — and the market reverses.
Solution: Accept that missing a trade is better than taking a bad one.
e) Anchoring Bias
Fixating on an initial price or opinion.
Example: You think Reliance “should” be worth ₹3,000 based on past data, so you keep buying dips even as fundamentals change.
Solution: Let current price action guide your bias, not past assumptions.
f) Confirmation Bias
Seeking only information that supports your existing trade idea.
Example: You’re long on TCS and only read bullish news, ignoring bearish signals.
Solution: Actively look for reasons your trade could fail.
3. The Emotional Cycle of Trading
Most traders unknowingly go through this psychological cycle repeatedly:
Optimism – You spot a setup and feel confident.
Euphoria – Trade moves in your favor, confidence peaks.
Complacency – Risk management slips.
Anxiety – Market starts reversing.
Denial – “It’s just a pullback…”
Panic – Price drops further, emotions explode.
Capitulation – Exit at the worst point.
Depression – Regret and loss of confidence.
Hope & Relief – New setup appears, cycle repeats.
Breaking this cycle requires discipline and awareness.
4. Discipline: The Backbone of Trading Success
Discipline in trading means doing what your plan says, even when your emotions scream otherwise.
Key traits:
Following entry & exit rules
Respecting stop-losses without hesitation
Avoiding overtrading
Sticking to position size limits
Logging and reviewing trades regularly
Why It’s Hard:
Because discipline often requires you to act against your instincts. Your brain is wired to avoid pain and seek pleasure — but trading sometimes demands taking small losses (pain) to protect against bigger ones, and resisting impulsive wins (pleasure) for long-term gains.
5. Mental Frameworks of Top Traders
a) Probabilistic Thinking
Each trade is just one outcome in a series of many.
Win rate and risk-reward ratio matter more than any single trade.
b) Process Over Outcome
Judge success by how well you followed your plan, not whether you made money that day.
c) Emotional Neutrality
Avoid becoming too euphoric on wins or too crushed by losses.
d) Long-Term Mindset
Focus on yearly consistency, not daily fluctuations.
6. Daily Habits for Psychological Resilience
Pre-Market Routine
Review economic calendar, market trends, and your trade plan.
Mental rehearsal: visualize sticking to stops and targets.
In-Trade Mindfulness
Avoid checking P&L every few seconds.
Focus on chart patterns, not emotions.
Post-Market Review
Journal every trade: entry, exit, reason, emotion, lesson.
Physical Health
Good sleep, hydration, exercise — all improve decision-making.
7. Practical Tools to Develop Discipline
Trading Journal – Document trades and emotions.
Checklists – Verify setups before entry.
Alarms & Alerts – Avoid staring at charts unnecessarily.
Automation – Use bracket orders to enforce stops.
Accountability Partner – Share your trade plan with someone who will question you if you deviate.
8. Common Psychological Traps & Fixes
Trap Example Fix
Revenge Trading Doubling size after loss Take mandatory cooldown break
Overtrading Taking random trades Set daily trade limit
Analysis Paralysis Too many indicators Stick to 1–3 core setups
Performance Pressure Forcing trades to meet target Focus on A+ setups only
9. A Complete Psychological Training Plan
Here’s a 4-week discipline-building plan you can use:
Week 1 – Awareness
Keep a real-time emotion log.
Identify when you break rules.
Week 2 – Rule Reinforcement
Write your trading plan in detail.
Keep it visible while trading.
Week 3 – Controlled Exposure
Trade smaller lot sizes to reduce fear.
Focus purely on execution quality.
Week 4 – Review & Adjust
Analyze mistakes.
Create a “Rule Violation Penalty” (e.g., paper trade next session).
Repeat the cycle until discipline becomes second nature.
10. Final Thoughts
You can have the best technical strategy in the world, but if your psychology is fragile and your discipline weak, the market will expose you.
Think of trading psychology as mental risk management — without it, capital risk management won’t save you.
Mastering this area won’t just improve your trades, it will improve your confidence, patience, and ability to thrive in any high-pressure decision-making environment.
Institutional Trading 1. Introduction – What Is Institutional Trading?
Institutional trading refers to the buying and selling of large volumes of financial instruments (like stocks, bonds, commodities, derivatives, currencies) by big organizations such as banks, mutual funds, hedge funds, pension funds, sovereign wealth funds, and insurance companies.
Unlike retail traders — who might buy 100 shares of a stock — institutional traders may buy millions of shares in a single transaction, or place orders worth hundreds of millions of dollars. Their size, resources, and market influence make them the primary drivers of global market liquidity.
Key points:
In most markets, institutional trading accounts for 70–90% of total trading volume.
Institutions often operate with special access, better pricing, and faster execution than retail investors.
Their trades are usually strategic and long-term (but not always; some institutions also do high-frequency trading).
2. Who Are the Institutional Traders?
The word institution covers a wide range of market participants. Let’s look at the main categories:
2.1 Mutual Funds
Pool money from retail investors and invest in diversified portfolios.
Focus on long-term investments in equities, bonds, or mixed assets.
Examples: Vanguard, Fidelity, HDFC Mutual Fund, SBI Mutual Fund.
2.2 Pension Funds
Manage retirement savings for employees.
Have very large capital pools (often billions of dollars).
Invest with a long horizon but still adjust portfolios for risk and return.
Examples: Employees' Provident Fund Organisation (EPFO) in India, CalPERS in the US.
2.3 Hedge Funds
Private investment partnerships targeting high returns.
Use aggressive strategies like leverage, derivatives, and short selling.
Often more secretive and flexible in trading.
Examples: Bridgewater Associates, Renaissance Technologies.
2.4 Sovereign Wealth Funds (SWFs)
Government-owned investment funds.
Invest in global assets for long-term national wealth preservation.
Examples: Abu Dhabi Investment Authority, Government Pension Fund of Norway.
2.5 Insurance Companies
Invest premium income to meet long-term policy payouts.
Prefer stable, income-generating investments (bonds, blue-chip stocks).
2.6 Investment Banks & Proprietary Trading Desks
Trade for their own accounts (proprietary trading) or on behalf of clients.
Engage in block trades, mergers & acquisitions facilitation, and market-making.
3. Key Characteristics of Institutional Trading
3.1 Large Trade Sizes
Institutional orders are huge, often worth millions.
Example: Buying 5 million shares of Reliance Industries in a single day.
3.2 Special Market Access
They often trade through dark pools or private networks to hide their intentions.
Use direct market access (DMA) for speed and control.
3.3 Sophisticated Strategies
Strategies often use quantitative models, fundamental analysis, and macroeconomic research.
Incorporate risk management and hedging.
3.4 Regulatory Oversight
Institutional trades are monitored by regulators (e.g., SEBI in India, SEC in the US).
Large holdings or trades must be disclosed in some jurisdictions.
4. Trading Venues for Institutions
Institutional traders do not only use public exchanges. They have multiple platforms:
Public Exchanges – NSE, BSE, NYSE, NASDAQ.
Dark Pools – Private exchanges that hide order details to reduce market impact.
OTC Markets – Direct deals between parties without exchange listing.
Crossing Networks – Match buy and sell orders internally within a broker.
5. Institutional Trading Strategies
Institutional traders use a mix of manual and algorithmic approaches. Here are some common strategies:
5.1 Block Trading
Executing very large orders in one go.
Often done off-exchange to avoid price slippage.
Example: A mutual fund buying ₹500 crore worth of Infosys shares in a single block deal.
5.2 Program Trading
Buying and selling baskets of stocks based on pre-set rules.
Example: Index rebalancing for ETFs.
5.3 Algorithmic & High-Frequency Trading (HFT)
Computer algorithms execute trades in milliseconds.
Reduce market impact, optimize timing.
5.4 Arbitrage
Exploiting price differences in different markets or instruments.
Example: Buying Nifty futures on SGX while shorting them in India if pricing diverges.
5.5 Market Making
Providing liquidity by continuously quoting buy and sell prices.
Earn from the bid-ask spread.
5.6 Event-Driven Trading
Trading based on corporate actions (mergers, acquisitions, earnings announcements).
6. The Role of Technology
Institutional trading has transformed with technology:
Low-latency trading infrastructure for speed.
Smart Order Routing (SOR) to find best execution prices.
Data analytics & AI for predictive modeling.
Risk management systems to control exposure in real-time.
7. Regulatory Environment
Regulation ensures that large players don’t unfairly manipulate markets:
India (SEBI) – Monitors block trades, insider trading, and mutual fund disclosures.
US (SEC, FINRA) – Requires reporting of institutional holdings (Form 13F).
MiFID II (Europe) – Improves transparency in institutional trading.
8. Advantages Institutions Have Over Retail Traders
Lower transaction costs due to volume discounts.
Better research teams and data access.
Advanced execution systems to reduce slippage.
Liquidity access even in large trades.
9. Disadvantages & Challenges for Institutions
Market impact risk – Large trades can move prices against them.
Slower flexibility – Committees and risk checks delay quick decision-making.
Regulatory restrictions – More compliance burden.
10. Market Impact of Institutional Trading
Institutional trading shapes the market in multiple ways:
Liquidity creation – Large orders provide continuous buying/selling interest.
Price discovery – Their research and trades help set fair prices.
Volatility influence – Bulk exits or entries can cause sharp moves.
Final Thoughts
Institutional trading is the engine of modern financial markets. It drives liquidity, shapes price movements, and often sets the tone for market sentiment. For retail traders, understanding institutional behavior is crucial — because following the “smart money” often gives an edge.
If you want, I can also create a visual “Institutional Trading Flow Map” showing how orders move from an institution to the market, including exchanges, dark pools, and clearinghouses — it would make this 3000-word explanation more practical and easier to visualize.
Global Macro Trading1. Introduction to Global Macro Trading
Global macro trading is like playing chess on a planetary board.
Instead of just focusing on a single company or sector, you’re watching how the entire world economy moves—tracking interest rates, currencies, commodities, geopolitical tensions, and policy changes—then placing trades based on your macroeconomic outlook.
At its core:
“Macro” = Large-scale economic factors
Goal = Profit from broad market moves triggered by these factors.
It’s the domain where George Soros famously “broke the Bank of England” in 1992 by shorting the pound, and where hedge funds like Bridgewater use economic cycles to decide positions.
2. The Philosophy Behind Global Macro
The idea is simple: economies move in cycles—boom, slowdown, recession, recovery.
These cycles are driven by:
Interest rates
Inflation & deflation
Government policies
Trade balances
Currency strength/weakness
Geopolitical events
Global macro traders seek to anticipate big shifts—not just day-to-day noise—and bet accordingly.
The moves are often multi-asset: FX, commodities, equities, and bonds all come into play.
3. Key Tools of the Global Macro Trader
Global macro traders don’t just glance at charts—they build a full “global dashboard” of indicators.
A. Economic Data
GDP Growth Rates – Signs of expansion or contraction.
Inflation – CPI, PPI, and core inflation measures.
Employment data – Non-farm payrolls (US), unemployment rates.
Purchasing Managers Index (PMI) – Early signal of economic health.
Consumer Confidence – Sentiment as a leading indicator.
B. Central Bank Policy
Interest Rate Changes – Fed, ECB, BoJ, RBI decisions.
Quantitative Easing/Tightening – Money supply adjustments.
Forward Guidance – Central bank speeches hinting future moves.
C. Market Sentiment
VIX (Volatility Index)
COT (Commitment of Traders) reports
Currency positioning data
D. Geopolitical Risks
Wars, sanctions, trade disputes.
Elections in major economies.
Energy supply disruptions.
4. Core Instruments Used in Global Macro
Global macro traders use multiple asset classes because economic trends ripple across markets.
Currencies (FX) – Betting on relative strength between nations.
Example: Shorting the yen if Japan keeps rates ultra-low while the US hikes.
Government Bonds – Positioning for rising or falling yields.
Example: Buying US Treasuries in risk-off conditions.
Equity Indices – Long or short entire markets.
Example: Shorting the FTSE 100 if UK recession fears rise.
Commodities – Crude oil, gold, copper, agricultural goods.
Example: Long gold during geopolitical instability.
Derivatives – Futures, options, and swaps to hedge or leverage.
5. Styles of Global Macro Trading
Global macro is not one-size-fits-all. Traders pick different timeframes and strategies.
A. Discretionary Macro
Human-driven decision-making.
Uses news, analysis, and gut instinct.
Pros: Flexibility in unusual events.
Cons: Subjective, emotional bias risk.
B. Systematic Macro
Algorithmic, rules-based.
Uses historical correlations, signals.
Pros: Discipline, backtesting possible.
Cons: May miss sudden regime changes.
C. Event-Driven Macro
Trades around specific catalysts.
Examples: Brexit vote, OPEC meeting, US elections.
D. Thematic Macro
Focuses on big themes over months or years.
Example: Betting on long-term dollar weakness due to US debt growth.
6. Fundamental Analysis in Macro
Here’s how a macro trader might think:
Example: US Interest Rates Rise
USD likely strengthens (carry trade appeal).
US Treasuries yields rise → prices fall.
Emerging market currencies weaken (capital flows to USD).
Gold may fall as yield-bearing assets look more attractive.
The chain reaction thinking is key—every macro event has a ripple effect.
7. Technical Analysis in Macro
While fundamentals set the direction, technicals help with timing.
Moving Averages – Identify trend direction.
Breakouts & Support/Resistance – Confirm market shifts.
Fibonacci Levels – Gauge pullback/reversal zones.
Volume Profile – See where major players are active.
Intermarket Correlation Charts – Compare FX, bonds, and commodities.
8. Risk Management in Macro Trading
Macro trades can be big winners—but also big losers—because they often involve leverage.
Key principles:
Never risk more than 1–2% of capital on a single trade.
Diversify across asset classes.
Use stop-loss orders.
Hedge positions (e.g., long oil but short an oil-sensitive currency).
9. Examples of Historical Macro Trades
A. Soros & the Pound (1992)
Bet: UK pound overvalued in the ERM.
Action: Shorted GBP heavily.
Result: £1 billion profit in one day.
B. Paul Tudor Jones & 1987 Crash
Used macro signals to foresee stock market collapse.
Went short S&P 500 futures.
C. Oil Spike 2008
Many traders went long crude as supply fears rose and USD weakened.
10. The Global Macro Trading Process
Macro Research
Economic releases, policy trends, historical cycles.
Hypothesis Building
Example: “If the Fed keeps rates high while ECB cuts, EUR/USD will fall.”
Instrument Selection
Pick the cleanest trade (FX, bonds, commodities).
Position Sizing
Based on risk tolerance and conviction.
Execution & Timing
Use technicals for entry/exit.
Monitoring
Constantly reassess as data comes in.
Exit Strategy
Profit targets and stop-losses in place.
Final Takeaways
Global macro trading is the Formula 1 of financial markets—fast, complex, and requiring mastery of multiple disciplines.
Success depends on:
Staying informed.
Thinking in cause-and-effect chains.
Managing risk religiously.
Being adaptable to changing regimes.
A disciplined global macro trader can profit in bull markets, bear markets, and everything in between—because they’re not tied to one asset or region.
Instead, they follow the money and the momentum wherever it flows.
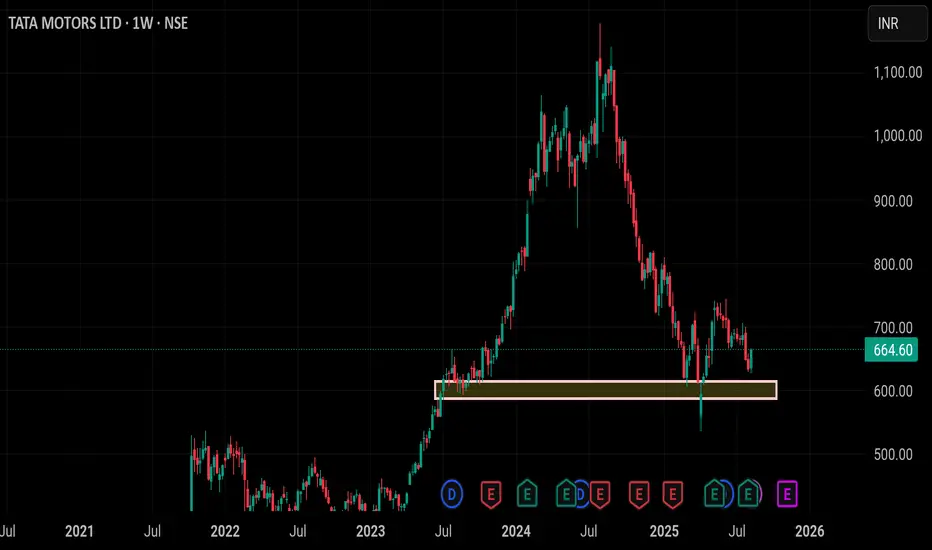
Tata Motos ltdTATA MOTORS LTD – Weekly Chart Analysis (For Learning Purpose Only)
(This analysis is only for educational purposes and is not any kind of investment advice)
-Chart Overview
The screenshot shows TATA MOTORS weekly chart with a Descending Trendline (red dashed line) and an Ascending Channel (blue lines).
The price is currently testing the channel support area.
🧭 1. Trend Analysis
Long-Term Trend: Continuous decline since the 2022 top, but attempting a reversal since 2023.
Short-Term Trend: Selling pressure from the recent high (correction phase).
📈 2. Chart Pattern
Ascending Channel Breakdown Risk:
Price is near the lower trendline of the channel, and a breakdown could lead to a sharp fall.
Bearish Flag Possibility:
After the previous down move, a small uptrend channel has formed, which could act as a bearish flag if broken.
📉 3. Key Levels
Level (₹) Type Description
1,065.60 🔺 Major Resistance Top of the downtrend
921.20 🔺 Secondary Resistance Recent swing high
723.05 🔺 Minor Resistance Support before breakdown
635.45 ⚠️ Current Price Near channel support
593.00 🛑 Support Price bounce zone
490.25 🔻 Critical Support Break below could lead more declinw
🧠 4. Possible Scenarios
Scenario 1 – Support Holds:
If price bounces from ₹635–₹593 support zone, a move towards ₹723–₹921 is possible.
Scenario 2 – Support Breaks:
If price sustains below ₹593, it could open the path for a fall towards ₹490.
⚠️ Disclaimer
This analysis is only for educational and learning purposes.
It is not an investment or trading advice.
Stock market investing is risky – please consult a SEBI-registered financial advisor before making any decisions.
#StockMarket #TechnicalAnalysis #TataMotors #PriceAction #TradingView #ChartAnalysis #LearningPurpose #StockMarketEducation #NoInvestmentAdvice

Tata MotorsWeekly charts have been more reliable.
Tata motors is now following a cup and handle pattern and taking retracement at a support 480
big buy deal with reversal at 480

Super Cycle Outlook 1. Introduction: What is a Super Cycle?
In finance, economics, and commodities, a Super Cycle refers to an extended period—often lasting 10–30 years—where prices, demand, and economic activity move in a persistent trend, far exceeding normal business cycles. While a typical business cycle might last 5–7 years, a super cycle is a generational trend, driven by major structural shifts such as industrial revolutions, demographic waves, or technological breakthroughs.
Examples from history:
Post-World War II (1945–1970s): Rapid industrial growth, infrastructure expansion, and consumerism boom in developed economies.
China-led Commodity Super Cycle (2000–2011): Urbanization, manufacturing, and infrastructure spending drove massive demand for oil, steel, copper, and other raw materials.
Tech & Digital Transformation Cycle (2010s–present): Dominance of Big Tech, e-commerce, and AI-powered business models.
Super cycles are not just price phenomena—they reshape industries, alter capital flows, and redefine economic power structures.
2. Core Drivers of Super Cycles
Super cycles arise when several mega-drivers align, creating self-reinforcing growth trends. Let’s break down the key factors:
A. Structural Demand Shifts
These occur when large populations enter new phases of economic activity.
Urbanization: Hundreds of millions moving from rural to urban living demand housing, infrastructure, and energy.
Industrialization: Nations building factories, transportation networks, and power grids.
Middle-Class Expansion: Rising disposable income drives demand for consumer goods, travel, and technology.
B. Technological Breakthroughs
Tech revolutions can create entirely new markets:
19th century: Steam engines, mechanized manufacturing.
20th century: Mass production, automobiles, airplanes.
21st century: Artificial Intelligence, quantum computing, renewable energy, biotech.
C. Demographic Dynamics
Generations with peak spending habits drive economic surges.
Baby boomers in the 1980s–2000s drove housing and stock markets.
Millennials and Gen Z are now entering prime income years, fueling e-commerce, green tech, and experience-based consumption.
D. Capital Cycle & Investment Flow
High profits attract more investment, which then fuels expansion:
Commodities: Higher prices → more mining → more supply → eventual cycle cooling.
Technology: VC funding surges create rapid innovation waves.
E. Geopolitical Realignments
Wars, alliances, trade deals, and new economic blocs can redirect global capital and supply chains.
Example: U.S.–China trade tensions leading to regionalization of manufacturing.
3. The Commodity Super Cycle Outlook (2025–2040)
Historically, commodity super cycles are the most famous because they are visible in price charts for oil, metals, and agriculture. We may now be entering another commodity upcycle—but with unique twists.
A. Energy Transition Impact
The shift to renewables and electrification is not reducing commodity demand—it’s changing its composition.
Copper, Lithium, Cobalt, Nickel: EV batteries, wind turbines, and solar panels require huge quantities.
Uranium: Nuclear is making a comeback as a stable, low-carbon energy source.
Natural Gas: Still vital as a transition fuel in developing economies.
B. Supply-Side Constraints
Years of underinvestment in mining and exploration mean supply cannot ramp up quickly.
Example: New copper mines take 7–10 years from discovery to production.
Tight supply + surging green tech demand = structural price support.
C. Agricultural Commodities
Climate change, water scarcity, and geopolitical disruptions will create volatile but upward-biased food prices.
Wheat, soybeans, and rice could see sustained demand from both population growth and biofuel usage.
D. Oil’s Role
Even as renewables rise, oil demand is unlikely to collapse before 2035, especially in aviation, shipping, and petrochemicals. Expect volatility rather than a straight decline.
4. Equity Market Super Cycle
While commodities are tangible, equity markets follow capital allocation cycles driven by innovation, corporate earnings, and liquidity conditions.
A. Sector Rotation in Super Cycles
In long bull runs, leadership shifts:
Early Stage: Industrial, infrastructure, raw materials.
Mid Stage: Consumer discretionary, technology.
Late Stage: Healthcare, utilities, defensive stocks.
B. Current Trends
AI & Automation: Transforming everything from manufacturing to medicine.
Green Infrastructure: EVs, renewable energy, smart grids.
Healthcare Innovation: Gene therapy, biotech breakthroughs.
Space Economy: Satellite communications, asteroid mining prospects.
C. Valuation Implications
In super cycles, traditional valuation metrics can appear “expensive” for years because the growth trajectory outpaces mean reversion. This is why Amazon looked overpriced in 2003 yet became a trillion-dollar company.
5. Currency & Bond Market Super Cycles
Super cycles don’t only exist in stocks and commodities—currencies and interest rates also follow decades-long patterns.
A. Dollar Dominance Cycle
The U.S. dollar has been in a strong phase since 2011, but long-term cycles suggest eventual weakening as:
Global trade diversifies into multiple reserve currencies.
Countries build gold reserves and adopt regional settlement systems.
B. Bond Yield Super Cycle
From the 1980s to 2021, we saw a 40-year bond bull market (falling yields). The post-pandemic inflation shock may have ended that era, introducing a multi-decade rising yield environment.
6. Risks to the Super Cycle Thesis
While the long-term trend may be upward, super cycles are never smooth.
A. Policy & Regulatory Risks
Sudden tax changes, carbon pricing, or export bans can disrupt markets.
B. Technological Substitution
If a breakthrough makes a key commodity obsolete, demand can collapse (e.g., silver in photography after digital cameras).
C. Geopolitical Shocks
Wars, sanctions, or alliances can reroute supply chains overnight.
D. Overinvestment Phase
Every super cycle eventually attracts excessive capital, creating oversupply and price crashes.
7. How Traders & Investors Can Position for the Next Super Cycle
Super cycles are macro trends, but you can position tactically within them.
A. Long-Term Portfolio Strategy
Core Holdings: ETFs tracking commodities, infrastructure, renewable energy.
Thematic Plays: AI, green tech, water scarcity solutions.
Geographic Diversification: Exposure to emerging markets benefiting from industrialization.
B. Short-to-Mid Term Tactical Moves
Use sector rotation strategies to capture leadership changes.
Apply volume profile & market structure analysis to time entries/exits.
Hedge with options during cyclical downturns within the super cycle.
C. Risk Management
Even in super cycles, corrections of 20–40% can occur. Long-term vision doesn’t remove the need for stop-losses, position sizing, and diversification.
8. 2025–2040 Super Cycle Scenarios
Let’s break down three possible paths:
Scenario 1: The Green Tech Boom (Base Case)
Renewables, EVs, and AI adoption drive industrial demand.
Commodity prices rise steadily with periodic volatility.
Equity markets see leadership in tech, clean energy, and industrial automation.
Scenario 2: Multipolar Commodity War
Geopolitical fragmentation leads to resource nationalism.
Prices for critical minerals spike due to supply disruptions.
Defense, cybersecurity, and energy independence sectors outperform.
Scenario 3: Tech Deflation Shock
Breakthrough in fusion energy or material science drastically reduces resource needs.
Commodity prices fall, but equity markets soar from cheap energy and productivity gains.
9. Historical Lessons for Today’s Investors
Don’t fight the trend: Super cycles can defy conventional valuation logic.
Expect mid-cycle pain: Corrections are part of the journey.
Follow capital expenditure trends: Where companies are investing heavily today often signals the growth engine of tomorrow.
Watch policy shifts: Governments can accelerate or derail super cycles.
10. Conclusion
The Super Cycle Outlook for 2025–2040 is being shaped by the most powerful combination of forces in decades:
The global energy transition
AI-driven productivity
Geopolitical restructuring
Demographic shifts in emerging markets
This era will be defined by both opportunity and volatility. The winners will be those who can see past short-term noise, align with structural trends, and adapt tactically when the inevitable cyclical setbacks occur.
In short: Think decades, act in years, trade in months. That’s how you navigate a super cycle.
Tata Motors – Long SetupTata Motors – Long Setup 🚗📈
CMP: ₹641–642
Target 1: ₹735+
Target 2: ₹825+
Target 3: ₹1000+
Stop Loss: Below ₹630 (closing basis)
Risk–Reward: ~1:35 – Exceptional setup!
Technical Analysis vs Fundamental AnalysisIntroduction
In the world of trading and investing, two dominant schools of thought guide decision-making: technical analysis and fundamental analysis. Both methodologies aim to forecast future price movements, but they differ significantly in philosophy, approach, tools, and time horizons.
This detailed article offers a side-by-side comparison of technical and fundamental analysis, exploring their foundations, tools, advantages, limitations, and how modern traders often use a hybrid approach to gain an edge in the markets.
1. Definition and Core Philosophy
Technical Analysis (TA)
Definition: Technical analysis is the study of past market data—primarily price and volume—to forecast future price movements.
Philosophy:
All known information is already reflected in the price.
Prices move in trends.
History tends to repeat itself.
TA focuses on identifying patterns and signals within charts and market data to predict price action, independent of the company’s fundamentals.
Fundamental Analysis (FA)
Definition: Fundamental analysis involves evaluating a security's intrinsic value by examining related economic, financial, and qualitative factors.
Philosophy:
Every asset has an inherent (fair) value.
Market prices may deviate from intrinsic value in the short term but will eventually correct.
Long-term returns are driven by the health and performance of the underlying asset.
FA dives into financial statements, management quality, industry dynamics, macroeconomic factors, and more to decide if a security is overvalued or undervalued.
2. Key Objectives
Aspect Technical Analysis Fundamental Analysis
Primary Goal Predict short-to-medium term price moves Assess long-term value and growth potential
Trader Focus Entry and exit timing Business quality, profitability
Time Horizon Short-term (minutes to weeks) Medium to long-term (months to years)
3. Tools and Techniques
Technical Analysis Tools
Price Charts: Line, bar, and candlestick charts
Indicators & Oscillators:
Moving Averages (MA)
Relative Strength Index (RSI)
MACD (Moving Average Convergence Divergence)
Bollinger Bands
Stochastic Oscillator
Chart Patterns:
Head and Shoulders
Double Top/Bottom
Triangles (ascending, descending)
Flags and Pennants
Volume Analysis: Analyzing the strength of price movements
Support and Resistance Levels
Trend Lines and Channels
Price Action & Candlestick Patterns:
Doji
Hammer
Engulfing patterns
Fundamental Analysis Tools
Financial Statements:
Income Statement
Balance Sheet
Cash Flow Statement
Financial Ratios:
P/E (Price to Earnings)
P/B (Price to Book)
ROE (Return on Equity)
Current Ratio
Debt to Equity
Earnings Reports
Economic Indicators:
GDP growth
Inflation
Interest rates
Employment data
Industry & Competitive Analysis
Management Evaluation
Valuation Models:
Discounted Cash Flow (DCF)
Dividend Discount Model (DDM)
Residual Income Model
4. Approach to Market Behavior
Technical Analysts Believe:
Market psychology drives price patterns.
Prices reflect supply and demand, fear and greed.
“The trend is your friend.”
Fundamental Analysts Believe:
Markets are inefficient in the short run.
Understanding business fundamentals offers a long-term edge.
“Buy undervalued assets and wait for the market to realize their value.”
5. Advantages and Strengths
Advantages of Technical Analysis:
Effective for short-term trading.
Useful across all markets: stocks, forex, crypto, commodities.
Provides clear entry/exit points.
Applicable even when fundamental data is limited or irrelevant (e.g., cryptocurrencies).
Can be automated (quant systems, bots, algo-trading).
Advantages of Fundamental Analysis:
Helps identify long-term investment opportunities.
Backed by real data and financial metrics.
Focus on intrinsic value, reducing speculative risk.
Allows understanding of economic cycles, company health, and competitive advantage.
Strong foundation for value investing and dividend strategies.
6. Limitations and Criticisms
Limitations of Technical Analysis:
Can produce false signals in choppy markets.
Heavily reliant on pattern recognition, which can be subjective.
Assumes past price behavior repeats, which may not always hold.
May lead to overtrading.
Less effective in fundamentally driven markets (e.g., news-based volatility).
Limitations of Fundamental Analysis:
Time-consuming and data-intensive.
Less effective for timing entries/exits.
Assumptions in valuation models can be inaccurate.
Markets can remain irrational longer than a trader can remain solvent.
Difficult to apply in short-term trading scenarios.
7. Use in Different Market Conditions
Market Condition Technical Analysis Fundamental Analysis
Trending Market Very effective (trend following) May be slow to react
Sideways Market Can be misleading (whipsaws) Waits for fundamental triggers
News-Driven Volatilit Less reliable; news invalidates patterns Analyzes long-term implications of the news
Earnings Season High volatility useful for trades Critical time to revalue investments
8. Real-World Examples
Technical Analysis Example:
A trader observes a bullish flag on Reliance Industries’ chart. They enter a long trade expecting a breakout with a defined stop loss below the flag's support. No attention is paid to quarterly results or business updates.
Fundamental Analysis Example:
An investor evaluates Infosys’ fundamentals. Despite a recent dip in price due to market panic, the investor buys after analyzing strong balance sheets, healthy cash flow, and consistent dividends.
9. Types of Traders and Investors
Type Likely to Use
Scalper Purely technical analysis
Day Trader Mostly technical analysis
Swing Trader Technical with some fundamental awareness
Position Trader Blend of both
Investor Mostly fundamental analysis
Quant Trader TA-based systems, machine learning models
10. Integration: The Hybrid Approach
In the modern market landscape, many traders and investors adopt a hybrid approach, combining the strengths of both TA and FA. This dual strategy provides:
Better timing for fundamentally driven trades.
Deeper conviction in technically identified setups.
Risk reduction by filtering out weak stocks fundamentally.
Example: A swing trader scans for technically strong patterns in fundamentally sound stocks. They avoid penny stocks or overly leveraged companies, no matter how bullish the chart looks.
Smart Liquidity 1. Introduction: The Evolution of Liquidity
Liquidity is the lifeblood of financial markets. It allows assets to be bought and sold efficiently, ensuring price discovery and market stability. In traditional markets, liquidity is provided by centralized exchanges and institutional market makers. However, with the rise of digital assets, decentralized finance (DeFi), and advanced market analytics, a new paradigm has emerged: Smart Liquidity.
Smart liquidity refers to dynamic, data-driven, and automated systems that intelligently provide, manage, and optimize liquidity across trading environments. These systems operate in both centralized and decentralized contexts and are increasingly critical in high-frequency trading, DeFi protocols, algorithmic execution, and risk management.
2. The Traditional View of Liquidity
Before understanding what makes liquidity “smart,” we need to understand how traditional liquidity functions:
2.1 Key Types of Liquidity
Market Liquidity: The ability to quickly buy/sell an asset without significantly affecting its price.
Funding Liquidity: The ease with which traders can access capital to maintain positions.
Order Book Liquidity: The depth and spread of buy/sell orders at different price levels.
2.2 Role of Market Makers
In traditional markets, liquidity is largely provided by market makers — firms that post both buy and sell orders to profit from the bid-ask spread while ensuring the market remains active.
2.3 Limitations
High latency and slippage
Centralized control and opacity
Inflexibility during volatility
Capital inefficiency (idle funds)
3. The Need for Smart Liquidity
Modern markets are becoming more fragmented, automated, and data-intensive. This has created the need for a smarter, more adaptive form of liquidity. Here's why:
Decentralized Finance (DeFi) lacks centralized market makers.
High-frequency trading (HFT) demands millisecond-level execution.
Liquidity fragmentation across exchanges reduces capital efficiency.
Risk-sensitive environments need real-time capital allocation.
Smart liquidity offers automated, algorithmic, real-time solutions that adapt to market conditions and improve liquidity provisioning across platforms.
4. Defining Smart Liquidity
Smart Liquidity is the use of data science, AI/ML algorithms, automated protocols, and blockchain mechanisms to efficiently manage, allocate, and provide liquidity in dynamic trading environments.
It encompasses:
Smart Order Routing
Algorithmic Market Making (AMM)
On-chain Liquidity Pools
Flash Loans and Arbitrage Bots
Cross-chain Liquidity Bridges
AI-driven Liquidity Mining
Real-Time Volume & Volatility-Based Liquidity Adjustment
5. Core Components of Smart Liquidity Systems
5.1 Smart Order Routing (SOR)
Finds the best price across multiple venues (CEXs and DEXs).
Breaks orders intelligently to minimize slippage.
Enables volume-weighted execution across fragmented markets.
5.2 Algorithmic Market Making
Unlike human market makers, AMMs use mathematical formulas to determine prices.
Popular in DeFi platforms like Uniswap, Balancer, and Curve.
Examples:
Uniswap v2 uses a constant product formula: x * y = k.
Uniswap v3 introduces concentrated liquidity, letting LPs provide liquidity in custom price ranges.
5.3 On-Chain Liquidity Pools
Smart contracts that hold funds for automatic swaps.
Provide decentralized access to liquidity.
Liquidity providers earn fees and token rewards.
5.4 Flash Loans and Arbitrage Bots
Provide instantaneous liquidity for arbitrage or liquidation.
Can balance prices across DEXs within seconds.
Require no collateral if repaid within the same transaction block.
5.5 Liquidity Bridges
Enable cross-chain transfers of liquidity (e.g., Ethereum ↔ Solana).
Essential for a multichain DeFi ecosystem.
Smart liquidity bridges include Synapse, Multichain, and LayerZero.
5.6 AI-Driven Liquidity Management
Predictive analytics to deploy liquidity where demand is rising.
Machine learning models assess trading volume, volatility, and user behavior.
Enables auto-rebalancing and capital optimization.
6. Smart Liquidity in DeFi: The Game-Changer
Decentralized Finance (DeFi) has redefined how liquidity is created and accessed. Smart liquidity protocols eliminate intermediaries and allow anyone to become a liquidity provider (LP).
6.1 How AMMs Revolutionized Liquidity
Traditional order books are replaced by liquidity pools.
Users swap assets directly from pools.
Prices are set algorithmically based on pool balances.
6.2 Key Platforms
Platform Smart Liquidity Feature
Uniswap v3 Concentrated liquidity, range orders
Curve Finance Efficient swaps for stablecoins
Balancer Multiple tokens per pool with custom weightings
PancakeSwap AMM for Binance Smart Chain
dYdX Decentralized perpetual trading with smart liquidity
6.3 Incentives for LPs
Trading fees
Liquidity mining rewards
Governance tokens (e.g., UNI, CRV)
7. Smart Liquidity in Centralized Markets
Even centralized exchanges and institutions use smart liquidity tools.
7.1 Institutional Smart Liquidity Solutions
Dark Pools: Hidden order books to reduce market impact.
Execution Algorithms: TWAP, VWAP, Iceberg Orders, etc.
Smart Execution Management Systems (EMS): Integrate data feeds, real-time news, and order flow analytics.
7.2 Proprietary Trading Firms
Use AI models to:
Predict order book imbalance.
Automate market making.
React to news in milliseconds.
8. Risks and Challenges
Despite its potential, smart liquidity systems have their own vulnerabilities:
8.1 Impermanent Loss
Occurs in AMMs when price divergence between tokens in a pool leads to unrealized losses.
8.2 Smart Contract Risks
Bugs or hacks in DeFi protocols can lead to loss of funds.
8.3 Front-running and MEV (Miner Extractable Value)
Bots exploit transaction ordering for profit.
Can lead to unfair trading conditions.
8.4 Liquidity Fragmentation
Cross-chain systems may split liquidity across protocols, reducing efficiency.
8.5 Regulatory Uncertainty
DeFi and smart liquidity tools often operate in gray areas of financial regulation.
9. Case Studies: Smart Liquidity in Action
9.1 Uniswap v3
LPs can select specific price ranges.
Capital is more efficiently used.
Offers active vs passive liquidity strategies.
9.2 Chainlink’s Smart Liquidity Feeds
Real-time price oracles to protect against volatility.
Used in lending and stablecoin protocols.
9.3 Flash Loan Arbitrage (Aave + Uniswap)
Borrow millions with no collateral.
Arbitrage price differences across DEXs.
All within one transaction.
10. The Role of Data and AI in Smart Liquidity
10.1 Predictive Liquidity Deployment
AI models forecast:
Which token pairs will surge.
Where to deploy capital.
Risk-adjusted returns.
10.2 Real-Time Monitoring Tools
Heatmaps, volume spikes, order flow analytics.
Tools like Nansen, Dune Analytics, DefiLlama, etc.
10.3 NLP for News-Based Liquidity Adjustment
AI reads news headlines and adjusts trading decisions.
Conclusion
Smart liquidity represents a transformative leap in how capital flows within financial systems. By integrating data science, AI, blockchain technology, and financial engineering, it enables more adaptive, efficient, and democratized liquidity provisioning.
Whether in traditional finance, decentralized ecosystems, or future cross-chain platforms, smart liquidity will play a pivotal role in shaping tomorrow’s financial markets. For traders, investors, protocols, and institutions alike, understanding and leveraging smart liquidity is no longer optional — it's essential.
Sector Rotation Strategies1. Introduction
Volatile markets can strike fear into the hearts of even the most seasoned investors. However, amidst the chaos, opportunities emerge. One of the most effective strategies to navigate turbulence is sector rotation—the practice of shifting capital among different sectors of the economy to capture relative strength and minimize downside risk.
In this comprehensive guide, we’ll explore how to apply sector rotation during volatile markets, backed by historical data, theoretical insights, and practical strategies.
2. Understanding Sector Rotation
Sector rotation involves allocating capital across different sectors of the market—like technology, healthcare, energy, and financials—based on their performance potential relative to macroeconomic conditions and investor sentiment.
The market is broadly divided into cyclical sectors (e.g., consumer discretionary, industrials, financials) and defensive sectors (e.g., utilities, healthcare, consumer staples). Understanding the relative performance of these sectors under different market conditions is the essence of sector rotation.
3. Volatile Markets: Definition and Characteristics
Volatility refers to sharp price movements, both up and down, often measured by the VIX (Volatility Index). Characteristics of volatile markets include:
Sudden news shocks (geopolitical events, policy changes)
Uncertainty in interest rates or inflation
Declining investor confidence
High trading volumes
Sector-specific panic or exuberance
Volatility isn't always bad—it often precedes major directional moves and creates sector divergences.
4. The Core Logic Behind Sector Rotation
At its heart, sector rotation assumes that no sector outperforms all the time. Each sector has a unique set of sensitivities—interest rates, inflation, earnings cycles, regulatory changes.
Key principles include:
Economic Sensitivity: Cyclical sectors outperform during economic expansions, while defensive sectors do better during contractions.
Rate Sensitivity: Financials thrive when interest rates rise, but rate-sensitive sectors like real estate may struggle.
Inflation Hedge: Energy and materials often perform well when inflation expectations are high.
Understanding these principles helps investors rotate in sync with macroeconomic tides.
5. Business Cycle and Sector Performance
The sector rotation strategy aligns closely with the economic/business cycle, which includes the following phases:
Cycle Phase Leading Sectors
Early Recovery Financials, Consumer Discretionary, Industrials
Mid Expansion Tech, Materials
Late Expansion Energy, Commodities
Recession/Contraction Utilities, Healthcare, Consumer Staples
In volatile markets, identifying which phase the economy is in becomes vital. Often, volatility spikes during transitions between phases.
6. Indicators to Watch for Sector Rotation
To effectively execute sector rotation strategies, traders rely on a mix of technical, fundamental, and macro indicators:
Relative Strength (RS) of sectors vs. the S&P 500
Intermarket Analysis (e.g., bond yields vs. equities)
Yield Curve Movement
Purchasing Managers’ Index (PMI)
Consumer Confidence Index
Fed statements and rate changes
Sector ETFs Volume Analysis
In volatile markets, intermarket correlations often break, making it essential to monitor sector-specific momentum shifts more frequently.
7. Sector Rotation During Volatility: A Strategic Blueprint
Here’s a step-by-step method to implement sector rotation in turbulent markets:
Step 1: Assess the Macro Landscape
Identify triggers: inflation fears, war, rate hikes, global slowdown.
Use the VIX to gauge sentiment.
Read macro reports (GDP, CPI, FOMC statements).
Step 2: Identify Strong and Weak Sectors
Use RS charts and sector ETF performance.
Compare sector momentum on weekly vs daily charts.
Look at earnings revision trends across sectors.
Step 3: Allocate Capital Accordingly
Rotate into defensive sectors during extreme volatility.
Shift into cyclicals if signs of stabilization appear.
Reduce allocation to laggards or sectors facing earnings downgrades.
Step 4: Monitor and Adjust
Set trailing stop-losses.
Review sector performance weekly.
Be flexible—volatility often leads to false breakouts and sector whipsaws.
8. Quantitative vs. Discretionary Approaches
Quantitative Rotation strategies rely on algorithms using:
Momentum factors
Volatility filters
Moving averages (e.g., 20/50/200 DMA crossovers)
Mean reversion models
Discretionary Rotation is guided by human judgment—based on:
Economic interpretation
Technical chart patterns
News analysis
In volatile markets, combining both approaches (a hybrid model) often yields the best results.
9. Case Studies: Sector Rotations in Historical Volatile Periods
a) COVID Crash (Mar 2020)
Initial rotation into healthcare, consumer staples, and tech (WFH themes).
Energy, industrials, and financials lagged.
b) Russia-Ukraine War (2022)
Energy and defense stocks surged.
Growth sectors like tech underperformed.
Commodities and fertilizers saw capital inflows.
c) US Banking Crisis (Mar 2023)
Financials tanked.
Gold, utilities, and large-cap tech gained as safe havens.
Studying these rotations helps understand how volatility realigns capital.
10. Tools and Platforms for Sector Analysis
TradingView: Relative strength, custom indicators, overlay comparisons.
Finviz: Sector heatmaps, ETF flows.
StockCharts: RRG charts (Relative Rotation Graphs).
Thinkorswim / Zerodha Kite / Upstox Pro: Built-in sector performance analytics.
Morningstar / Bloomberg Terminal (for professionals): Deep sectoral earnings insights.
11. Common Mistakes in Sector Rotation
Overtrading: Rotating too frequently in choppy markets.
Late Entries: Chasing a sector after it’s already made big moves.
Ignoring Fundamentals: Rotation without checking macro alignment.
Single-Sector Bias: Getting stuck in “favorite” sectors despite data.
Timing Errors: Misjudging transitions between market phases.
12. Risk Management Strategies
Diversify across 2–4 sectors, not just one.
Use position sizing and sector allocation limits.
Set sector-specific stop-losses (based on volatility).
Avoid leveraged sector ETFs unless experienced.
Rebalance monthly or quarterly to lock in rotation gains.
13. Real-World Examples (Post-COVID, War, Recession Fears)
Post-COVID Recovery (2021)
Rotation from defensive to cyclicals.
Travel, hospitality, financials, and industrial stocks saw massive gains.
Inflation + War (2022)
Energy stocks (XLE), defense (RTX, LMT), and materials (XLB) surged.
Investors fled from growth (ARKK-style) to value sectors.
Recession & Rate Cuts Expectations (2024–2025)
Healthcare and staples outperformed.
Market started pricing in rate cuts, leading to a mini tech revival.
These patterns show that volatility leads to sector rotation, not blanket sell-offs.
14. Sector ETFs & Mutual Funds for Rotation
To implement rotation passively or semi-actively, investors can use:
Popular Sector ETFs (India/Global)
ETF Sector Exchange
XLF Financials NYSE
XLV Healthcare NYSE
XLU Utilities NYSE
XLE Energy NYSE
QQQ Tech-heavy NASDAQ
Nippon India ETF Consumption Consumer NSE
ICICI Prudential PSU Bank ETF Banking NSE
These tools help execute rotations cost-effectively and with liquidity.
15. Conclusion
Sector rotation in volatile markets is not about predicting, but adapting. It’s a dynamic, responsive approach that relies on:
Understanding macro trends
Analyzing sector performance
Staying agile with capital
In high-volatility environments, some sectors become capital magnets while others bleed out. A disciplined rotation strategy, backed by data and supported by risk management, can turn volatility from a threat into a powerful ally.
Volume Profile & Market Structure AnalysisIntroduction
In the dynamic world of financial markets, traders constantly seek tools and methodologies that provide an edge. Two powerful and complementary concepts in technical analysis are Volume Profile and Market Structure Analysis. Together, they offer a multi-dimensional view of market behavior, revealing where market participants are most active and how price reacts at key levels.
This guide dives deep into both tools, explaining their principles, interrelation, and how traders can practically apply them to enhance trade decisions.
Part 1: Understanding Volume Profile
What Is Volume Profile?
Volume Profile is an advanced charting study that shows trading activity over a specified time period at specified price levels. Unlike traditional volume indicators that display volume by time (per bar), Volume Profile displays volume by price.
It helps traders understand:
Where the majority of trading volume occurred
Which prices attracted the most attention
Potential support and resistance zones
Key Components of Volume Profile
Point of Control (POC):
The price level with the highest traded volume during the selected period. It indicates the fairest price—where buyers and sellers agreed the most.
High Volume Nodes (HVN):
Areas where volume spikes significantly. These zones often act as magnets for price.
Low Volume Nodes (LVN):
Areas with little trading activity. Price tends to reject these zones or move through them quickly due to lack of interest.
Value Area (VA):
The price range within which 70% of volume was traded. It gives a sense of where the market believes value lies.
Volume Profile Shapes:
D-shape (Balanced Market): Even distribution around the POC. Expect range-bound behavior.
P-shape (Bullish Profile): Indicates short covering or accumulation.
b-shape (Bearish Profile): Reflects long liquidation or distribution.
Benefits of Volume Profile
Highlights institutional activity zones
Defines precise entry/exit areas
Identifies strong support/resistance
Filters out low-probability trades
Part 2: Understanding Market Structure Analysis
What Is Market Structure?
Market Structure is the framework of how price moves—trending, consolidating, breaking out, or reversing. It defines the pattern of highs and lows and helps determine the overall direction of the market.
Key Elements of Market Structure
Swing Highs and Lows:
Higher Highs (HH) and Higher Lows (HL): Uptrend
Lower Highs (LH) and Lower Lows (LL): Downtrend
Break of Structure (BoS):
A significant break of a previous swing high or low, signaling trend continuation or change.
Change of Character (ChoCh):
The first signal that a trend may reverse. For example, in an uptrend, if the price fails to make a higher high and drops below the last higher low.
Liquidity Zones:
Areas where stop-loss orders are commonly placed. These can become targets for price.
Order Blocks:
Last bullish/bearish candle before a strong move. These are often zones of institutional entries.
Market Phases:
Accumulation: Range-bound price action at the bottom.
Markup: Uptrend begins.
Distribution: Price consolidates near the top.
Markdown: Downtrend follows.
Part 3: Combining Volume Profile with Market Structure
Why Combine Both?
Used together, Volume Profile and Market Structure offer a layered understanding of price action. While market structure defines the direction and nature of price moves, Volume Profile identifies the strength and conviction behind those moves.
Synergistic Insights
Validating Breakouts with Volume:
A break of market structure (BoS) with high volume at the breakout level (confirmed by Volume Profile) is more reliable.
Refining Entry/Exit:
Use order blocks and structure points to define trade direction; Volume Profile helps fine-tune entry within these zones.
Avoiding False Moves:
Price may appear to break a structure but returns if there’s no volume support—Volume Profile helps filter these traps.
Identifying Smart Money Activity:
Institutions often build positions at HVNs and manipulate price around LVNs. Structure helps spot their intent; volume confirms their footprints.
Part 4: Practical Trading Applications
1. Trading Reversals
Strategy:
Identify a ChoCh (change of character)
Validate with low volume at new highs/lows (showing exhaustion)
Look for entry at the order block aligned with the Value Area Low (VAL) or High (VAH)
Example:
In an uptrend, a lower high forms and breaks the prior higher low. Volume Profile shows declining volume at new highs → Confirm reversal.
2. Trading Breakouts
Strategy:
Wait for price to break a consolidation zone
Ensure breakout happens through LVN (low resistance)
Confirm increasing volume above POC
Entry:
Retest of broken zone aligned with order block or POC.
3. Trend Continuation (Pullback Entries)
Strategy:
Identify trending market using HH/HL or LL/LH
Wait for pullback to HVN or Value Area
Look for confluence with bullish/bearish order block
Confirmation:
Rejection candle with volume absorption at the node.
4. Scalping in Ranges
Strategy:
Use intraday Volume Profile to define value area
Fade moves from VAH to VAL (range-bound play)
Confirm with microstructure shifts (e.g., lower time frame ChoCh)
Part 5: Advanced Concepts
1. Volume Profile Timeframes
Daily/Weekly Profiles: Best for swing trades.
Intraday (15m/30m): Best for day trading and scalping.
2. Volume Profile vs TPO Profile
TPO (Time Price Opportunity) adds time dimension (Market Profile)
Volume Profile is volume-focused—better for spotting real order flow
3. Liquidity Sweeps and Smart Money
Price often sweeps above a swing high to trigger stops, then reverses
Volume Profile helps spot whether the sweep was real (high volume) or a fakeout (low volume)
4. Auction Market Theory
Market is an auction: buyers and sellers find value via volume
Imbalance leads to trend, balance leads to consolidation
Part 6: Tools & Platforms for Volume Profile & Market Structure
Popular Platforms
TradingView: Has built-in volume profile tools (fixed range, visible range)
Sierra Chart & NinjaTrader: Advanced volume analysis
ThinkOrSwim: Offers Volume Profile and Market Profile
Bookmap: For real-time order flow + volume bubbles
Recommended Indicators
Volume Profile (fixed/visible)
Session Volume (for intraday)
Market Structure tools (e.g., Swing High/Low auto-detection)
Order Block indicators (custom or manual markups)
Conclusion
Volume Profile and Market Structure Analysis are individually powerful but together form a holistic trading approach that aligns price, volume, and institutional behavior. Mastering these tools allows traders to:
Identify high-probability trade zones
Detect institutional footprints
Avoid false breakouts
Time entries and exits with greater precision
As with any strategy, the key is practice, backtesting, and developing a system that fits your risk tolerance and trading style. Combined, these tools offer a potent framework for navigating modern markets with clarity and confidence.