Quantitative Trading with Minimal Code (No-code/Low-code Tools)1. Introduction to Quantitative Trading
Quantitative trading (quant trading) refers to using mathematical models, statistical techniques, and algorithmic execution to trade in financial markets. Instead of relying solely on human judgment or traditional analysis, quant traders use data-driven strategies to make decisions.
Traditionally, quantitative trading required strong programming skills, knowledge of statistics, and access to large computing resources. However, the financial technology (fintech) landscape has changed drastically in recent years. Today, even non-programmers can access and build powerful trading strategies using no-code or low-code tools.
This article explores the world of quantitative trading with minimal code, empowering retail traders and small teams to automate strategies with limited technical barriers.
2. Understanding the Traditional Quant Trading Stack
Before diving into no-code/low-code alternatives, it’s important to understand the traditional quant stack:
Layer Traditional Tools
Data Collection Python, APIs, Web Scraping
Data Analysis Pandas, NumPy, R, SQL
Strategy Design Python, MATLAB
Backtesting Backtrader, Zipline, QuantConnect
Execution Interactive Brokers API, FIX Protocol
Monitoring & Reporting Custom dashboards, Logging scripts
Each layer generally requires coding proficiency, especially in Python or C++.
3. The Rise of No-Code and Low-Code Quant Platforms
No-code platforms allow users to perform complex tasks without writing any code, usually via graphical interfaces.
Low-code platforms require minimal coding—often drag-and-drop features with the option to customize small logic using scripting.
Drivers of Growth:
Democratization of finance and technology
Retail interest in algo and quant trading
Cloud-based platforms and APIs
Accessible market data and broker APIs
Lower cost and increased competition
4. Key Components of No-Code/Low-Code Quant Trading
To trade algorithmically without coding, you still need to go through the following steps—but tools simplify each process:
a. Data Sourcing
Even in no-code systems, data is the backbone.
Pre-integrated sources: Many platforms come with data from NSE, BSE, Forex, Crypto, and US markets.
Custom uploads: Upload your own CSV/Excel files.
APIs: Some tools let you connect with APIs like Yahoo Finance, Alpha Vantage, Polygon.io.
b. Strategy Building
Instead of writing logic like if RSI < 30: buy(), platforms offer drag-and-drop rule builders.
Indicators: RSI, MACD, Bollinger Bands, EMA, SMA, VWAP
Conditions: Crossovers, thresholds, trend direction, volume spikes
Signals: Buy, sell, hold, short, exit
c. Backtesting
Platforms allow historical simulation:
Choose timeframe (e.g., 5-minute candles, daily)
Run strategy across past data
Analyze win rate, drawdown, Sharpe ratio, etc.
Visual performance charts
d. Paper Trading & Live Execution
Once backtests look good, you can deploy:
Paper trading (no real money)
Broker integrations: Connect with brokers like Zerodha, Fyers, Alpaca, IBKR
Execution modes: Time-based, event-driven, portfolio-based
e. Monitoring
Real-time dashboards
Notifications via email, SMS, Telegram
Log of executed trades, slippages, and system errors
5. Popular No-Code / Low-Code Tools for Quant Trading
Here’s a list of tools currently used by non-coders and quant enthusiasts alike:
1. Tradetron (India-Focused)
No-code strategy builder with conditions, actions, and repair logic
Built-in indicators, custom variables, Python scripts (for low-code)
Supports Indian brokers (Zerodha, Angel, Alice Blue, etc.)
Auto trade, backtest, paper trade
Marketplace for strategy leasing
Ideal for: Retail traders in India with no coding background
2. QuantConnect (Low-Code, Global)
Primarily Python-based but offers drag-and-drop templates
Access to US equities, FX, Crypto, Futures
Lean Algorithm Framework (can host locally or in cloud)
Advanced backtesting and optimization
Ideal for: Semi-technical traders who want power with minimal code
3. Alpaca + Composer
Alpaca: Commission-free stock trading API
Composer: No-code visual strategy builder using drag-and-drop blocks
Rebalance logic, momentum themes, machine learning templates
Real-time execution on Alpaca
Ideal for: US market-focused traders, especially beginners
4. BlueShift (by Rainmatter/Zerodha)
Low-code environment for backtesting strategies
Python-based (but simpler than QuantConnect)
Integrated with Zerodha's Kite API
Access to Indian historical data
Ideal for: Traders with light Python skills focused on Indian markets
5. Kryll.io (Crypto)
No-code crypto strategy builder
Visual editor with technical indicators
Connects to Binance, Coinbase, Kraken, etc.
Marketplace for ready-made bots
Ideal for: Crypto traders who don’t want to code
6. MetaTrader 5 with Expert Advisors Builder
MT5 is very powerful but requires MQL5 coding
Tools like EA Builder allow strategy creation without coding
Drag-and-drop indicators, entry/exit rules
Suitable for Forex, CFDs, and indices
Ideal for: Traditional traders moving into automation
7. Amibroker + AFL Wizard
AFL (Amibroker Formula Language) can be complex
AFL Wizard helps create strategies via dropdowns and templates
Chart-based testing and semi-automated trading
Ideal for: Intermediate Indian traders familiar with Amibroker
6. Building a Quant Strategy Without Coding (Example)
Let’s walk through a basic momentum strategy using a no-code platform like Tradetron:
Goal: Buy stock when 14-period RSI crosses above 30; sell when it crosses below 70.
Steps:
Select Instrument: Nifty 50 index
Condition Block:
Condition 1: RSI(14) crosses above 30 → Action: BUY
Condition 2: RSI(14) crosses below 70 → Action: SELL
Position Sizing: Fixed lot or % of capital
Execution: Real-time or on candle close
Backtest: On 1Y daily data
Deploy: Connect to broker API for live or paper trading
All done with dropdowns, no typing code.
Conclusion
Quantitative trading no longer belongs only to PhDs and hedge funds. With the rise of no-code and low-code platforms, anyone can participate in data-driven algorithmic trading.
Whether you're a retail trader in India using Tradetron, a crypto enthusiast on Kryll, or a US equity trader exploring Composer, the tools today empower you to create, test, and execute trading strategies—with minimal to no coding.
TATAMOTORS trade ideas
FII/DII Flow and Macro Data CorrelationIntroduction
Understanding market behavior goes beyond just charts and price action. One of the most critical but often overlooked aspects of the stock market is the movement of institutional money, especially that of Foreign Institutional Investors (FIIs) and Domestic Institutional Investors (DIIs). These large players often dictate the trend and direction of the market.
However, their investment decisions are not random—they are highly influenced by macroeconomic indicators, such as GDP growth, inflation, interest rates, currency movement, and more. This brings us to a crucial intersection of FII/DII flow and macroeconomic data correlation.
This article aims to demystify this relationship, enabling you to better anticipate market trends and make informed trading or investing decisions.
Who Are FIIs and DIIs?
Foreign Institutional Investors (FIIs)
FIIs include overseas entities like:
Hedge funds
Pension funds
Mutual funds
Sovereign wealth funds
Insurance companies
They invest in Indian equity, debt markets, and sometimes in real estate and infrastructure. Their decisions are largely influenced by global economic conditions and domestic macro indicators.
Domestic Institutional Investors (DIIs)
DIIs include:
Indian mutual funds
Insurance companies (LIC, etc.)
Banks
Pension funds (like EPFO)
Unlike FIIs, DIIs often have a longer investment horizon and are more focused on domestic fundamentals.
Why Are FII/DII Flows Important?
FIIs account for nearly 15–20% of the market’s float, making them highly influential in market movements.
DIIs counterbalance FII actions, especially when FIIs withdraw funds due to global risk-off sentiment.
Sudden inflows or outflows create volatility or trend continuation/reversal, especially in benchmark indices like Nifty and Sensex.
Key Macro Data That Influence FII/DII Activity
Here are the most critical macroeconomic indicators and how they affect FII/DII flows:
1. Interest Rates (Repo Rate, Global Rates)
FII Impact:
Higher interest rates in the US (like Fed rate hikes) often lead to FII outflows from emerging markets like India.
Funds move from riskier markets (like India) to safe, higher-yield assets in the US.
DII Impact:
Higher domestic interest rates make debt instruments (bonds, FDs) more attractive, reducing equity exposure.
Conversely, lower rates push DIIs towards equity markets in search of better returns.
Example: When the US Fed increased rates aggressively in 2022–23, there was a massive FII outflow from India, causing volatility in the Nifty and Sensex.
2. Inflation (CPI/WPI)
FII Impact:
High inflation erodes returns. FIIs avoid economies where inflation is not under control.
Inflation impacts currency stability, thus affecting foreign returns after conversion.
DII Impact:
High inflation often leads to rate hikes, which can reduce DII investments in growth sectors like IT, real estate, and autos.
Defensive sectors like FMCG and Pharma see higher allocation during inflationary phases.
Example: Sticky inflation in India led to RBI raising repo rates from 4% to 6.5% during 2022–23. Both FIIs and DIIs became cautious.
3. GDP Growth and Economic Outlook
FII Impact:
Strong GDP growth attracts FIIs as it reflects economic momentum, profitability, and consumption growth.
India being a consumption-driven economy, high GDP forecasts often result in equity inflows.
DII Impact:
DIIs also align portfolios with sectors benefiting from GDP uptick – like infra, banking, and capital goods.
Example: Post COVID-19, India's faster GDP recovery led to record FII inflows in 2020–21, boosting markets by over 70%.
4. Currency Exchange Rates (USD/INR)
FII Impact:
A depreciating INR makes it less profitable for FIIs to invest, as their repatriated returns reduce.
FIIs pull out capital when they expect further depreciation or volatility.
DII Impact:
Currency movement affects import-heavy companies (like Oil, FMCG) and export-heavy sectors (like IT, Pharma).
DIIs adjust portfolios accordingly.
Example: In 2013, INR breached ₹68/USD causing FIIs to exit in large numbers, contributing to the infamous "Taper Tantrum".
5. Fiscal Deficit & Current Account Deficit (CAD)
FII Impact:
High deficits indicate a weak economy or excessive borrowing, making it unattractive for foreign investors.
FIIs consider this when analyzing long-term stability.
DII Impact:
DIIs may reduce equity exposure if fiscal imbalance leads to policy tightening or taxation changes.
Example: A widening CAD in 2012-13 led to FII outflows due to concerns about India’s macro stability.
Conclusion
The correlation between FII/DII flows and macroeconomic data is one of the strongest predictors of market trends. While FIIs react more swiftly to global and domestic macro shifts, DIIs provide stability during uncertain times.
For any serious trader or investor, tracking both institutional flow and macro indicators is not optional—it’s essential. It offers deeper context beyond price movements and helps you anticipate what could happen next.
By integrating this correlation into your trading/investment strategy, you gain an edge that pure technical or news-based strategies often miss.Reading FII/DII Flow Data: Tools and Reports
Sources to Track:
NSE/BSE websites – Daily FII/DII activity reports
NSDL – Monthly country-wise FII data
RBI – Macro reports, interest rates, inflation
Trading platforms – Brokers like Zerodha, Groww, Upstox offer dashboards
How Traders Can Use FII/DII & Macro Correlation
For Swing & Positional Traders:
Align trades with net FII flow trends – when FIIs are net buyers for consecutive days, it's a bullish indicator.
Sector rotation happens based on macro trends – e.g., banking rises when rates pause, IT shines during INR weakness.
For Long-Term Investors:
Use macro trend signals to increase or decrease exposure. For instance, reducing equity allocation when global inflation is high.
Watch for DII behavior in falling markets – they often invest in fundamentally strong companies.
For Options Traders:
FII positioning in Index Futures and Options gives clues about sentiment.
Combine this with macro triggers (like inflation data releases, RBI policy) to set up pre-event or post-event trades.
Trading Psychology & Risk Management🧠 Part 1: Trading Psychology
Trading psychology refers to the emotional and mental aspects that influence trading decisions. It includes traits like discipline, patience, confidence, and emotional control.
✅ Traits of Successful Traders
1. Discipline
Following your trading plan no matter what.
Not deviating due to emotions or "gut feelings".
2. Patience
Waiting for the right setup to occur.
Not chasing trades or forcing market entries.
3. Emotional Resilience
Being able to handle losses without emotional reactions.
Not reacting with fear, revenge, or frustration.
💼 Part 2: Risk Management
Risk management ensures that you survive and thrive in trading, even when the market moves against you. It’s not about avoiding losses — it’s about limiting them so that no single trade can wipe out your account.
🧮 Core Concepts in Risk Management
1. Risk Per Trade
Limit risk to 1–2% of total capital per trade.
For example, on a ₹1,00,000 account, risk only ₹1,000–₹2,000 per trade.
2. Position Sizing
Use your stop-loss level to determine how many shares/contracts to trade.
tata motors analysisON daily tf price is positive we can expect price to go up from fib 0.5 or 0.618 level

Ride The Big Moves🚀 Ride The Big Moves 📈
"Ride The Big Moves" is a powerful trading strategy and mindset that focuses on capturing large, high-probability market moves—rather than chasing small, uncertain fluctuations. It’s about positioning yourself with the trend, identifying institutional footprints, and holding trades with discipline and conviction for maximum reward.
This concept is rooted in smart money principles: letting your winners run, minimizing overtrading, and waiting for momentum-backed breakouts instead of guessing tops and bottoms. Whether you're trading options, stocks, or futures, the goal is simple—enter with precision, and ride the wave to its full potential.
👉 Perfect for:
✅ Swing Traders
✅ Intraday Momentum Traders
✅ Institutional-Style Traders
✅ Traders seeking fewer but higher-quality setups
🔍 Key Components:
Identifying high-volume breakout zones
Trend confirmation using price action
Entry triggers aligned with momentum shifts
Risk management for extended holds
Avoiding noise & false signals
Stop settling for crumbs — Ride The Big Moves and trade like the pros.

Master Institutional Trading🎯 Master Institutional Trading
Master Institutional Trading means learning to trade like the top financial institutions – with precision, strategy, and data-driven decisions. It’s the highest level of trading where you think and act like banks 🏦, hedge funds 📊, and investment firms 💼.
This mastery involves:
🔍 Understanding how smart money moves
📈 Analyzing volume, liquidity zones, and order flow
💹 Executing large trades without impacting the market
🛡️ Applying risk-controlled option & futures strategies
🧠 Using advanced tools, indicators, and market depth
🔄 Adapting to news, events, and institutional triggers
To master this skill, traders must develop:
📊 Strong technical + fundamental analysis
🧘 Discipline and emotion control
🧾 A solid, backtested trading system
💬 Knowledge of macroeconomic impacts
🧮 Command over greeks, derivatives, and hedging
📌 In simple words:
Mastering Institutional Trading means stepping into the shoes of the pros – learning how the big money operates, and trading with structure, edge, and confidence.

Technical Class🧠 Why Learn Technical Analysis?
Because price is king.
All news, fundamentals, and economic data are already reflected in price. Technical analysis teaches you how to read price charts and anticipate movements—giving you the timing advantage.
Institutions, traders, and even algorithms rely heavily on technical levels. So if you want to:
Know when to enter/exit
Understand where big money is active
Manage risk smartly
Improve accuracy
…you need strong technical skills.
🔍 What Will a Good Technical Class Cover?
Let’s break this into 10 structured modules, explained in human-friendly language.
📘 1. Basics of Price Action
What is a chart? (Line, Bar, Candlestick)
Understanding OHLC (Open, High, Low, Close)
Why price is the most important factor
How price creates support, resistance, and trends
👉 Outcome: You’ll read any chart confidently.
📘 2. Candlestick Patterns
Single candlesticks: Doji, Hammer, Engulfing, Marubozu
Dual & triple candle patterns: Morning Star, Evening Star, Three Soldiers
Reversal vs Continuation patterns
👉 Outcome: You’ll know how to identify potential trend reversals or strength.
📘 3. Chart Patterns (Price Structures)
Reversal Patterns: Double Top/Bottom, Head and Shoulders
Continuation Patterns: Triangles, Flags, Pennants, Rectangles
Understanding Breakouts vs Fakeouts
👉 Outcome: You’ll recognize market structures and act before the move begins.
📘 4. Support and Resistance Mastery
How to identify major support/resistance levels
Role of historical price zones
Dynamic support/resistance using moving averages
Price reaction techniques
👉 Outcome: You’ll place entries and exits at the most strategic levels.
📘 5. Trend Analysis
What is a trend? (Uptrend, Downtrend, Sideways)
How to draw trendlines correctly
Role of higher highs & lower lows
Using Multiple Timeframe Analysis
👉 Outcome: You'll align trades with major trends like professionals do.
📘 6. Indicators & Oscillators
Moving Averages (SMA, EMA): Trend confirmation
RSI: Overbought/Oversold signals
MACD: Momentum and divergence detection
Bollinger Bands: Volatility breakout
Volume Profile / VWAP
👉 Outcome: You’ll combine indicators for confluence and higher accuracy.
📘 7. Intraday Technicals
Best indicators for intraday (VWAP, Supertrend)
Time-based chart usage (5m, 15m, 1hr)
Institutional trap zones (fakeouts, liquidity sweeps)
Scalping vs momentum setups
👉 Outcome: You’ll confidently take trades within the day using fast setups.
📘 8. Risk Management and Trade Psychology
Position sizing
Risk-Reward ratio planning
Importance of Stop Loss
Emotional control: Fear, Greed, Impatience
Creating a rule-based system
👉 Outcome: You’ll trade stress-free, without blowing up your capital.
📘 9. Advanced Institutional Concepts
Smart Money Concepts (SMC): Liquidity, Order Blocks, BOS/CHOCH
Institutional Order Flow: Where big money trades
Volume Spread Analysis
Wyckoff Theory (Accumulation/Distribution phases)
👉 Outcome: You’ll learn how institutions move the markets and how to follow them.
📘 10. Strategy Building and Backtesting
Creating rule-based strategies
Journaling trades and analyzing results
Backtesting on historical data
Live market application with confidence
👉 Outcome: You’ll develop your own strategy and remove guesswork.

Advanced Option StrategiesWhat are Options?
Before we dive into advanced stuff, here’s a quick refresher.
An Option is a contract that gives you the right (but not the obligation) to buy or sell a stock/index at a certain price, on or before a certain date.
There are 2 types:
Call Option – Right to BUY
Put Option – Right to SELL
Buyers pay a premium. Sellers receive a premium and take on the obligation.
💼 Why Use Advanced Strategies?
If you only buy calls or puts, you might:
Lose 100% of your capital quickly
Get the direction right, but still lose due to time decay
Suffer from high premiums or volatility crush (IV crush)
Advanced strategies help you:
✅ Reduce risk
✅ Lock-in profits
✅ Earn from sideways markets
✅ Trade during high volatility events
✅ Create income strategies
🧠 1. Bull Call Spread – Directional but Risk-Defined
Used when: You’re moderately bullish, but don’t want to spend too much on a call.
How it works:
Buy 1 ATM Call
Sell 1 higher strike OTM Call
Example:
Nifty at 22000
Buy 22000 CE @ ₹100
Sell 22200 CE @ ₹40
Net Cost = ₹60
Max Profit: ₹200 (22200–22000) – ₹60 = ₹140
Max Loss: ₹60 (net premium paid)
👉 This strategy caps your risk and reward but is cost-efficient and smart in range-bound bull moves.
🧠 2. Bear Put Spread – Controlled Downside Betting
Used when: You’re mildly bearish and want to control losses.
How it works:
Buy 1 ATM Put
Sell 1 lower strike Put
Example:
BankNifty at 48500
Buy 48500 PE @ ₹120
Sell 48000 PE @ ₹60
Net Cost = ₹60
Max Profit: ₹500 – ₹60 = ₹440
Max Loss: ₹60
👉 Ideal for limited downside moves — cheaper than naked Put.
🧠 3. Iron Condor – The Sideways Market King
Used when: Market is flat or expected to stay in a range.
How it works:
Sell 1 OTM Call + Buy 1 higher OTM Call
Sell 1 OTM Put + Buy 1 lower OTM Put
You make money if market stays between the 2 sell strikes.
Example:
Nifty is at 22500
Sell 22800 CE, Buy 23000 CE
Sell 22200 PE, Buy 22000 PE
👉 You collect premiums from both sides.
Max Profit = Net Premium
Max Loss = Difference between strikes – Net Premium
👉 Works great in expiry week or low-volatility phases.
🧠 4. Straddle – Big Move Expected, Direction Unknown
Used when: A major move is expected (news, event, earnings), but unsure about direction.
How it works:
Buy ATM Call and ATM Put of the same strike & expiry.
Example:
Stock at ₹500
Buy 500 CE @ ₹20
Buy 500 PE @ ₹25
Total Cost = ₹45
If stock moves big — say ₹60 or more either way — you profit.
👉 High risk due to premium decay if market stays flat.
Need volatility to spike.
🧠 5. Strangle – Cheaper than Straddle, Wider Range
Used when: You expect a big move but want lower cost than a straddle.
How it works:
Buy OTM Call and OTM Put (strikes wider apart than ATM).
Example:
Nifty at 22500
Buy 22800 CE @ ₹12
Buy 22200 PE @ ₹10
Total Cost = ₹22
You profit if the move crosses either strike + premium.
👉 Needs bigger move than straddle but less premium at risk.
🧠 6. Calendar Spread – Play with Time
Used when: You expect price to stay near a level short term, but may move later.
How it works:
Sell near-term option
Buy far-term option (same strike)
Example:
Sell 22500 CE (weekly) @ ₹50
Buy 22500 CE (monthly) @ ₹70
Net Cost = ₹20
👉 You make money if price stays near 22500 by expiry of short leg.
Profits from time decay of the short leg.
🧠 7. Ratio Spreads – Advanced Directional with a Twist
Used when: You expect a move in one direction, but want to reduce cost.
Bull Call Ratio Spread
Buy 1 lower Call
Sell 2 higher Calls
Example:
Buy 22000 CE @ ₹100
Sell 2× 22200 CE @ ₹60 each
Net Credit = ₹20
If market moves moderately up — you profit.
But if it rises too fast — risk increases.
👉 Suitable for experienced traders only — manage risk carefully.
🧠 8. Covered Call – Income Strategy for Investors
Used when: You hold stocks and want to earn extra income.
How it works:
Hold 100 shares of a stock
Sell 1 OTM Call
Example:
You own 100 shares of Reliance @ ₹2500
Sell 2600 CE @ ₹20
If Reliance stays below ₹2600, you keep the premium.
If it rises above ₹2600, your shares get sold, but you still profit.
👉 Perfect for long-term investors.
🧠 9. Protective Put – Insurance for Your Stock
Used when: You own shares but want downside protection.
How it works:
Hold stock
Buy 1 ATM/OTM Put
Example:
Own Infosys @ ₹1500
Buy 1480 PE @ ₹20
If stock falls below ₹1480, your loss is capped.
👉 It’s like buying insurance for your portfolio.
🧠 10. Butterfly Spread – Range-Bound Precision Strategy
Used when: You expect minimal movement and want low-risk, high-RR trade.
How it works (Call Butterfly):
Buy 1 lower strike Call
Sell 2 middle strike Calls
Buy 1 higher strike Call
Example:
Buy 22000 CE
Sell 2× 22200 CE
Buy 22400 CE
You earn if market expires at the middle strike.
Max loss = Net debit
Max profit = At middle strike
👉 Best for expiry day premium decay strategies.
Common Mistakes to Avoid
Not understanding strategy risk
Using high-margin strategies without protection
Overtrading in expiry week
Not adjusting trades as market moves
Ignoring volatility impact (IV crush)
🛠 Tools to Use
Option Chain (for strike selection)
IV (Implied Volatility) data
Open Interest (OI)
Strategy Builder platforms (e.g. Sensibull, Opstra, or TradingView)
🎯 Final Thoughts
Advanced options trading isn’t gambling — it’s about smart risk management.
These strategies:
Give you control
Limit losses
Provide flexibility across different market types
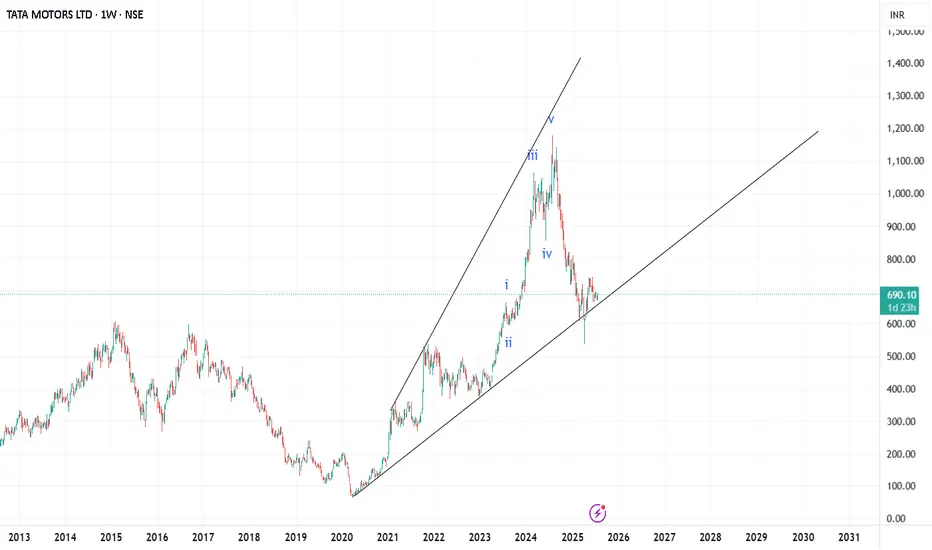
Weekly- End of correctionOn arithmetic scale it looks like a wave 5 extended . But on log scale it is a wave 3 . We have to be pragmatic in order to make money . So if we see a clear-cut wave which is there in this case we need to buy with a sl of wave 4. If wave 4 breaks next SL would be bottom of wave 2 . See the dark green candle there. Correction is over .
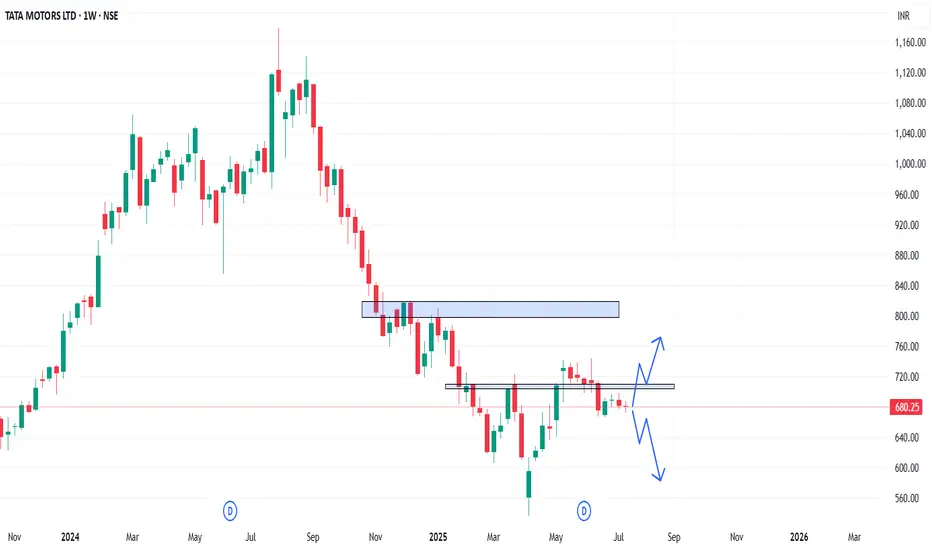
TATAMOTORS - Weekly AnalysisIn the Weekly Chart of TATAMOTORS ,
we can see that, it is at decision making point.
Possible momentums are shown in chart.
Tata Motors range bounded- still a Long scriptTata Motors range bounded- still a Long script
It may consolidate ch 680-670 in near future and post consolidation it may give a great move towards 950, 1250
Tata Motors Limited Trade Information
Traded Volume (Lakhs) 54.79
Traded Value (₹ Cr.) 379.31
Total Market Cap (₹ Cr.) 2,54,867.64
Free Float Market Cap (₹ Cr.) 1,44,093.24
Impact cost 0.02
% of Deliverable / Traded
Quantity 46.00 %
Applicable Margin Rate 15.76
Face Value 2
Price Information
52 Week High (30-Jul-2024) 1,179.00
52 Week Low (07-Apr-2025) 535.75
Upper Band 762.50
Lower Band 623.90
Price Band (%) No Band
Daily Volatility 1.93
Annualised Volatility 36.87
Tick Size 0.05
Basic Industry Passenger Cars & Utility Vehicles
Index NIFTY 50

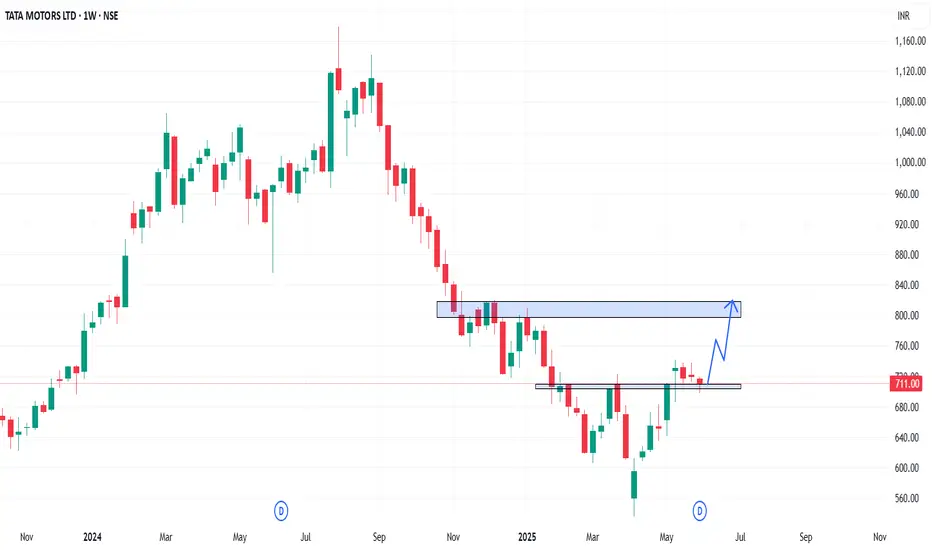
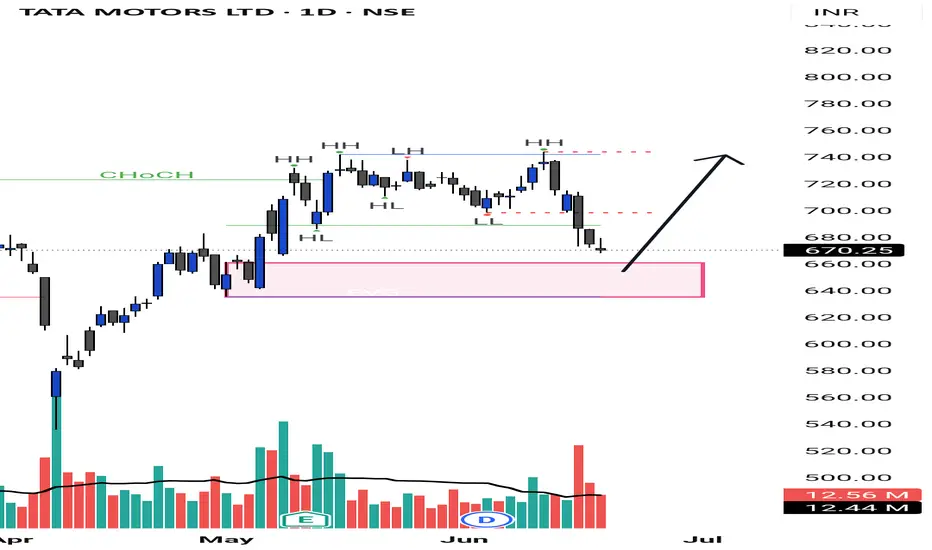
Tata Motors Long SetupTata Motors has confirmed a breakout from its recent downtrend, indicating a potential reversal. The breakout is supported by the formation of a strong bullish candle right at a key support zone, signaling renewed buying interest. This setup suggests favorable risk-reward for a long position, especially with increasing volume and momentum backing the move. Traders can consider entering above the breakout candle with a stop loss below the support.
Long for short term Tata motors is in good buying range at cMP or near to 670 . Sl would be 655 . Target would be 740 and if it cross it with good volume may reach to 760 as so on.
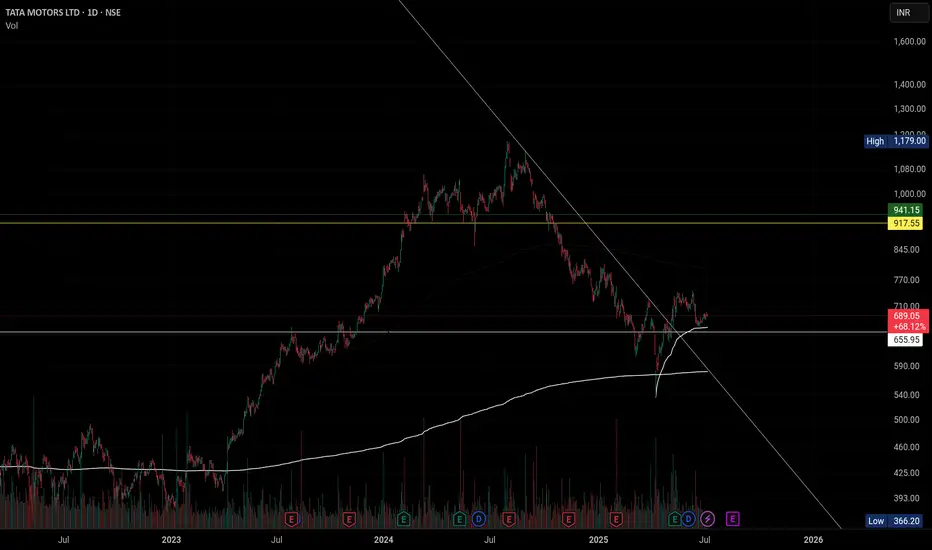
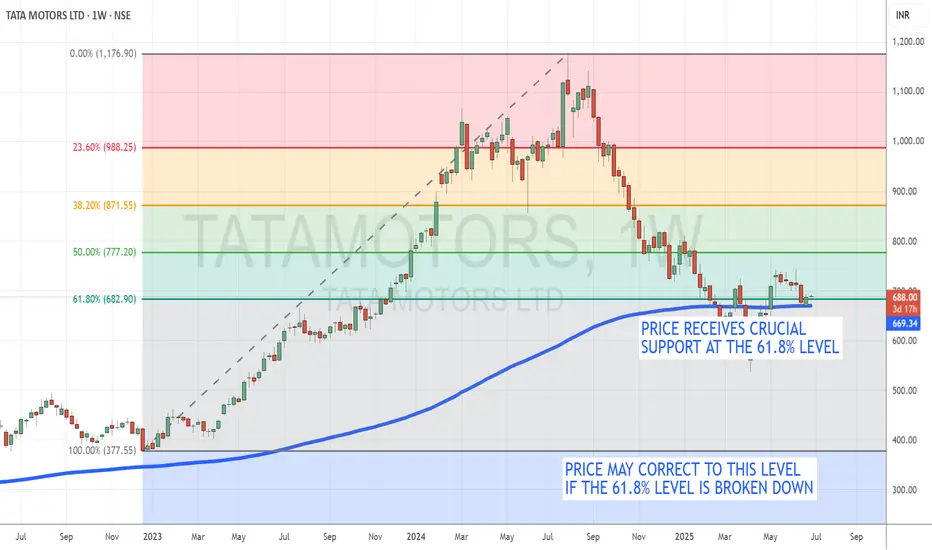
Tata Motors Holds at Key Support, Oversold Levels Hint at PotentTopic Statement:
Tata Motors, heavily beaten down and still oversold, is clinging to crucial support that could define its next move.
Key Points:
* The stock has repeatedly taken support at the 61.8% Fibonacci retracement level, where it currently trades even today
* Price is hovering just above the 180-day EMA, suggesting a delicate balance between support and further downside risk
* A move up is possible from this oversold level, but if support breaks, the price could slide further toward the 400 zone
Tata Moter Next Move Tata Motors Ltd. Business Model
---
## 🚘 **Tata Motors – Business Model Overview**
### 🏢 **Company Profile**
* **Founded**: 1945 (as Tata Engineering and Locomotive Co. Ltd.)
* **Headquarters**: Mumbai, Maharashtra, India
* **CEO & MD**: **PB Balaji** (Group CFO), **Shailesh Chandra** (EV & PV), **Girish Wagh** (CV)
* **Parent Group**: **Tata Group**
* **Listed on**: NSE, BSE
* **Global Subsidiaries**: **Jaguar Land Rover (JLR), Tata Daewoo, Tata Technologies**
---
## 🧩 **Business Segments**
### 1. 🚙 **Passenger Vehicles (PV)**
* Compact, mid-size, SUVs, and EVs
* Key models: **Nexon**, **Punch**, **Altroz**, **Tiago**, **Safari**, **Harrier**
* Strong focus on **safety (5-star Global NCAP)** and **design innovation**
### 2. 🏭 **Commercial Vehicles (CV)**
* Largest CV manufacturer in India
* Product range: Trucks (light, medium, heavy), Buses, Pickups, Vans
* Fleet, mining, defense, and cargo applications
### 3. ⚡ **Electric Vehicles (EVs)**
* Market leader in India with over **75% EV share**
* Key models: **Nexon EV**, **Tiago EV**, **Tigor EV**, **Punch EV**
* Operates via subsidiary **Tata Passenger Electric Mobility Ltd.**
* Backed by **Tata Power (charging infra)**, **Tata AutoComp (batteries)**
### 4. 🏎️ **Jaguar Land Rover (JLR)**
* UK-based luxury car manufacturer acquired in 2008
* Produces Jaguar (performance) and Land Rover (luxury SUV) brands
* Major revenue generator in UK, China, Europe, and USA
---
## 💸 **Revenue Model**
| Segment | Revenue Contribution (FY23–24) |
| ----------------------------------- | ------------------------------ |
| Jaguar Land Rover (JLR) | \~68–70% |
| Tata CV (India + Export) | \~15–18% |
| Tata PV & EV | \~10–12% |
| Spare Parts, Finance, Tech Services | \~5% |
* **JLR** accounts for the majority of **global revenue**
* **Indian PV and EV business** is high-growth, margin-enhancing
* **Commercial vehicles** provide cash flow stability
---
## 🌐 **Global Presence**
* Vehicles sold in **125+ countries**
* Manufacturing/assembly in India, UK, South Africa, Thailand, and Argentina
* JLR has R\&D & design centres in **UK, Slovakia, and China**
---
## ⚙️ **Key Business Strategies**
### 🔷 Vertical Integration
* In-house design, production, and sales
* Subsidiaries for software (Tata Technologies), batteries (Agratas), charging (Tata Power)
### 🔷 Multi-Brand Architecture
* Tata for mass vehicles
* JLR for luxury segment
* EVs under **Tata.ev** brand
### 🔷 R\&D & Innovation
* Focus on electric mobility, connected cars, AI/ML features
* Investment in **green mobility**, **autonomous driving**, and **hydrogen fuel**
---
## 💡 Strengths of the Model
✅ Diversified business: luxury + mass + commercial
✅ Leadership in EV segment in India
✅ Synergy with other Tata Group companies
✅ Strong domestic and export network
✅ Competitive pricing and robust after-sales service
---
## 🚀 Future Growth Plans
* Launching new EVs and expanding battery manufacturing via **Gigafactories**
* Expanding JLR's **electric vehicle portfolio**
* Growing market share in premium and fleet segments
* Leveraging Tata Group's **Tata Neu** for digital retail & service ecosystem
---
## 🧠 Summary
**Tata Motors = Multi-Segment Automotive Leader**
> Balances high-margin luxury (JLR), mass-market mobility (PV/CV), and future tech (EVs), supported by strong brand trust and R\&D investments.
---

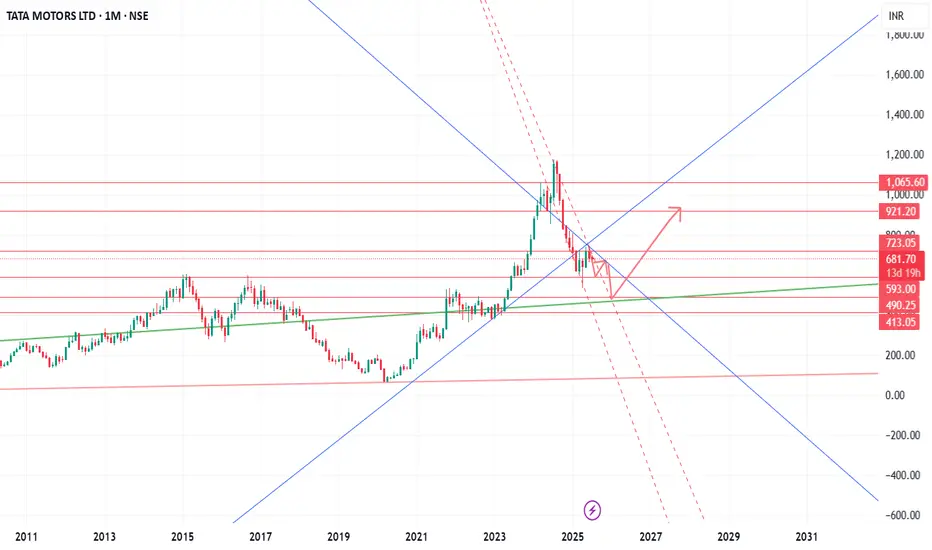
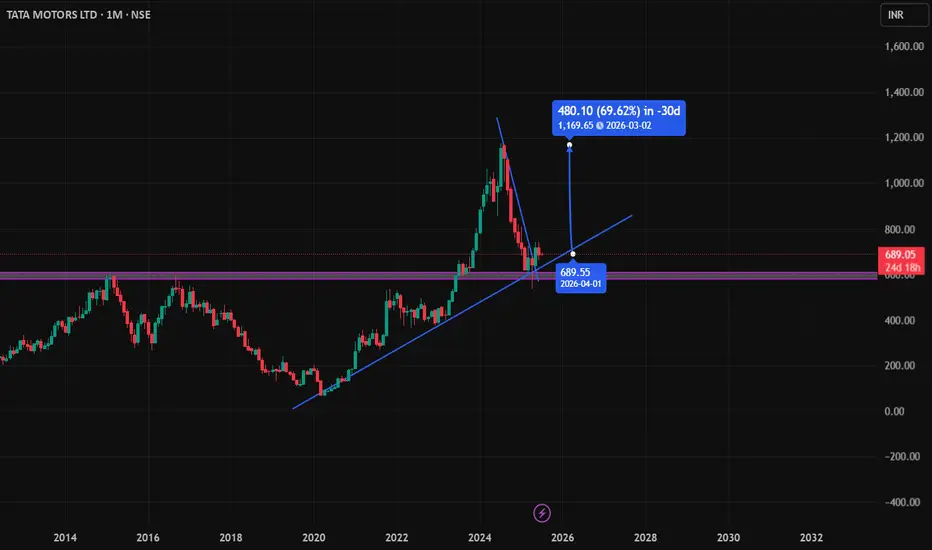
Up coming forecast I have made an visual representation on the chart
I still look this will continue for another 5 to8 % move before any decisions of Trend
change or indication of trend change
This is not recommendation its an example of pattern based trading
Good luck
tata moters projection### **Tata Motors Company Profile**
#### **Overview**
Tata Motors Limited is a leading global automobile manufacturer and a part of the **Tata Group**, one of India's largest conglomerates. Established in **1945**, Tata Motors has grown to become a key player in both **commercial and passenger vehicle** segments, with a presence in over **125 countries**. The company is headquartered in **Mumbai, India**.
#### **Key Details**
* **Founded**: 1945
* **Headquarters**: Mumbai, Maharashtra, India
* **CEO**: **Shailesh Chandra** (for passenger vehicles & EVs), **Girish Wagh** (for commercial vehicles)
* **Parent Company**: Tata Group
* **Subsidiaries**: Jaguar Land Rover (JLR), Tata Daewoo, Tata Technologies
* **Stock Listings**: NSE & BSE (India), NYSE (Previously listed)
* **Revenue**: ₹4.38 lakh crore (approx. \$52.6 billion) (FY 2023-24)
* **Employees**: Over 80,000
#### **Product Portfolio**
Tata Motors manufactures a wide range of vehicles, including:
✅ **Passenger Vehicles** – Tata Nexon, Harrier, Safari, Tiago, Tigor, Altroz
✅ **Electric Vehicles (EVs)** – Tata Nexon EV, Tiago EV, Tigor EV, Punch EV
✅ **Commercial Vehicles** – Trucks, Buses, Pickups, and Defense Vehicles
✅ **Luxury Vehicles** – Jaguar & Land Rover (JLR, UK-based subsidiary)
#### **Global Presence**
Tata Motors exports its vehicles to markets across **Europe, Latin America, Africa, the Middle East, and Southeast Asia**. The **Jaguar Land Rover (JLR)** division has a strong presence in the **UK, USA, China, and Europe**.
#### **Recent Developments**
🔹 **EV Leadership**: Tata Motors is the market leader in India's EV segment, with over **75% market share**.
🔹 **Battery Manufacturing**: Investing **\$1.5 billion** in a battery giga factory to strengthen its EV ecosystem.
🔹 **SUV Boom**: SUVs account for over **56% of Tata Motors' passenger vehicle sales**.
🔹 **Financial Performance**: Reported **₹54.51 billion** profit in Q3 FY24, a **22% decline** due to JLR and domestic market challenges.
#### **Future Plans**
✔ Expansion in the **electric vehicle** segment with advanced battery technology.
✔ Strengthening **global presence** by expanding JLR and commercial vehicle exports.
✔ Investment in **sustainable mobility**, including hydrogen fuel cell vehicles.

Tata Motors AnalysisLooking upon MTF and current position of a trend in Tata Motors, its likely to catch up its momentum from the highlighted order block or demand zone area.
Always look for decrease or contraction in selling volumes if it comes to the mentioned zone.
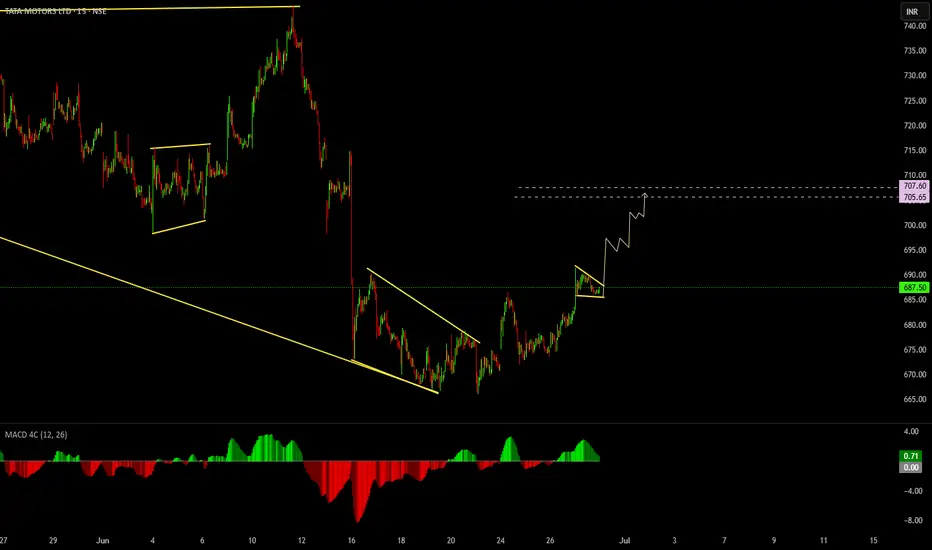
End of the Drop? Tata Motors Sets Stage for Wave 3Tata Motors has completed a clear five-wave advance from the April low of 535.75 to a high near 742, which is being marked as wave 1. After that peak, the stock entered a corrective phase and has now dropped into what appears to be an a-b-c structure (expanding flat), likely forming wave 2. The recent decline has reached the 1.618 extension of wave a, with wave c possibly ending near 672.
This 1.618 level is often where deeper corrections tend to exhaust, and price has also moved below the lower edge of the Bollinger Band, which can signal short-term pressure easing. These two conditions together suggest that the current downmove may be ending. If this count is correct, the next move should be a fresh upward rally in the form of wave 3.
For this idea to stay valid, wave 2 must not fall below the April low at 535.75, which serves as the key invalidation level. Until then, the setup remains constructive, with early signs pointing to a possible bounce from here.
Disclaimer: This analysis is for educational purposes only and does not constitute investment advice. Please do your own research (DYOR) before making any trading decisions.

"TATAMOTORS: Bullish Pin Bar on Retest – Bounce Ahead?"NSE:TATAMOTORS has pulled back to retest its previous breakout zone, which now aligns perfectly with the monthly 50 EMA, acting as dynamic support. On this retest, price action has printed a bullish pin bar (hammer), suggesting potential strength from buyers and a possible reversal from this key support area.
This type of setup is often seen as a bullish confirmation, especially when price respects former resistance as new support. If the bullish momentum follows through, we could see a move toward the recent highs or even a breakout to new levels.
🔍 Key Technical Highlights:
Retest of prior breakout zone (structure support)
Bullish pin bar formation on the monthly chart
Support confluence with the 50 EMA (monthly)
Potential upside if current zone holds
Disclaimer:
This analysis is for educational and informational purposes only and does not constitute financial advice or a recommendation to buy or sell any financial instrument. Always conduct your own research and consult with a qualified financial advisor before making any investment decisions. Trading and investing involve risk, and you should never risk more than you can afford to lose.

TATAMOTORS pending bounce??looks like a decent bounce is likely to happen
and lets look for a volume expansion
high probability it might touch levels these levels soon
hoping we'll see a proper price action.
From ath TATAMOTORS has fallen 40%+ already
Company has reduced debt.
Company has delivered good profit growth of 93.1% CAGR over last 5 years
stock pe @8.17

TATAMOTORS - Weekly AnalysisIn the Weekly Chart of TATAMOTORS ,
we can see that, it has retested properly and now its ready for up move.
Expected momentum is shown in chart.