TATA Moters View For Next 3 Months
### 🚗 **Tata Motors – Detailed Business Model Script**
---
#### 🎯 **1. Introduction**
Tata Motors Limited (a part of the Tata Group) is India’s largest automobile company and one of the world’s leading automotive manufacturers. It produces a wide range of vehicles, including **passenger cars, commercial vehicles, electric vehicles, buses, trucks, and military vehicles**.
---
#### 🧩 **2. Value Proposition**
* **Affordable, reliable vehicles** for mass markets
* **Innovation in electric mobility** (e.g., Tata Nexon EV)
* **Robust commercial vehicle lineup** for business and logistics
* **Strong after-sales service and nationwide reach**
* **Global presence** with brands like Jaguar Land Rover (JLR)
---
#### 🏗️ **3. Business Segments**
**A. Commercial Vehicles (CV)**
* Trucks, Buses, Vans, Construction and Defense vehicles
* Revenue backbone in India and emerging markets
**B. Passenger Vehicles (PV)**
* Hatchbacks, Sedans, SUVs (e.g., Altroz, Nexon, Harrier)
* Known for safety, design, and affordability
**C. Electric Vehicles (EV)**
* Tata EV division (Tata.ev) includes Nexon EV, Tigor EV, Tiago EV
* Leading EV market share in India
**D. Jaguar Land Rover (JLR)**
* UK-based premium automotive subsidiary
* Designs and manufactures luxury and performance cars (e.g., Range Rover, Jaguar F-Type)
---
#### 🧱 **4. Key Resources**
* Manufacturing plants in India, UK, South Africa, and Thailand
* R\&D centers and design studios (India, UK, Italy)
* Tata Group ecosystem support
* Global distribution network and supply chain
* Strong engineering and design teams
---
#### 🔄 **5. Key Activities**
* Designing, developing, and manufacturing vehicles
* Research in electric mobility and connected car tech
* Managing global distribution, marketing, and sales
* Supplier and dealer network management
* Investment in digitalization and sustainability
---
#### 💰 **6. Revenue Model**
Tata Motors earns revenue from:
1. **Vehicle Sales** – Domestic and international retail and fleet sales
2. **Spare Parts and Services** – Aftermarket products, servicing
3. **JLR Sales** – Luxury vehicle sales globally
4. **Finance and Leasing** – Through Tata Motors Finance
5. **EVs and Government Contracts** – Especially for electric buses and defense
---
#### 🌐 **7. Geographic Presence**
* **India:** Dominant in both commercial and passenger vehicle markets
* **Europe, UK, China, North America:** JLR operations and exports
* **Africa, Middle East, South Asia:** Key export markets for commercial vehicles
---
#### 🤝 **8. Customer Segments**
* Individual car buyers (urban and rural)
* Transport and logistics companies
* Government and defense institutions
* Fleet operators and ride-sharing services
* Global premium car buyers (JLR customers)
---
#### 📞 **9. Channels**
* Authorized dealers and showrooms
* Tata Motors’ digital platforms and mobile apps
* Export agents and overseas distributors
* Tata Motors Finance and leasing services
* Government and institutional contracts
---
#### 🏭 **10. Cost Structure**
* Manufacturing and raw materials
* R\&D for EVs and smart technologies
* Marketing and sales
* Supply chain and logistics
* Employee compensation and dealer incentives
---
#### 🛡️ **11. Competitive Advantages**
* **First-mover in EVs** in India
* **Wide product range** (from mini trucks to luxury SUVs)
* **Strong distribution network**
* **Affordable ownership and service costs**
* **Backed by Tata Group’s ecosystem and trust**
---
#### 🧭 **12. Future Strategy**
* **Aggressive EV expansion** with dedicated Tata.ev brand
* **Digital transformation** across sales and service
* **Sustainability** in production (net-zero carbon goals)
* **Global expansion** through JLR and CV exports
* **Smart mobility platforms** and connected vehicle tech
---
### 📊 Summary (Business Model Canvas Snapshot)
| Key Partners | Key Activities | Value Propositions | Customer Relationships | Customer Segments |
| -------------------------------------------- | -------------------------- | ------------------------------------- | ------------------------------------------- | --------------------------------------------------- |
| Suppliers, Dealers, Finance Arms, Tata Group | Manufacturing, R\&D, Sales | Affordable, Safe, Innovative Vehicles | Sales Support, Aftermarket Service, Finance | Individuals, Businesses, Governments, Global Buyers |
| Key Resources | Channels | Cost Structure | Revenue Streams |
| -------------------------------- | ------------------------------------------ | ------------------------------ | -------------------------------------------- |
| Plants, Workforce, IP, JLR, R\&D | Dealers, Digital, Exports, Govt. Contracts | Manufacturing, R\&D, Marketing | Vehicle Sales, Services, Parts, Finance, JLR |
---
Thanks & Regards
Mohinder Singh
The Golden Farms of Equity
TATAMOTORS trade ideas

Management and psychology in Trading Trading psychology is the emotional component of an investor's decision-making process, which may help explain why some decisions appear more rational than others. Trading psychology is characterized primarily by the influence of both greed and fear. Greed drives decisions that might be too risky.

Divergence SecretsDivergence trading identifies potential trend reversals or continuations by comparing price action with technical indicators. When an asset's price moves in one direction, but a related indicator moves in the opposite direction, it suggests a possible shift in momentum. Traders can use this information to spot potential entry points for trades.

TATAMOTORS ready to give 100 points upsideW pattern in Weekly TF.
RSI divergence along with strength.
Presently at resistance & may consolidate for a few more days.
immediate target of 780.

Option TradingIn trading, an option is a contract that gives the holder the right, but not the obligation, to buy or sell an underlying asset (like a stock, ETF, or commodity) at a predetermined price (the strike price) before a specific date (the expiration date). There are two main types: call options (the right to buy) and put options (the right to sell).

TATAMOTORS DOUBLE BOTTOM BREAKOUTTatamotors giving double bottom reversal breakout
if suatain can reach to 780-820
breaking above levels will give more upside
good RSI,RSIdivergence
good volume building up
DO YOUR OWN RESESARCH BEFORE INVESTING

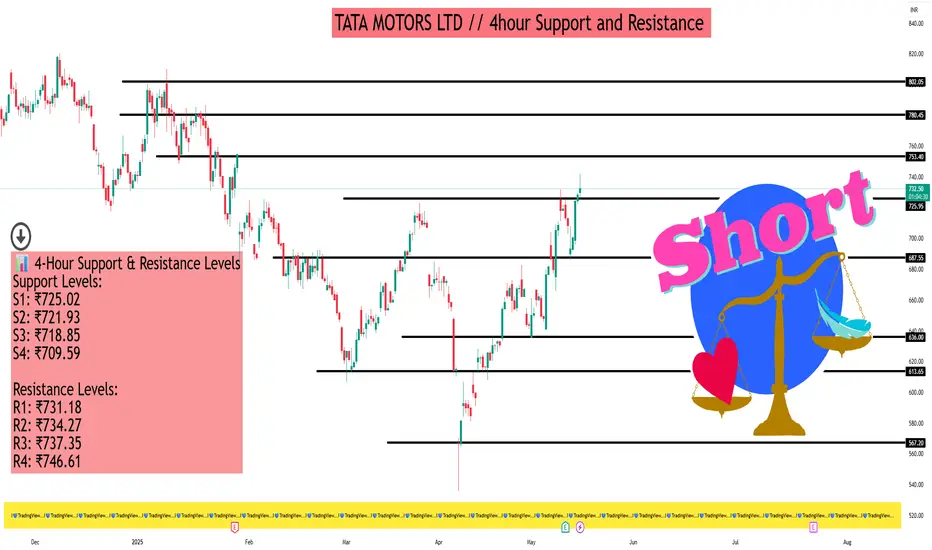
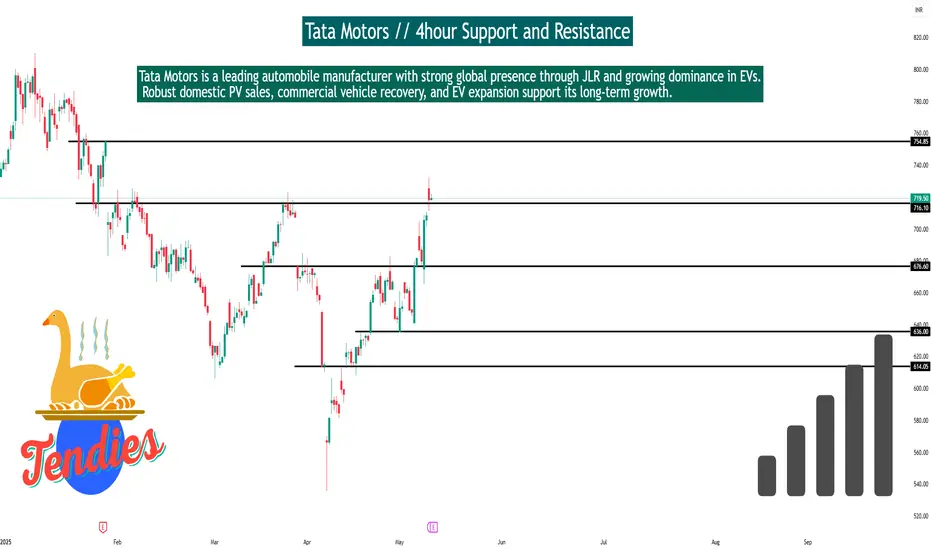
TATA MOTORS LTD // 4hour Support and Resistance As of May 16, 2025, Tata Motors Ltd. (NSE: TATAMOTORS) is trading at approximately ₹735.00. Here's a detailed analysis of its support and resistance levels on the 4-hour timeframe, along with insights from technical indicators and chart patterns.
📊 4-Hour Support & Resistance Levels
Support Levels:
S1: ₹725.02
S2: ₹721.93
S3: ₹718.85
S4: ₹709.59
Resistance Levels:
R1: ₹731.18
R2: ₹734.27
R3: ₹737.35
R4: ₹746.61
These levels are derived from Camarilla pivot calculations and provide key price points where the stock may experience buying or selling pressure.
📈 Technical Indicators Overview
Relative Strength Index (RSI): 68.4 — approaching overbought territory, suggesting potential for a short-term pullback.
MACD (12,26): 8.69 — indicates bullish momentum.
Average Directional Index (ADX): 42.07 — reflects a strong trend strength.
Stochastic Oscillator: 76.29 — nearing overbought levels, which may signal a potential reversal.
Commodity Channel Index (CCI): 103.31 — suggests the stock is in a strong uptrend.
These indicators collectively point towards a bullish trend, but caution is advised due to overbought signals.
🔍 Chart Patterns & Price Action
Recent analyses indicate that Tata Motors has formed a Shark pattern, with potential resistance in the ₹850 to ₹900 range. Short-term targets include ₹700, ₹750, ₹780, ₹820, ₹860, and ₹900. A weekly candle close above ₹900 could signal further upside potential.
Additionally, Elliott Wave analysis suggests that the stock may have completed a Wave (5) near ₹1180, with a potential decline towards the ₹850 level as part of a corrective phase.
🧭 Trading Strategy Insights
Bullish Scenario: If the stock sustains above ₹737.35 (R3), it may target higher resistance levels, with ₹746.61 (R4) being a key level to watch.
Bearish Scenario: A break below ₹725.02 (S1) could lead to further downside, with support at ₹709.59 (S4) potentially being tested.
Advanced Divergence Strong divergence is the most reliable type of divergence, often signaling a significant reversal. It occurs when the price makes a new high or low, but the indicator fails to do so, indicating weakening momentum.

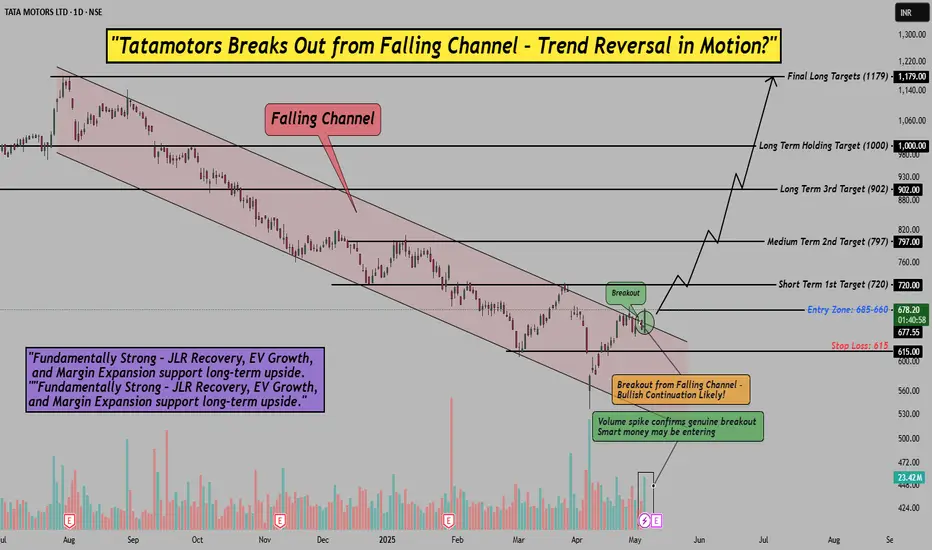
Tata Motors Breakout from Falling Channel – Trend Reversal SetupHello everyone i hope you all will be doing good in your life and your trading as well. Today i have brought a stock name Tata Motors which has broken out of a falling channel after a long consolidation period, and it looks like a potential trend reversal is in motion. The volume surge confirms a genuine breakout, indicating that smart money may be entering at this level. This is an exciting opportunity for both short and long-term traders.
The stock’s fundamentals remain strong , with JLR recovery , EV growth , and margin expansion supporting the long-term upside potential. I’m eyeing an entry range of 685-660 , with a stop loss at 615.00 . Let’s monitor this breakout closely and watch for further confirmation.
Disclaimer: This analysis is for educational purposes only. Please consult a financial advisor before making investment decisions.
If you found this helpful? Don’t forget to like, share, and drop your thoughts in the comments below.
Tata motors - Trendline BreakoutTata Motors gave a Trendline Breakout today. This trendline was unviolated since 29th AUG,24.
Hopefully, now Tata Motors will turnaround and start its upward journey.
The stock is trading above its 11 and 22 DEMA. RSI is at 52.
Interesting Fact - During the Kargil War of 1999 between India and Pakistan, Tata Motors rose 92%.
Disclaimer: This is not a buy/sell recommendation. For educational purpose only. Kindly consult your financial advisor before entering a trade.

Tata Motors // 4hour Support and ResistanceTata Motors Futures – 4-Hour Timeframe Support & Resistance
Technical Structure:
Trend: Bullish with steady upward channel
Current Price: ~₹1,070
Support Levels:
₹1,045 – recent swing low
₹1,020 – 50-EMA zone & prior demand area
Resistance Levels:
₹1,085 – immediate resistance
₹1,110 – upper trendline & breakout zone
Outlook:
Holding above ₹1,045 keeps momentum positive. Break above ₹1,085 can fuel a rally toward ₹1,110+. Watch price action near support for intraday trade setups.
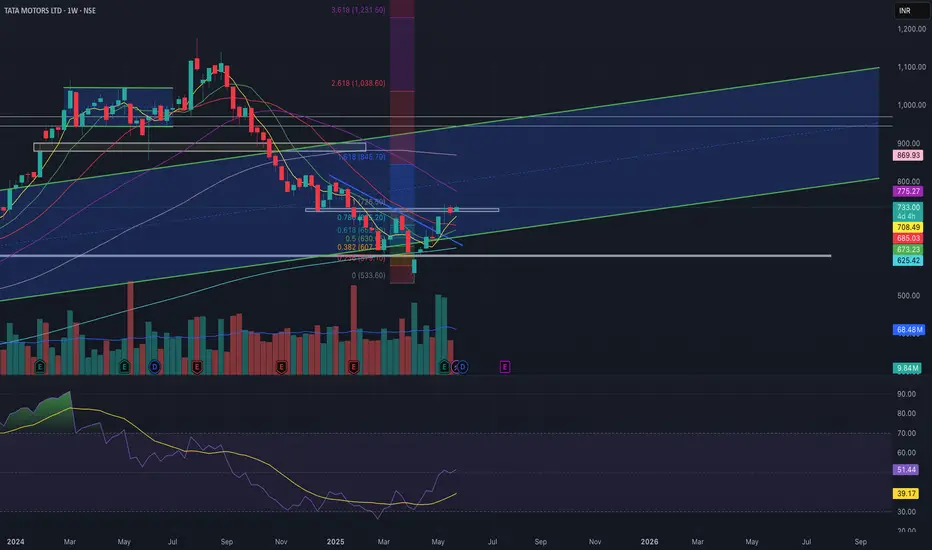
TATA MOTORS – Textbook CT Breakout on Weekly Chart🔍 Key Technical Highlights:
✅ CT Breakout: Clean break above a long-standing counter-trendline drawn from the November 2024 highs. The breakout is decisive, with the latest weekly candle closing convincingly above the CT.
✅ Volume Confirmation: Weekly volume surged to ~9M, confirming strong participation behind the breakout — a critical condition for higher timeframe setups.
✅ Simple Base at 200 EMA: Price formed a simple base right at the 200-week EMA, absorbing selling pressure and building strength before the breakout. This acts as a reliable launchpad, often seen in high-quality setups.
✅ EMA Recovery: The breakout candle reclaims the 200 EMA, a strong sign of trend reversal and institutional interest.

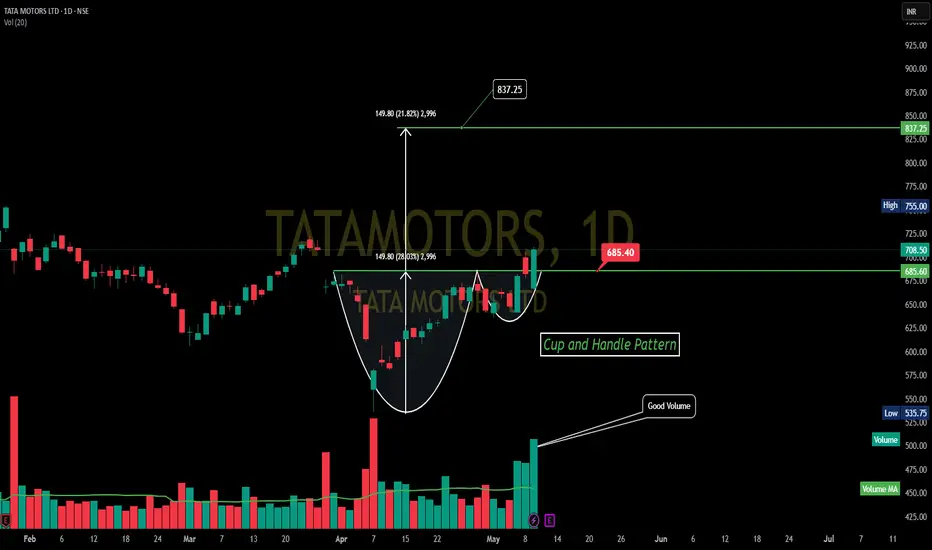
Tata Motors BREAKOUT! Cup & Handle Pattern Tata Motors Ltd (TATAMOTORS) as of May 10th, 2025.
Here's a technical analysis:
Prior Downtrend: The stock was in a downtrend from approximately November 2024 until late March/early April 2025, with the low around 535.75.
Cup and Handle Pattern: A "Cup and Handle" pattern is clearly identified on the chart. This is typically a bullish reversal or continuation pattern.
Cup: Formed from roughly early April 2025 to early May 2025. The bottom of the cup is around the 535.75 low.
Handle: A small, slightly downward-drifting consolidation (the handle) formed in early to mid-May 2025.
Neckline/Breakout Level: The resistance level or neckline of this pattern is around 685.40. The price has broken out above this neckline.
Volume:
The chart annotates "Good Volume" during the formation of the right side of the cup and especially on the breakout from the handle. An increase in volume during a breakout is a positive sign and adds validity to the pattern.
Support and Resistance:
Immediate Support: The breakout level around 685.40 (the neckline) should now act as a key support level.
Major Support: The low of the cup around 535.75 is a more significant support level.
Resistance/Target: The chart indicates a potential target of 837.25. This target is calculated by adding the depth of the cup (approximately 149.80 points) to the breakout level of the neckline.
Recent High: The chart also shows a "High" marked at 886.75, which seems to be a much earlier high (likely before the period shown in detail for the cup and handle) and would act as a longer-term resistance if the price moves significantly beyond the pattern's target.
Interpretation:
The chart for Tata Motors suggests a bullish outlook following the breakout from the Cup and Handle pattern.
The "Good Volume" accompanying the breakout adds strength to this bullish signal.
The stock has successfully surpassed the neckline resistance at 685.40.
The primary target based on this pattern is 837.25.
It's important for the price to hold above the 685.40 support level to maintain the bullish momentum. A fall back below this level could weaken the immediate bullish outlook.
Disclaimer: This technical analysis is for educational purposes only and should not be considered as financial advice. Trading and investing in the stock market involve risks. Always conduct your own thorough research and consult with a qualified financial advisor before making any investment decisions.
Sources and related content
TATAMOTORS - Long for 15 %valuation is decent at current price level
after falling for 8 months, price acion is showing trend reversal
sequence of change is marked with numbers in chart
price crossed 18 day EMA and defended it thrice
on friday , price bounced from 18&50 day EMA crossing pivot level with a wite marbozu
expecting 15 % run in 1 month
target and SL marked

Option and Database Trading Options data providers collect specific data points that can later be used to determine price movements over time. These price changes in the stock market help investors and brokers decide which stocks might be ideal to sell or buy given current market conditions.

Institutional Trading part 5Institutional traders are defined as traders who engage in the buying and selling of securities for the accounts that they manage for any institution or a group of people. Some of the most common examples of institutional traders are mutual funds, pension funds, insurance companies, and exchange-traded funds. These institutional traders are capable of investing in securities that are generally not available for retail traders. These securities include both swaps and forwards

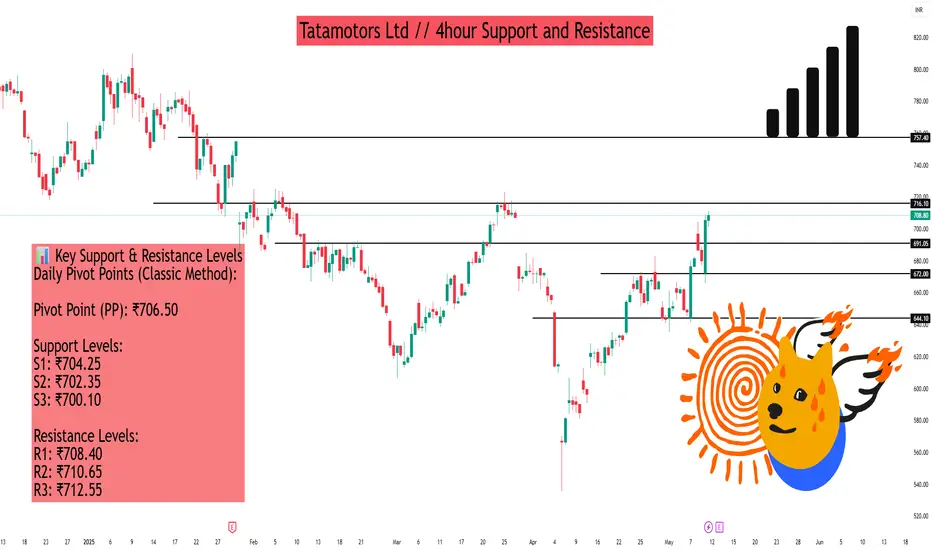
Tatamotors Ltd // 4hour Support and ResistanceAs of May 9, 2025, Tata Motors Ltd. (NSE: TATAMOTORS) closed at ₹736.10. While specific 4-hour support and resistance levels are not directly available, we can infer key levels based on daily and weekly pivot points, which are often utilized by traders for short-term analysis.
📊 Key Support & Resistance Levels
Daily Pivot Points (Classic Method):
Pivot Point (PP): ₹706.50
Support Levels:
S1: ₹704.25
S2: ₹702.35
S3: ₹700.10
Resistance Levels:
R1: ₹708.40
R2: ₹710.65
R3: ₹712.55
Weekly Pivot Points (Classic Method):
Pivot Point (PP): ₹732.62
Support Levels:
S1: ₹686.88
S2: ₹662.77
S3: ₹617.03
Resistance Levels:
R1: ₹756.73
R2: ₹802.47
🔍 Observations
The current price of ₹736.10 is above the daily pivot point, suggesting a bullish short-term trend.
Immediate resistance is observed near ₹740.17 (Daily R2), while support is around ₹724.33
On a weekly scale, the stock is trading near the pivot point of ₹732.62, indicating potential consolidation.
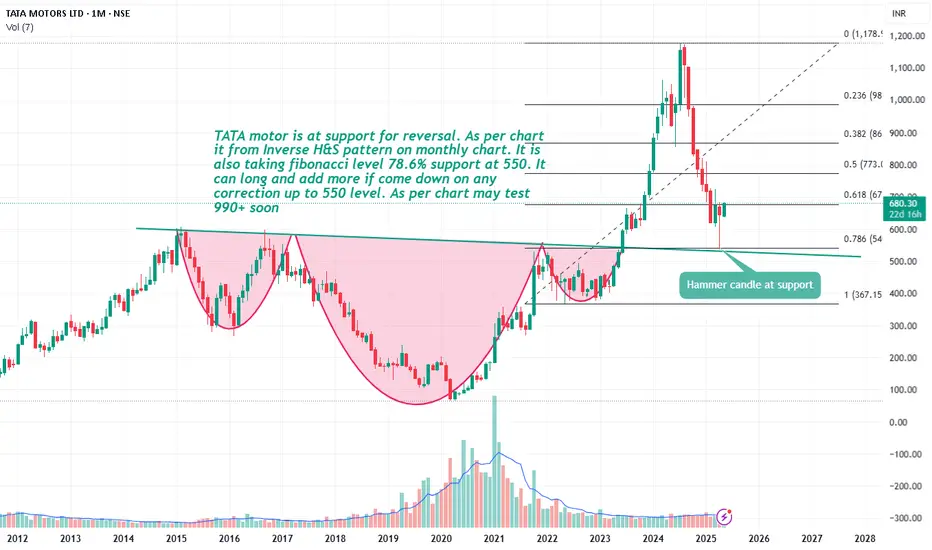
Tata motor long on any correction.TATA motor is at support for reversal. As per chart it from Inverse H&S pattern on monthly chart. It is also taking fibbonacci level 78.6% support at 550. It can long and add more if come down on any correction up to 550 level. As per chart may test 990+ soon.
Tata Motors Ltd //1day Supoort and ResistanceAs of May 3, 2025, here are the key 1-day support and resistance levels for Tata Motors Ltd (NSE: TATAMOTORS):
📊 1-Day Support and Resistance Levels
Level Price (₹) Type
Support 1 703
Support 2 690
Support 3 683
Resistance 1 724
Resistance 2 731
Resistance 3 744
These levels are derived from the classic pivot point method and are crucial for traders to monitor, as movements beyond these points may indicate potential changes in the stock's trend.
🔍 Technical Indicators
As of the latest available data:
Relative Strength Index (RSI): 47.9, indicating neutral momentum.
Stochastic RSI: 0.33, suggesting a downtrend.
Commodity Channel Index (CCI): 32.01, reflecting neutral momentum.
Money Flow Index (MFI): 65.42, indicating an uptrend.
These indicators suggest a neutral to slightly bullish outlook for the stock.
📈 Strategy Considerations
Bullish Scenario: If the stock price maintains above the support levels, particularly Support 1 at ₹703, it may continue its upward movement towards Resistance 1 at ₹724.
Bearish Scenario: A drop below Support 1 could signal a potential reversal or consolidation phase.
Please note that these levels are based on historical data and should be used in conjunction with other technical analysis tools and market conditions.

Tata motor sign of correction.As per chart analysis stock is trading in LL & LH pattern. It is facing resistance at 78.6%.
Candle pattern showing evening star pattern which is sign correction. It may test 580 soon.

TataMotors - 45% Discount from PeakTata motors , a premier automobile company has fallen for 50% from peak and now available at 45% discount. study the stock for following reasons.
No 1 Indian Auto companies in terms of Market Share
Price to Earning < 10
Dividend yield .47%
Operating Profit Margin > 10%
34% Share Holding by institution
Disclaimer: please study and take any investment decision after consulting your financial advisor

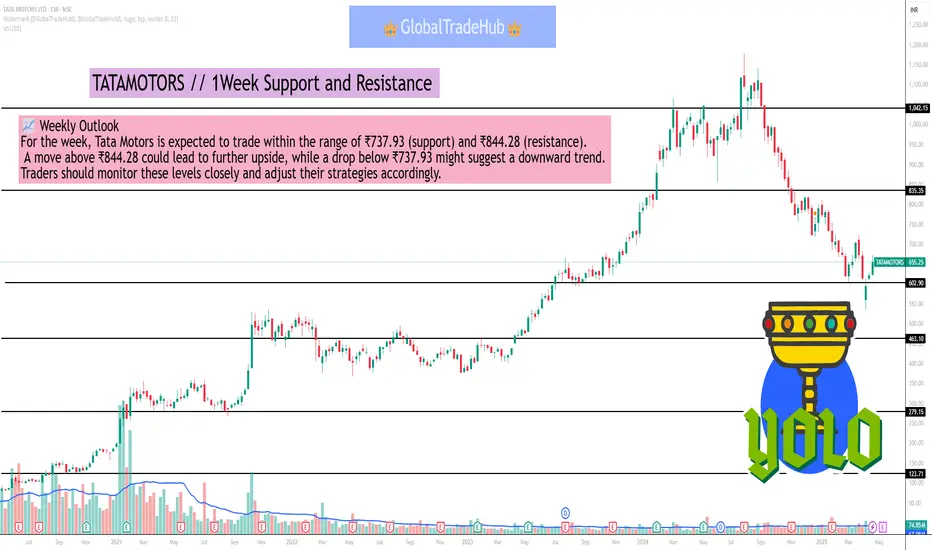
TATAMOTORS // 1Week Support and Resistance As of the latest available data, here are the key support and resistance levels for Tata Motors Ltd. (TATAMOTORS) for the upcoming week:
📊 Weekly Support and Resistance Levels
Type Level Value (₹)
Support S1 773.38
S2 756.47
S3 737.93
Resistance R1 808.83
R2 827.37
R3 844.28
These levels are derived from technical analysis and serve as potential entry, exit, or stop-loss points for traders. A breach below the support levels could indicate a bearish trend, while a breakout above the resistance levels may signal a bullish move.
🔍 Technical Indicators Overview
RSI (14): 43.38 — Indicates neutral momentum.
MACD (12,26): 0 — Suggests a neutral trend.
Moving Averages:
20-day SMA: 655.61 — Slightly below current price, indicating a potential short-term downtrend.
50-day SMA: 655.34 — Aligns with the 20-day SMA, reinforcing the neutral to bearish outlook.
200-day SMA: 655.93 — Further confirms the downtrend.
📈 Weekly Outlook
For the week, Tata Motors is expected to trade within the range of ₹737.93 (support) and ₹844.28 (resistance). A move above ₹844.28 could lead to further upside, while a drop below ₹737.93 might suggest a downward trend. Traders should monitor these levels closely and adjust their strategies accordingly.