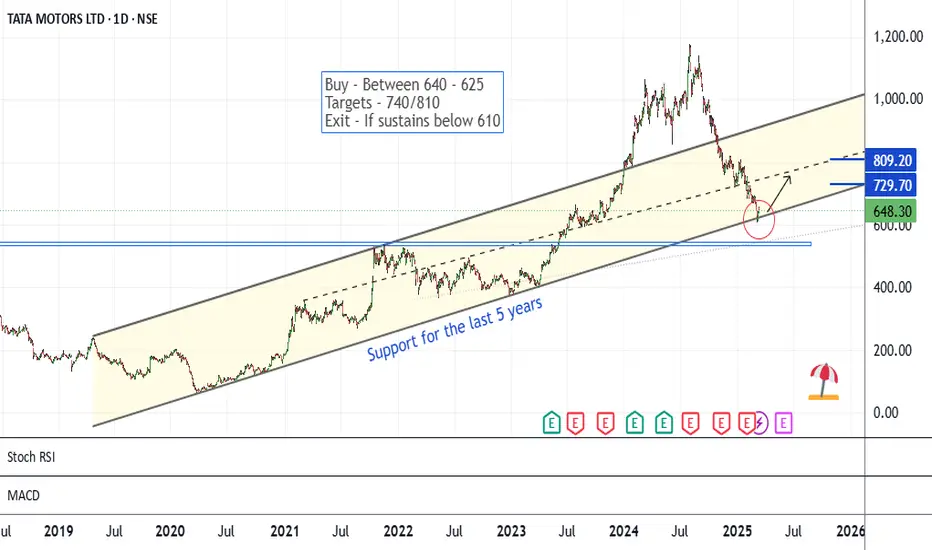
Tata Motors - Simple Long SetupThe chart is self-explanatory. The price has been travelling in a higher high-higher low pattern for the last 5 years. This time comes to the lower levels.
In the recent 5-6 sessions, it has shown a bounce back.
If momentum continues, a bullish move may be seen ahead.
The risk-reward ratio is quite good for positional trading at these levels.
If it sustains below 610 levels on a closing basis for 2-3 days, the setup will lose significance.
All these illustrations are only for learning and sharing purposes; it is not a buy or sell recommendation.
All the best.
TATAMOTORS trade ideas
Very good investment opportunity in TATAMOTORSTatamotors is in monthly demand zone which has a very good logout. And it is also retesting the important level of 606 which was stocks high in year 2015. Retest of that level was pending which has happened now and it has also given a very good weekly candle closing. We can target 70% returns in this stock. Trade with proper risk management

Tata Motors and an Expanded FlatAn expanded flat is an ABC pattern where wave B is three waves and wave C can be 1.618 times A. But in this example, wave C is much larger. Even then I have tried to mark the weekly chart as ABC expanded flat because of the internal wave structure in 3-3-5

what is support and resistance ?# **What is Support and Resistance?**
**Support and Resistance** are key price levels where buying or selling pressure is strong, influencing price movement.
## **1️⃣ Understanding Support & Resistance**
✅ **Support:** A price level where demand is strong, preventing further decline.
✅ **Resistance:** A price level where supply is strong, preventing further rise.
## **2️⃣ How to Use Them in Trading**
✅ **Breakout Trading:** Price breaking resistance → **Buy**, breaking support → **Sell**.
✅ **Reversal Trading:** Price bouncing off support → **Buy**, rejecting resistance → **Sell**.
✅ **Multiple Tests Strengthen Levels:** The more a level is tested, the stronger it becomes.
### **Conclusion**
Support and Resistance help traders **identify entry-exit points, stop-loss levels, and trend reversals**, making them crucial for market analysis. 🚀

Tata Motor 15 minWave 3 Extension: Wave 3 appears extended, as is common in Elliott Wave patterns. This strengthens the impulse count.
Wave 4 Complexity: The exact nature of Wave 4 is crucial. A deeper correction would invalidate the current count.
Potential Wave 5 Target: If Wave 5 materializes, we can use Fibonacci to project potential price targets.
Indicators: The MACD and Williams %R are showing some divergence, which could be an early warning sign of a potential reversal or continuation of the trend. However, these indicators should be used in conjunction with price action and wave patterns.

Key ₹600 Support in Focus Amid Tesla's Potential India EntryTata Motors appears to have key support around ₹600, with no strong buying interest visible until that level. A pullback to test support is likely before any sustained upward movement.
The ongoing U.S.-India tariff negotiations add to uncertainty, particularly for the EV sector. If Tesla secures entry into the Indian market with favourable terms, it could intensify competition, potentially disrupting domestic players like Tata Motors. In such a scenario, Tata Motors' stock could see a sharp correction, possibly retesting the ₹300 levels if investor sentiment turns bearish.
Key levels to watch:
- Support: ₹600 (short-term), ₹300 (major downside risk)
- Resistance:₹750-₹800
Bullish View on Tata MotersAccumulate Tata Motors Starts 600-650
**Tata Motors** is one of India's largest automobile manufacturers and a key player in the global automotive industry. It is a part of the **Tata Group** and produces a wide range of vehicles, including passenger cars, commercial vehicles, and electric vehicles (EVs).
### **Key Details About Tata Motors:**
- **Founded**: 1945
- **Headquarters**: Mumbai, Maharashtra, India
- **Chairman**: N. Chandrasekaran
- **CEO & MD**: Shailesh Chandra (for Passenger Vehicles & EVs)
- **Stock Listing**:
- **NSE**: TATAMOTORS
- **BSE**: 500570
### **Major Business Segments**:
1. **Passenger Vehicles (PV)** – Tata Tiago, Nexon, Harrier, Safari, etc.
2. **Commercial Vehicles (CV)** – Trucks, buses, and defense vehicles.
3. **Electric Vehicles (EVs)** – Tata Nexon EV, Tiago EV, Tigor EV.
4. **Luxury Cars** – Owns **Jaguar Land Rover (JLR)**, a UK-based premium car brand.
### **Recent Performance & Updates**:
- Tata Motors has seen **strong growth** in the EV segment, with Nexon EV leading the Indian market.
- The company's **commercial vehicle** segment continues to dominate in India.
- **Jaguar Land Rover (JLR)** is a key revenue driver in international markets.
- Recently, Tata Motors announced plans to expand **EV production** and invest heavily in sustainable mobility.
Would you like a **live stock price update** for Tata Motors? 🚗📈

Good News On Charts For TATA Motor Share Holder No Short Pls !### **Tata Motors Company Profile**
#### **Overview**
Tata Motors Limited is a leading global automobile manufacturer and a part of the **Tata Group**, one of India's largest conglomerates. Established in **1945**, Tata Motors has grown to become a key player in both **commercial and passenger vehicle** segments, with a presence in over **125 countries**. The company is headquartered in **Mumbai, India**.
#### **Key Details**
- **Founded**: 1945
- **Headquarters**: Mumbai, Maharashtra, India
- **CEO**: **Shailesh Chandra** (for passenger vehicles & EVs), **Girish Wagh** (for commercial vehicles)
- **Parent Company**: Tata Group
- **Subsidiaries**: Jaguar Land Rover (JLR), Tata Daewoo, Tata Technologies
- **Stock Listings**: NSE & BSE (India), NYSE (Previously listed)
- **Revenue**: ₹4.38 lakh crore (approx. $52.6 billion) (FY 2023-24)
- **Employees**: Over 80,000
#### **Product Portfolio**
Tata Motors manufactures a wide range of vehicles, including:
✅ **Passenger Vehicles** – Tata Nexon, Harrier, Safari, Tiago, Tigor, Altroz
✅ **Electric Vehicles (EVs)** – Tata Nexon EV, Tiago EV, Tigor EV, Punch EV
✅ **Commercial Vehicles** – Trucks, Buses, Pickups, and Defense Vehicles
✅ **Luxury Vehicles** – Jaguar & Land Rover (JLR, UK-based subsidiary)
#### **Global Presence**
Tata Motors exports its vehicles to markets across **Europe, Latin America, Africa, the Middle East, and Southeast Asia**. The **Jaguar Land Rover (JLR)** division has a strong presence in the **UK, USA, China, and Europe**.
#### **Recent Developments**
🔹 **EV Leadership**: Tata Motors is the market leader in India's EV segment, with over **75% market share**.
🔹 **Battery Manufacturing**: Investing **$1.5 billion** in a battery gigafactory to strengthen its EV ecosystem.
🔹 **SUV Boom**: SUVs account for over **56% of Tata Motors' passenger vehicle sales**.
🔹 **Financial Performance**: Reported **₹54.51 billion** profit in Q3 FY24, a **22% decline** due to JLR and domestic market challenges.
#### **Future Plans**
✔ Expansion in the **electric vehicle** segment with advanced battery technology.
✔ Strengthening **global presence** by expanding JLR and commercial vehicle exports.
✔ Investment in **sustainable mobility**, including hydrogen fuel cell vehicles.
Would you like more details on any specific area? 🚗

Tata Motors Stock Analysis – Critical Support at ₹600Alright, let’s break this down. Tata Motors (NSE: TATAMOT) is currently trading at a mental support level of ₹600, a crucial zone where buyers have stepped in before. But here’s the big question – will it hold, or are we heading straight to the ₹400 range?
Current Market Structure
CMP: ₹619.70
Trend: Clear Downtrend (Lower Highs & Lower Lows)
Major Support: ₹600 (Mental Support & S2)
Next Support if Broken: ₹400 (2021 September Range)
Resistance to Watch: ₹700-₹750
We’ve seen the stock respecting this downtrend channel, and as long as it remains within this range, the bearish pressure stays strong.
Key Technical Breakdown
1. Trading at a Critical Support – ₹600
This ₹600 level is not just any number; it’s a psychological support where we’ve seen strong demand in the past. Right now, the price is sitting on this zone, but there’s no strong bullish confirmation yet.
If ₹600 holds, we could see a bounce toward ₹700-₹750.
But if ₹600 breaks, we are looking at ₹400 next—which was the 2021 September range, a key accumulation zone.
2. Downtrend Channel – No Signs of Reversal Yet
The stock has been making consistent lower highs and lower lows, indicating sellers are still in control.
Until we see a breakout above ₹700-₹750, this trend remains intact.
If the channel continues to hold, the price could slowly grind down toward ₹400 in the coming weeks.
3. MACD & Momentum – Bears Still in Control
Looking at the MACD, the momentum remains weak:
MACD line is still below the signal line—a clear bearish trend.
The histogram is red, confirming that there’s no buying pressure yet.
A crossover or a shift in momentum is needed before any bullish move.
Trade Strategy – What to Do Now?
Bearish Setup (If ₹600 Breaks Down)
Entry: Below ₹600
Target: ₹400 (2021 Accumulation Zone)
Stop-Loss: ₹650
Bullish Reversal (If ₹600 Holds & ₹700 Breaks)
Entry: Above ₹700-₹750
Target: ₹850-₹900
Stop-Loss: ₹650
Right now, we are at a make-or-break level. If buyers step in, we get a bounce. But if not, the next strong demand zone sits around ₹400, a level last seen in September 2021.
Keep an eye on volume and price action. A breakdown below ₹600 with strong volume could accelerate the fall. But a strong bounce from here could give a short-term relief rally.
This analysis is for educational and informational purposes only and should not be considered financial advice. Trading and investing involve risk, and you should do your own research or consult a financial advisor before making any decisions. The stock market is volatile, and past performance does not guarantee future results. Trade responsibly.

TATA MOTORS Price is at imp level
If closing sustains in weekly candle below 795 then it could dump more to the green flag marked on the chart or to the price 586 within 20th Jan 2025 or 17th Feb 2025
If closing in weekly candle sustains above 810 then could test 916 level or to the red trend line .
Disclaimer:
It's a personal view not a financial advice and I assume no responsibility and liability whatever outcome arises.

Tata motors entering buy zone at 540Buy tata motor below 600 in the range of 540 to 600 for the target of 850

Tata motors long term trend History repeats itself. I believe tata motors should follow this pattern before correcting massively. A double top followed by deep correction.

Tatamotors targetit is in final stage of correction of this 5 wave decline.
it can slip below 600 to 595-594.
can be start accumulating there if you are an investor
in a staggard manner.
As we don't know wthether fresh down ward move will emerge or not.
Please like this post if it helps you.
follow me to get updates

History is going to repeat the same ?Previously it as given a fake breakout and took 7 to 8 years to reach back at same level, is History going to repeat the same ?? Pattern indicates same as previous one.

Retest of trendline or again fakeIn 2013 to 2017 done a fake breakout and given a huge fall till 2020, Is it going to repeat same??
Or Restest is going to happen (long term Investers need to be cautions) untill the bullish sign appears.

Tata Motors Date 26.02.2025
Tata Motors
Timeframe : Weekly
Technical Remarks :
1 A confluence of support by 200 weekly exponential moving average + support trendline + 5% of Fibonacci & lowering rsi
2 The area near 50% of Fibonacci is also previous double top important resistance zone
3 Based on Elliot wave corrective concept wave 4 don't goes below of wave 2 under retracement of 3 wave pattern
4 Looks like good accumulation zone to me for swing trade
Other Key Points :
Company has reduced debt.
Company has delivered good profit growth of 93.1% CAGR over last 5 years
Promoter holding has decreased over last 3 years: -3.83%
Tata motors currently has operations in India, the UK, South Korea, South Africa, China, Brazil, Austria and Slovakia through a strong global network of subsidiaries, associate companies and Joint Ventures (JVs), including Jaguar Land Rover in the UK and Tata Daewoo in South Korea
Key Values
PE Ratio 7.65
ROCE 20 %
ROE 49 %
OPM 11%
Sales Growth (Q-O-Q) 2.71%
EPS 14.81 (quarterly standalone basis)
FII 18.66 %
DII 16.85 %
Public 21.91 %
Promoter 42.58 %
Regards,
Ankur

TataMotors stock longTata Motors Ltd. is a leading Indian multinational automotive manufacturing company, renowned for its diverse range of vehicles, including passenger cars, trucks, and buses. Here's a comprehensive analysis of its current situation:
**Fundamental Analysis:**
- **Financial Performance:**
- **Profit After Tax (PAT):** In the fiscal year ending March 31, 2024, Tata Motors reported a Return on Equity (ROE) of 36.97%, significantly outperforming its five-year average of -1.07%.
- **Revenue Growth:** The company achieved a three-year Compound Annual Growth Rate (CAGR) of 20.47% in revenue, with an annual growth of 26.61% in the year ending March 31, 2024.
- **Cost Management:** In the same fiscal year, Tata Motors allocated 2.28% of its operating revenues towards interest expenses and 9.7% towards employee costs.
- **Market Position:**
- Tata Motors holds a 31% market share in the Medium and Heavy Commercial Vehicle (M&HCV) segment and a 20% share in the Light Commercial Vehicle (LCV) segment as of FY24.
- **Valuation Metrics:**
- **Price-to-Earnings (P/E) Ratio:** The P/E ratio stands at 34.96, indicating a premium valuation compared to the industry average.
- **Price-to-Book (P/B) Ratio:** The P/B ratio is 5.55, reflecting a significant premium over the peer median of 3.53.
- **Analyst Ratings:**
- The consensus target price for Tata Motors is ₹1,067.45, suggesting a potential upside of approximately 60% from the current market price.
**Technical Analysis:**
- **Current Share Price:** As of February 24, 2025, the share price is ₹668.25.
- **Support and Resistance Levels:**
- **Support Level:** The immediate support is around ₹650, with a stronger support zone near ₹600.
- **Resistance Level:** The immediate resistance is near ₹700, with a stronger resistance around ₹750.
- **Price Performance:**
- Over the past month, the stock has declined by approximately 11.90%. citeturn0search4
- Over the past year, the stock has decreased by about 28.49%.
**Recent Developments:**
- On February 24, 2025, Tata Motors' share price hit a 52-week low of ₹666, reflecting broader market trends and sector-specific challenges.
- Tesla has reportedly been seeking to recruit top talent from Tata Motors to establish its operations in India, indicating potential competitive pressures in the Indian automotive market. citeturn0search13
**Conclusion:**
Tata Motors has demonstrated strong financial performance, particularly in revenue growth and profitability. However, the stock is currently trading at a premium valuation, and recent market volatility has impacted its share price. Investors should monitor the company's strategic initiatives, including talent acquisition and market expansion efforts, as well as broader economic factors influencing the automotive industry.

what is Advance level divergence based trading ?**SkyTradingZone** is your go-to source for educational content on trading, covering market insights, strategies, and in-depth analysis. Our goal is to empower traders with knowledge to navigate the markets effectively.
---
# **Advanced Level Divergence-Based Trading**
## **1️⃣ What is Divergence in Trading?**
Divergence occurs when the **price action** and a **technical indicator** (such as RSI, MACD, or Stochastic) move in opposite directions. It signals a **potential trend reversal** or **continuation**, depending on the type of divergence.
📌 **Types of Divergences:**
✅ **Regular Divergence** → Signals a trend reversal.
✅ **Hidden Divergence** → Signals trend continuation.
### **Common Indicators Used for Divergence:**
- **Relative Strength Index (RSI)**
- **Moving Average Convergence Divergence (MACD)**
- **Stochastic Oscillator**
- **CCI (Commodity Channel Index)**
---
## **2️⃣ Types of Advanced Divergences**
### 🔹 **1. Regular Divergence (Reversal Signal)**
Occurs when **price makes a new high/low, but the indicator fails to follow**.
✅ Suggests **momentum weakening** → Possible **trend reversal**.
📌 **Bullish Regular Divergence (Buy Signal)**
- Price makes **lower lows**, but RSI/MACD makes **higher lows**.
- Indicates **bearish momentum is weakening** → **Trend reversal to the upside.**
📌 **Bearish Regular Divergence (Sell Signal)**
- Price makes **higher highs**, but RSI/MACD makes **lower highs**.
- Indicates **bullish momentum is weakening** → **Trend reversal to the downside.**
---
### 🔹 **2. Hidden Divergence (Trend Continuation Signal)**
Occurs when **price makes a higher high/lower low, but the indicator does not confirm**.
✅ Suggests **trend continuation** → Ideal for riding the existing trend.
📌 **Bullish Hidden Divergence (Buy Signal)**
- Price makes **higher low**, but RSI/MACD makes **lower low**.
- Indicates the **uptrend is strong** → Buy the dip.
📌 **Bearish Hidden Divergence (Sell Signal)**
- Price makes **lower high**, but RSI/MACD makes **higher high**.
- Indicates the **downtrend is strong** → Sell the rally.
---
## **3️⃣ Advanced Divergence-Based Trading Strategies**
### **📌 Strategy 1: MACD Divergence with Histogram Confirmation**
✅ Use **MACD Histogram** to confirm divergence signals.
✅ Look for a **cross-over** of the MACD line and signal line.
**Example Setup:**
- **Price forms a higher high** → **MACD forms a lower high** (Bearish Divergence).
- **MACD Histogram shrinks** → Confirms weakening momentum.
- **Sell entry** when MACD crosses below the signal line.
---
### **📌 Strategy 2: RSI Divergence with Trendline Break**
✅ Use **RSI Divergence** to confirm potential reversals.
✅ Combine with **trendline breaks** for precise entry points.
**Example Setup:**
- **Price forms a lower low**, but **RSI forms a higher low** (Bullish Divergence).
- **Price breaks above trendline resistance** → Entry confirmation.
- **Stop-loss below the recent swing low.**
---
### **📌 Strategy 3: Multi-Timeframe Divergence Trading**
✅ Use **higher timeframe divergence** to confirm lower timeframe trades.
**Example Setup:**
1. Check **Daily Chart** for divergence.
2. Confirm on **1-Hour Chart** → Enter a position based on intraday structure.
3. Take profits at key resistance/support levels.
---
## **4️⃣ Live Example: Nifty Divergence Analysis**
| **Date** | **Price Action** | **RSI** | **MACD Histogram** | **Trade Signal** |
|---------|----------------|-------|------------------|---------------|
| Feb 10 | Higher High | Lower High | Decreasing | Bearish Divergence (Sell) |
| Feb 12 | Lower Low | Higher Low | Increasing | Bullish Divergence (Buy) |
📌 **Observation:**
- **Bearish divergence on Feb 10** → Market dropped 200 points.
- **Bullish divergence on Feb 12** → Market bounced back.
---
## **5️⃣ Mistakes to Avoid in Divergence Trading**
⚠️ **Ignoring Price Structure** – Confirm divergence with trendlines & support/resistance.
⚠️ **Overtrading Divergences** – Not every divergence leads to a big move.
⚠️ **Neglecting Volume & Breakout Confirmation** – Check volume before entering trades.
---
## **Conclusion**
Advanced divergence trading helps traders **identify high-probability reversal and continuation trades**. By combining **MACD, RSI, and multi-timeframe analysis**, traders can refine their entries and improve trade accuracy.
In future lessons, we will cover:
✅ **Live Divergence Trading with Real Charts**
✅ **How to Combine Divergence with Fibonacci Retracements**
✅ **Building a Divergence-Based Trading System**
Stay tuned for more insights!
---
🔹 **Disclaimer**: This content is for educational purposes only. *SkyTradingZone* is not SEBI registered, and we do not provide financial or investment advice. Please conduct your own research before making any trading decisions.

Buy reversal can happen from these levels These levels will act as support for tata motors , you can see a good up move from these level and target levels are also there. Enjoy the bull ride soon

TATAMOTORS: Reversal Possible?1. The setup is exactly similar to the one I post earlier from JSW ENERGY.
2. The price is coming doen to the demand and then we plan for the entry based on the price structure shift.
⚠️ Disclaimer: This is NOT a buy/sell recommendation. This post is meant for learning purposes only. Views are personal. Please, do your due diligence before investing.⚠️
💬 Drop your thoughts below in the comments section if you liked this analysis!✌️
🔥Happy Trading!✅🚀

learn option trading and become profitable ?Learning **options trading** and becoming profitable involves understanding several key concepts, strategies, and risk management techniques. It’s a skill that requires time, practice, and the ability to control emotions. Here's a step-by-step guide to get started and increase your chances of profitability in options trading:
---
### **Step 1: Understand the Basics of Options**
Before jumping into trading, you need to grasp the fundamental concepts of options:
1. **What Are Options?**
- **Call Option**: A contract that gives you the right (but not the obligation) to **buy** a stock at a specific price (strike price) before a certain expiration date.
- **Put Option**: A contract that gives you the right (but not the obligation) to **sell** a stock at a specific price before a certain expiration date.
2. **Key Terms**:
- **Strike Price**: The price at which the option holder can buy (for calls) or sell (for puts) the underlying asset.
- **Expiration Date**: The date the option expires. After this date, the option is no longer valid.
- **Premium**: The price paid for the option, which is a combination of intrinsic value and time value.
- **In-the-Money (ITM)**: When the option has intrinsic value. For call options, it means the stock price is above the strike price. For put options, it means the stock price is below the strike price.
- **Out-of-the-Money (OTM)**: When the option has no intrinsic value. For calls, the stock price is below the strike price. For puts, the stock price is above the strike price.
- **At-the-Money (ATM)**: When the stock price is equal or close to the strike price.
---
### **Step 2: Learn Different Option Strategies**
Options trading offers a variety of strategies. Start by learning basic strategies before moving on to more advanced ones:
1. **Basic Strategies**:
- **Buying Calls**: Used when you expect the price of the underlying asset to rise.
- **Buying Puts**: Used when you expect the price of the underlying asset to fall.
- **Covered Call**: Involves owning the underlying stock and selling a call option. It's used to generate income on stocks you already own, especially if you think the stock will not rise significantly.
- **Protective Put**: Buying a put option to protect against a decline in the value of a stock you own (like an insurance policy).
2. **Intermediate Strategies**:
- **Vertical Spreads**: Involves buying and selling options of the same type (calls or puts) with different strike prices but the same expiration. Examples include **bull call spreads** and **bear put spreads**.
- **Straddle and Strangle**: Used when you expect large price movements, but are unsure of the direction. You buy both call and put options on the same asset with the same expiration date.
3. **Advanced Strategies**:
- **Iron Condor**: A strategy involving multiple strikes and different types of options to profit from low volatility in the underlying asset.
- **Butterfly Spread**: A strategy with limited risk and reward, used when you expect low volatility in the asset.
---
### **Step 3: Understand Risk Management**
Options can be highly volatile and risky, so managing risk is crucial. Here are some tips:
1. **Position Sizing**: Never risk more than you can afford to lose. Use position sizing to manage the amount of capital you’re willing to put at risk in any trade.
2. **Use Stop-Loss Orders**: Implement stop-loss orders or exit strategies to limit your losses if the trade goes against you.
3. **Risk-Reward Ratio**: Make sure that for every unit of risk, you're potentially making a greater reward. A common risk-to-reward ratio is 1:3, meaning for every $1 at risk, you should aim for a $3 reward.
---
### **Step 4: Develop a Trading Plan**
A well-structured trading plan is essential for long-term success:
1. **Define Your Goals**: Are you trading options for income, capital appreciation, or hedging? Define your objectives clearly.
2. **Identify Your Trading Style**: Decide if you want to be a day trader (short-term) or a swing trader (medium-term). Your strategy will depend on this.
3. **Stick to Your Strategy**: Avoid impulsive decisions or “chasing” the market. Stick to the rules of your strategy and trade according to your plan.
4. **Keep Records**: Maintain a trading journal to track your trades, profits, losses, mistakes, and successes. This will help you analyze your performance and improve.
---
### **Step 5: Paper Trade First**
Before you risk real money, **practice with a simulated account** (paper trading). Many brokers offer demo accounts where you can practice trading options without real financial risk.
- **Simulate Real Trades**: Execute mock trades with no real capital on the line. This will allow you to familiarize yourself with how options work and test different strategies.
- **Evaluate Results**: After several months of paper trading, evaluate your results and refine your strategies.
---
### **Step 6: Start Trading with Real Money**
Once you’re confident in your strategy and risk management, start trading with real money. Begin with small positions and gradually increase your exposure as you gain experience.
1. **Start Small**: Begin with a small percentage of your capital to minimize the risk while you’re learning.
2. **Focus on Liquid Options**: Trade options with high liquidity to ensure you can enter and exit positions smoothly without significant slippage.
3. **Monitor Volatility**: Volatility can impact option pricing. Keep an eye on volatility metrics like the VIX and adjust your strategies accordingly.
---
### **Step 7: Keep Learning and Improving**
Options trading is a continuous learning process. The more you trade, the better you will get at understanding the nuances of the market.
1. **Study Market Conditions**: Understand how different market conditions (bullish, bearish, sideways) affect option prices.
2. **Stay Updated**: Keep learning through books, online courses, webinars, and forums to improve your skills.
3. **Review and Adapt**: Regularly review your trades and adapt your strategies based on your experiences.
---
### Common Mistakes to Avoid:
- **Overleveraging**: Avoid using too much leverage, as options can be highly risky and you could lose your entire investment quickly.
- **Not Using Stop-Losses**: Don’t let emotions drive your trading. Always use stop-losses to protect your capital.
- **Chasing the Market**: Don’t jump into trades based on FOMO (fear of missing out). Wait for the right setup based on your strategy.
- **Ignoring Implied Volatility**: Always be aware of implied volatility before making option trades, as it impacts option pricing.
---
### Conclusion:
To become profitable in options trading, you need to **understand the fundamentals**, develop a solid **trading plan**, practice with **paper trading**, and apply **risk management** techniques. Start with basic strategies, gradually advance to more complex ones, and always be willing to adapt based on your experiences. The key to success in options trading is continuous learning, patience, and disciplined execution.

CAN TATA MOTORS CHANGE ITS MOMENTUMThe stock has recently experienced a correction of over 60% and is currently testing support near its 200 EMA, a key support level. Historically, the stock has shown a tendency to rebound whenever it approached the 200 EMA. A weekly close above this support zone could signal a potential trend reversal.
