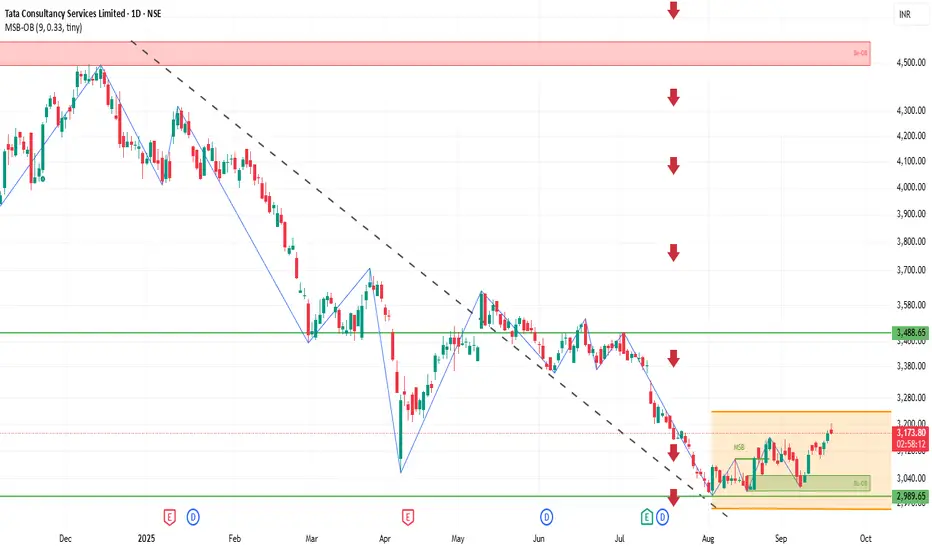
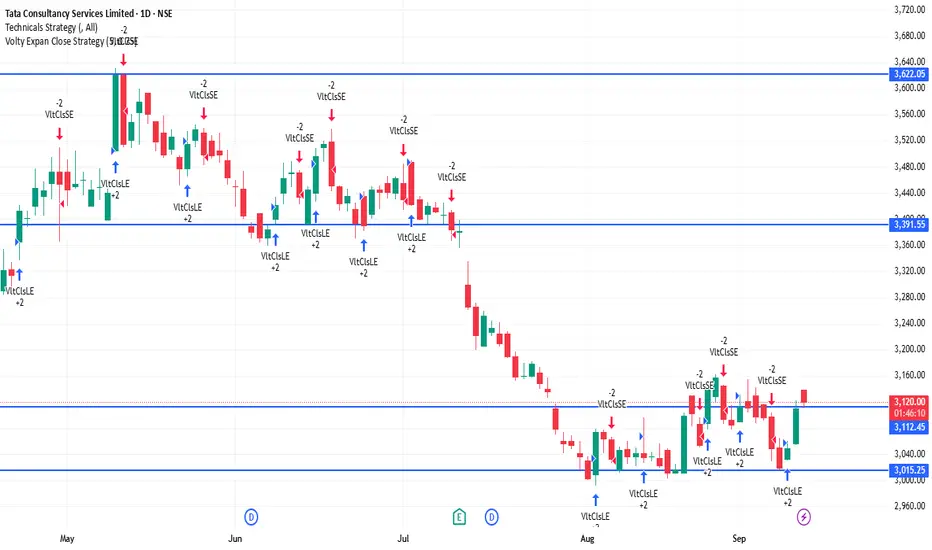
Tcs 52 week low - Today creates a new and fresh 52 week low
- Also breaks 5 Years important support
- expecting this fall may continue
- Next important support 2600 and 2200
Trade ideas
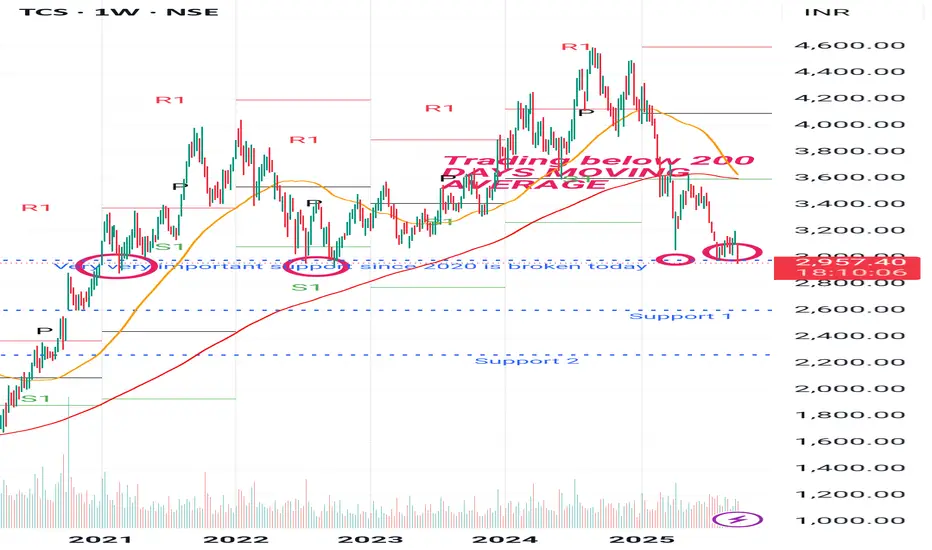
Tcs 52 week low - Trading below 200days moving average
- today breaks 5 years of strong support level 2950
- expecting this fall may continue
- Next support 2600 and 2200
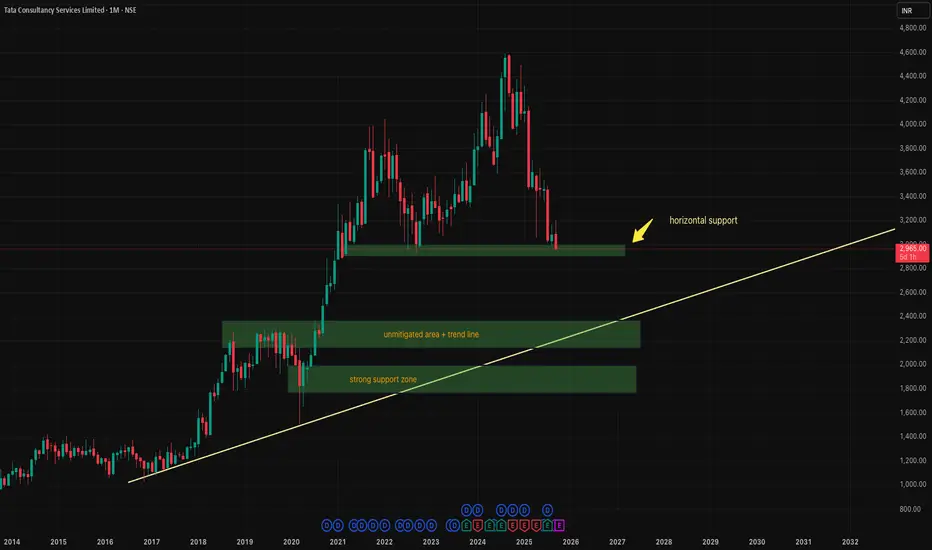
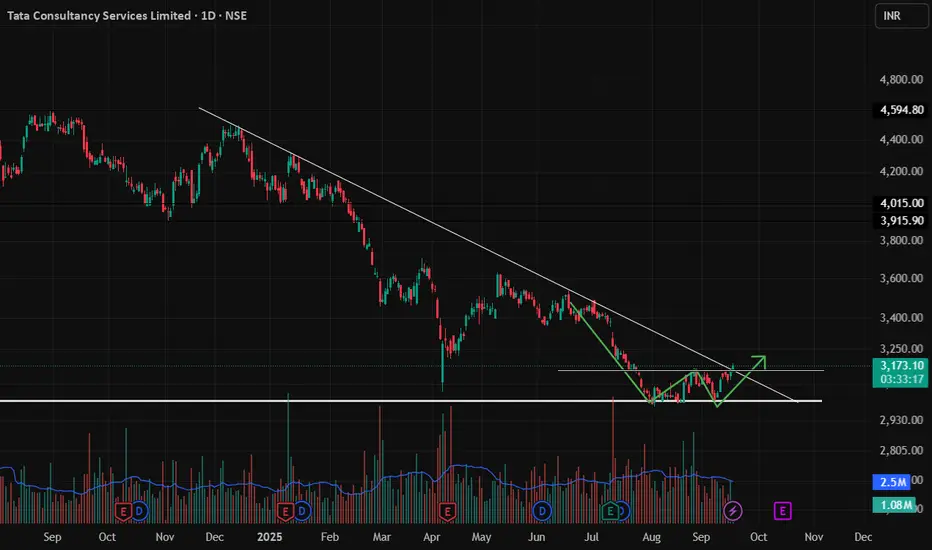
long trade on TCS for positional tradingas there is support on monthly tf we can expect price to rise from there
and if it does not happen there is a trend line and a combination of horizontal support
TCS at Confluence of Resistance / EMA / ST/ GAP/ AVWAP / FIB
Between 3500-3550, TCS could face strong resistance on multiple fronts and they are listed below.
Daily SuperTrend
GAP Zone
50 DEMA at 3540 (retesting it after a long time, expect a rejection)
Fib retracement of 61.8% of the recent swing
Avwap from the recent swing (at 3530)
100% (abc pullback) from the swing low (at 1498)
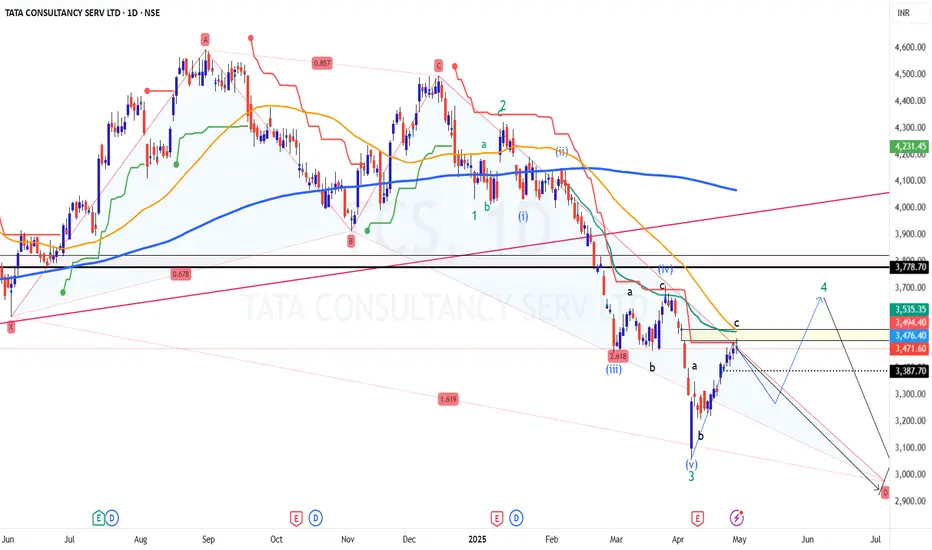
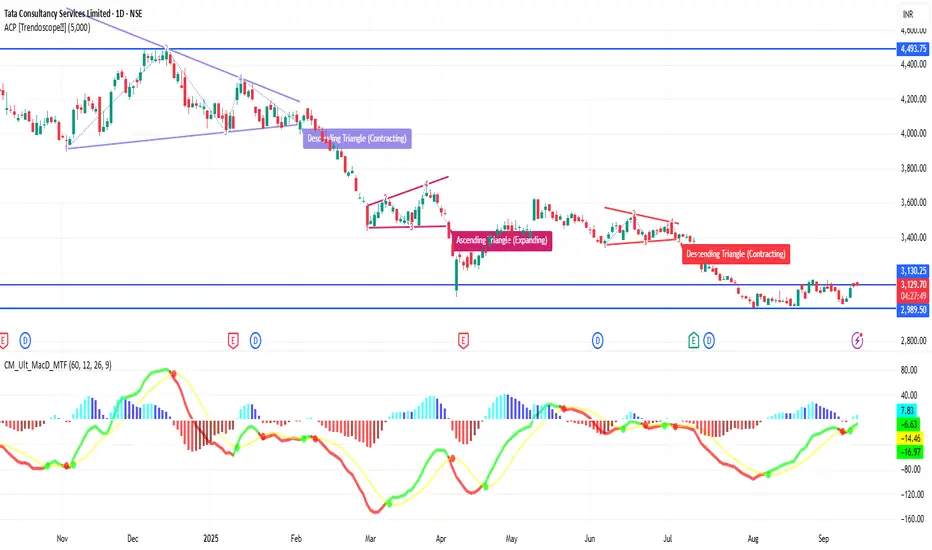
Daily chart with Harmonic pattern, suggests that one more low at 3000 odd levels is due. The same is being observed as per the EW counts
Here is the chart with possible path/count/target destinations
Finally, this is a first bounce after a sharp correction; expect first bounces to be sold in to, similarly, first dip will be bought in to.
In all likelihood, I am not expecting TCS to go up much from here.. expecting a meaningful decline before resuming the upmove.
Disclaimer: I am not a SEBI registered Analyst and this is not a trading advise. Views are personal and for educational purpose only. Please consult your Financial Advisor for any investment decisions. Please consider my views only to get a different perspective (FOR or AGAINST your views). Please don't trade FNO based on my views. If you like my analysis and learnt something from it, please give a BOOST. Feel free to express your thoughts and questions in the comments section.
TCS 1D Time frame📍 Current Price & Range
Current price: ₹3,063.80
Day’s High / Low: ₹3,106.90 / ₹3,052.00
52-week High / Low: ₹4,494.90 / ₹2,991.60
🔍 Key Levels
Immediate resistance: ₹3,100–₹3,110
Next resistance: ₹3,200–₹3,250
Immediate support: ₹3,050–₹3,060
Psychological / strong support: ₹3,000
📊 Indicators & Momentum
Price is just below near-term resistance, showing hesitation.
Short-term trend is neutral to slightly bearish; momentum is weak.
RSI and MACD suggest neutral to weak momentum, no strong reversal yet.
Stock is trading well below its 52-week high, indicating it has already corrected significantly.
🔮 Possible Scenarios
Bullish breakout → Sustaining above ₹3,110 could push price toward ₹3,200–₹3,250.
Sideways / consolidation → Likely to trade between ₹3,050–₹3,110 if no strong catalyst.
Bearish pullback → Breaking below ₹3,050 may take price toward ₹3,000, and further down to ₹2,950–₹2,900 if weakness continues.
👉 Outlook: At the current level (₹3,073.80), TCS is in a neutral zone. The next directional move depends on either a breakout above resistance or a fall below support.
Best Candlestick Patterns for Traders1. Doji Candle
Definition
A Doji candle is formed when the open and close prices are virtually equal, creating a candle with a small or non-existent body and long shadows. The Doji signifies indecision in the market. Neither buyers nor sellers have control, indicating a potential reversal or a continuation depending on context.
Types of Doji Candles
Standard Doji: Equal open and close prices with long upper and lower wicks.
Dragonfly Doji: Small body at the top, long lower shadow. Indicates bullish reversal if found at the bottom of a downtrend.
Gravestone Doji: Small body at the bottom, long upper shadow. Indicates bearish reversal if found at the top of an uptrend.
Long-Legged Doji: Long upper and lower wicks with a tiny body. Shows extreme indecision.
Trading Implications
Appears after strong trends to indicate potential reversals.
Confirmation is critical; traders often wait for the next candle to determine the market’s direction.
Risk management is essential because Doji candles alone do not guarantee a reversal.
Example
Imagine a strong bullish trend; suddenly, a Gravestone Doji appears. This could indicate that buyers are losing control, and a bearish reversal might follow. Traders might consider exiting long positions or preparing for a short opportunity.
2. Engulfing Pattern
Definition
The Engulfing Pattern consists of two candles:
Bullish Engulfing: A small bearish candle followed by a larger bullish candle that completely engulfs the previous candle’s body.
Bearish Engulfing: A small bullish candle followed by a larger bearish candle that engulfs the previous candle.
This pattern signifies a strong shift in market sentiment.
Characteristics
Bullish Engulfing:
Occurs at the bottom of a downtrend.
Indicates buyers taking control.
Bearish Engulfing:
Occurs at the top of an uptrend.
Indicates sellers taking control.
Trading Strategy
Look for significant volume during the engulfing candle for confirmation.
Place stop-loss below the swing low for bullish or above swing high for bearish setups.
Often paired with support and resistance levels for higher accuracy.
Example
During a downtrend, a small red candle is followed by a large green candle engulfing it. This signals that bulls are overpowering bears and a potential trend reversal is imminent.
3. Hammer and Hanging Man
Definition
These patterns have small bodies and long lower shadows. They often signal potential reversals but depend on their placement in the trend:
Hammer: Bullish reversal at the bottom of a downtrend.
Hanging Man: Bearish reversal at the top of an uptrend.
Characteristics
Body is small.
Lower shadow is at least twice the size of the body.
Upper shadow is minimal or absent.
Trading Insights
Hammer:
Appears after a downtrend.
Buyers start to gain momentum.
Confirmation comes from the next bullish candle.
Hanging Man:
Appears after an uptrend.
Sellers might be gaining control.
Confirmation comes from a bearish candle following it.
Example
In an uptrend, a Hanging Man appears. The next candle is red, confirming that sellers are exerting pressure. Traders may look to short or exit long positions.
4. Morning Star and Evening Star
Definition
These are three-candle patterns that indicate trend reversals:
Morning Star: Bullish reversal at the bottom of a downtrend.
Evening Star: Bearish reversal at the top of an uptrend.
Components
Morning Star:
First candle: Large bearish candle.
Second candle: Small-bodied candle (Doji or spinning top) indicating indecision.
Third candle: Large bullish candle closing at least halfway into the first candle’s body.
Evening Star:
First candle: Large bullish candle.
Second candle: Small-bodied candle showing indecision.
Third candle: Large bearish candle closing at least halfway into the first candle’s body.
Trading Approach
Confirm the pattern with volume.
Look for support/resistance levels aligning with the pattern.
Set stop-loss just below the lowest point (Morning Star) or above the highest point (Evening Star).
Example
In a downtrend, a Morning Star appears. The first candle is red, the second a small Doji, and the third a large green candle. This indicates a potential bullish reversal, signaling a long trade setup.
5. Shooting Star and Inverted Hammer
Definition
These patterns are opposite of Hammer and Hanging Man and indicate potential reversals based on trend location:
Shooting Star: Bearish reversal at the top of an uptrend.
Inverted Hammer: Bullish reversal at the bottom of a downtrend.
Characteristics
Small body.
Long upper shadow, at least twice the length of the body.
Minimal or no lower shadow.
Trading Implications
Shooting Star:
Appears after an uptrend.
Suggests bulls are losing control.
Confirmation comes from the next bearish candle.
Inverted Hammer:
Appears after a downtrend.
Suggests buyers are gaining momentum.
Confirmation comes from the next bullish candle.
Example
An uptrend sees a Shooting Star appear. The next candle is red, confirming sellers’ dominance, signaling potential short opportunities.
Conclusion
Candlestick patterns are invaluable tools in technical analysis, helping traders anticipate potential reversals, continuations, and market sentiment shifts. Among the myriad of patterns, the Doji, Engulfing, Hammer/Hanging Man, Morning/Evening Star, and Shooting Star/Inverted Hammer are considered the top 5 due to their reliability and simplicity.
Key Takeaways:
Always use candlestick patterns in context with trend and volume.
Confirmation is crucial; no single pattern guarantees a reversal.
Combine candlestick analysis with other technical tools like support/resistance, moving averages, and RSI for higher probability trades.
Risk management, stop-losses, and position sizing are essential for trading success.
By mastering these top 5 candlestick patterns, traders can gain a powerful edge in analyzing market behavior and making informed decisions.
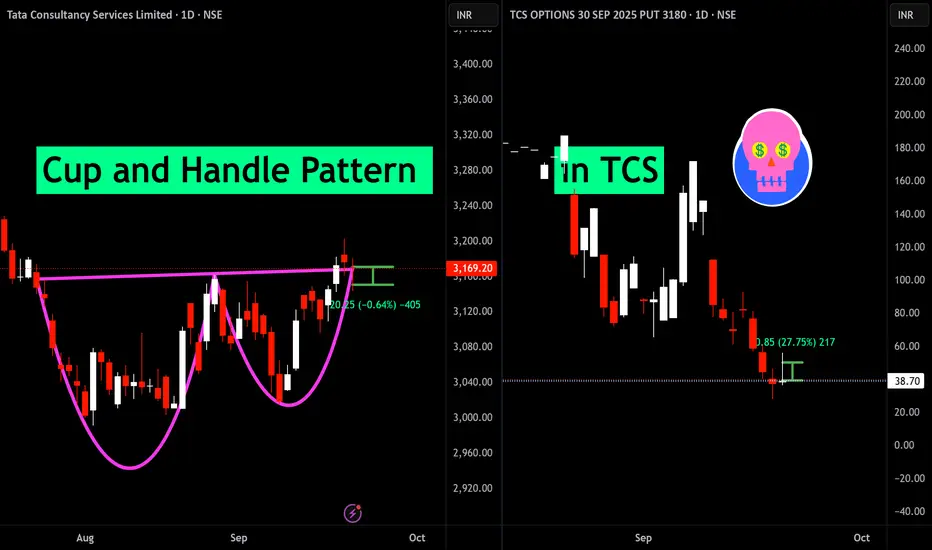
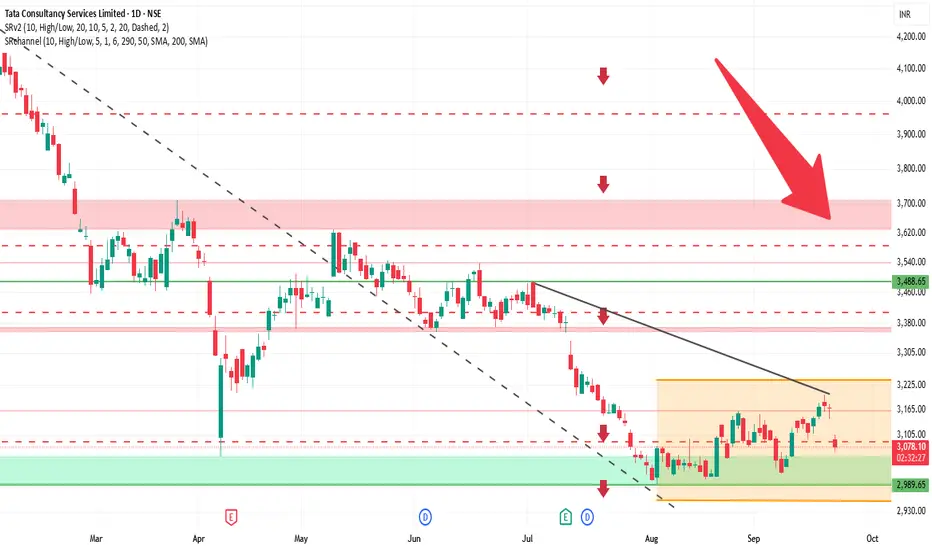
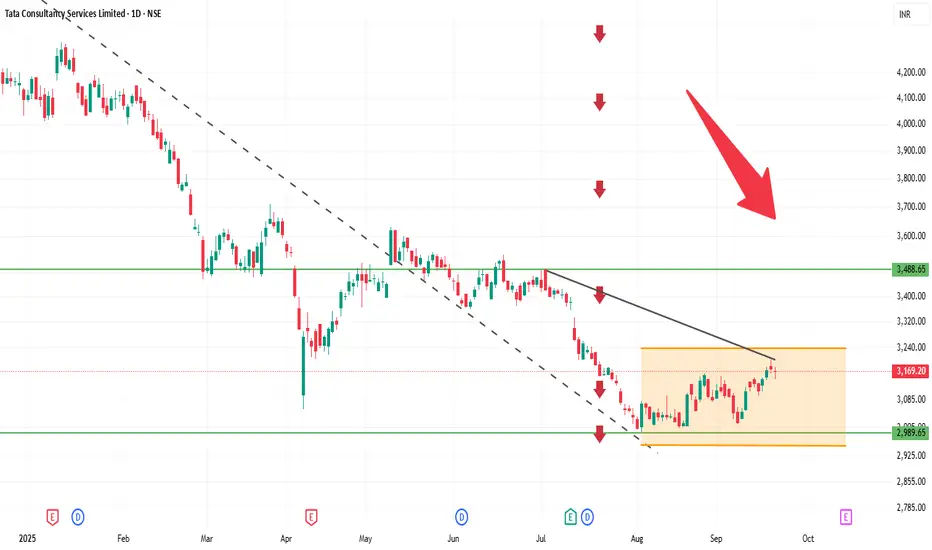
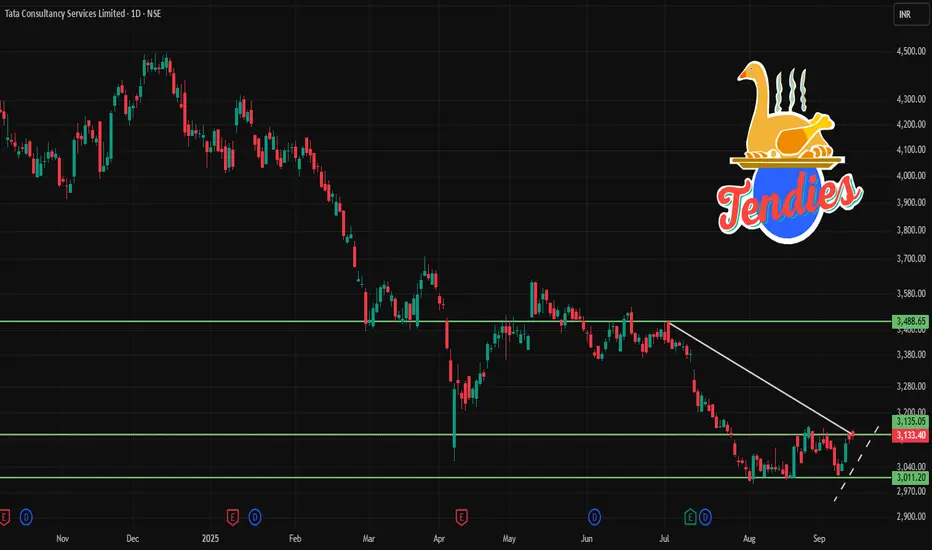
Cup and Handle Pattern failed in TCSThe cup and handle pattern has formed, but the anticipated breakout has not materialized. This failed breakout may indicate the potential for further downside movement in the stock
TCS 1D Time frame🔍 Current Price & Context
Trading around ₹3,089
Day’s range: ₹3,065 – ₹3,107
Previous close: ₹3,171
Market sentiment: Bearish, influenced by external factors affecting IT stocks.
📊 Technical Indicators
Moving Averages: Short-term averages are slightly above current price, acting as resistance.
RSI (14): ~30, indicating oversold conditions.
MACD: Negative, showing bearish momentum.
Stochastic Oscillator: Oversold, may suggest a short-term reversal.
CCI (20): Below zero, confirming bearish trend.
ROC (20): Negative, indicating declining momentum.
🧮 Strategy / Trade Ideas
Long Setup:
Entry near support (~3,050) if bullish reversal appears
Stop Loss: Below 3,000
Targets: 3,100 first, then 3,150
Short / Pullback Setup:
Entry if price fails near resistance (~3,100)
Stop Loss: Above 3,150
Targets: 3,050 first, then 3,000
✅ Summary
TCS on daily chart is bearish but oversold. Watch immediate support (~3,050) for potential reversal, and resistance (~3,100 – 3,120) for pullback risk. A breakout above resistance could target 3,150+, while failure of support may lead toward 3,000.
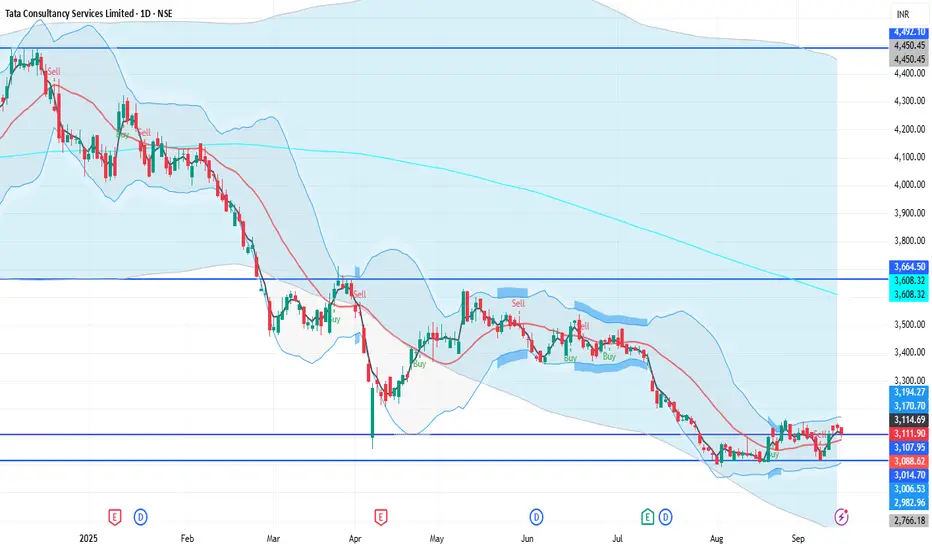
TCS Status Trend Overview
- Long-term uptrend: From 2013 to around 2021, TCS showed a strong bullish trajectory.
- Recent consolidation: Post-2021, the price has been range-bound, suggesting indecision or accumulation.
🔍 Key Technical Insights
1. Fibonacci Levels
These help identify potential support/resistance zones and price targets:
- Current price: ₹3,094 is hovering near the 0.382 retracement level (₹3,059.60), which often acts as a pivot.
- Support zones:
- ₹2,891.10 (0.5 level)
- ₹2,722.60 (0.618 level)
- ₹2,488.35 (0.786 level)
- Upside targets (if bullish momentum resumes):
- ₹3,763.60 (1.618 extension)
- ₹4,191.10 (2.0 extension)
- ₹5,085.10 (2.618 extension)
2. Support Levels
- ₹2,800: A strong horizontal support, tested multiple times.
- ₹2,310: Deeper support, possibly a long-term floor if broader correction occurs.
3. Buy/Sell Signal
- BUY: ₹3,094.00
- SELL: ₹3,091.30
This narrow spread suggests a neutral stance or low volatility at the moment.
4. Trend Line
- The green line likely represents a moving average or trendline support, reinforcing the ₹2,800 zone as a key level to watch.
5. Volume
- Volume bars show participation. Any spike near support/resistance levels can confirm breakout or reversal strength.
🧠 Interpretation for Traders
- Bullish bias if price holds above ₹3,059 and breaks ₹3,263 (0.236 level).
- Bearish risk if price breaks below ₹2,891 and heads toward ₹2,722 or ₹2,488.
- Neutral zone between ₹2,891 and ₹3,263—ideal for range trading or waiting for confirmation.
Would you like me to overlay Gann levels or model a payoff scenario based on this chart? I can also help you build a dynamic dashboard to track these zones live.
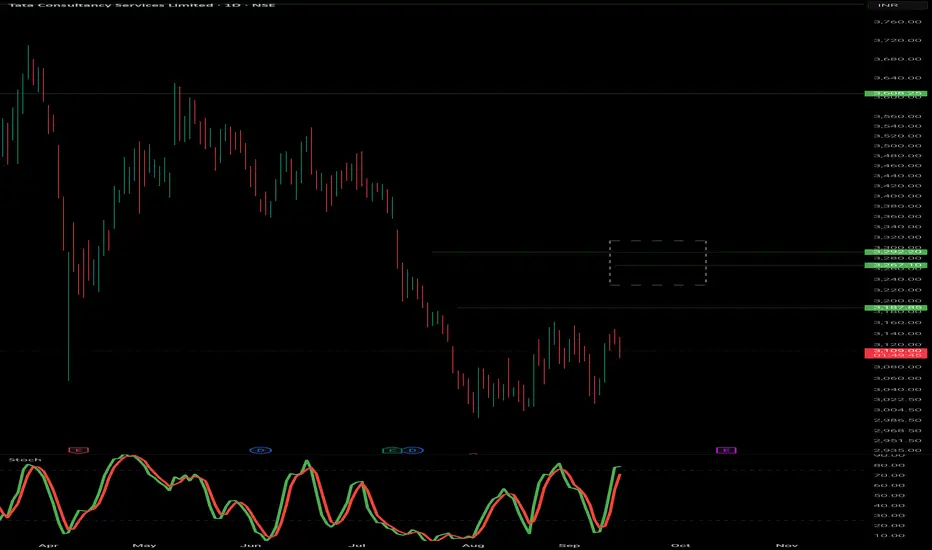
TCS 1D Time frameCurrent Price: Around 3,174
Current Trend: Stock is in a sideways to slightly bullish phase after consolidation.
Support Zone: Strong support at 3,140 – 3,150. Buyers may defend this level.
Resistance Zone: Key resistance at 3,200 – 3,220. A breakout above 3,220 can trigger fresh upside.
Indicators: Daily candles indicate mild buying interest; volume is stable.
Outlook:
Above 3,220 → bullish momentum may extend toward 3,250+.
Below 3,140 → weakness may push toward 3,100–3,120.
👉 In short:
Range: 3,140 – 3,220.
Neutral to slightly bullish; breakout will determine next move.
WAIT FOR PULLBACK 3125Please consult your financial advisor before investing.This is only for learning purpose of chart.
We are NISM certified EQ and MCX trader but not SEBI register investment advisor.
TGT 3490-3530..
SL 2990....
TRY TO GET PRICE < 3130....
TCS 1D Time frameCurrent Snapshot
Price: ₹3,174
Stock has moved above earlier resistance zones (₹3,150 – ₹3,170).
Momentum looks positive, buyers are holding strength.
📌 Key Levels
Immediate Resistance: ₹3,190 – ₹3,200
Next Resistance: ₹3,220 – ₹3,250
Immediate Support: ₹3,150 – ₹3,160
Stronger Support: ₹3,100 – ₹3,120
✅ Outlook
If TCS sustains above ₹3,170, it can extend the rally toward ₹3,200 – ₹3,220.
If it slips back below ₹3,160, consolidation may happen around ₹3,120 – ₹3,150.
Larger trend remains bullish as long as price stays above ₹3,100.
Options Greeks & Advanced Hedging Strategies1. Introduction to Options
Options are derivative instruments that provide the right, but not the obligation, to buy or sell an underlying asset at a predetermined price before or on a specified expiry date. There are two main types:
Call Options – Give the holder the right to buy the underlying asset.
Put Options – Give the holder the right to sell the underlying asset.
Unlike equities, options are inherently more complex because their value is influenced by multiple variables such as underlying price, strike price, time to expiration, volatility, interest rates, and dividends. This multidimensionality is captured by the Greeks, which form the backbone of options risk management.
2. Understanding Options Greeks
The Greeks quantify the sensitivity of an option’s price to various market factors. They are indispensable for assessing risk and structuring trades. The primary Greeks are Delta, Gamma, Theta, Vega, and Rho, each serving a specific purpose.
2.1 Delta (Δ) – Price Sensitivity
Delta measures the rate of change of an option's price with respect to the price movement of the underlying asset.
Call Delta ranges from 0 to 1.
Put Delta ranges from -1 to 0.
Interpretation:
A delta of 0.6 for a call option indicates that if the underlying asset moves up by ₹1, the call option price will increase by ₹0.60.
Traders use delta to gauge the directional exposure of their portfolio, often referred to as delta exposure.
Delta Hedging:
Delta hedging is a strategy where traders neutralize the delta of a position by taking an offsetting position in the underlying asset. For example, if you hold a call option with a delta of 0.6 on 100 shares, you can short 60 shares of the underlying to make the position delta-neutral.
2.2 Gamma (Γ) – Rate of Change of Delta
Gamma measures the rate of change of delta with respect to changes in the underlying asset price.
High Gamma indicates that delta changes rapidly with underlying price movement.
Low Gamma implies delta is stable.
Importance of Gamma:
Gamma is crucial for understanding convexity risk, especially near the option’s expiry or at-the-money options.
Traders use gamma to anticipate how delta hedges will change as the market moves.
Gamma Hedging:
Gamma hedging involves balancing a portfolio such that it remains neutral to delta changes. Typically, it requires frequent adjustments because gamma fluctuates as underlying prices move.
2.3 Theta (Θ) – Time Decay
Theta represents the rate at which an option loses value as time passes, holding other factors constant.
Options are decaying assets, losing value every day due to time erosion.
Call and put options experience negative theta for holders (long positions) and positive theta for writers (short positions).
Applications:
Long options traders must account for theta decay, especially in volatile markets.
Strategies like calendar spreads or selling options exploit theta decay to generate income.
2.4 Vega (ν) – Volatility Sensitivity
Vega measures an option’s sensitivity to changes in implied volatility of the underlying asset.
Options prices increase with higher volatility (for both calls and puts).
Vega is higher for at-the-money options and long-dated options.
Volatility Trading:
Traders can take positions purely on expected volatility changes without relying on directional movement.
Long Vega positions profit from volatility spikes, while short Vega strategies benefit from declining volatility.
2.5 Rho (ρ) – Interest Rate Sensitivity
Rho measures sensitivity to changes in the risk-free interest rate.
More significant for long-term options.
A call option’s price rises with increasing interest rates, while put options decline.
Practical Relevance:
Rho is relatively minor compared to delta or vega but becomes crucial in macroeconomic shifts, especially for options with long maturities.
3. Combining Greeks for Portfolio Management
While each Greek provides specific insights, professional traders consider multiple Greeks simultaneously to manage comprehensive risk. This multidimensional approach allows traders to:
Maintain delta neutrality – minimize directional risk.
Control gamma exposure – manage rapid changes in delta.
Optimize theta decay – benefit from time erosion.
Manage vega risk – protect against volatility shocks.
Monitor rho impact – for long-term interest-sensitive trades.
Example:
A trader holding a long call may delta-hedge by shorting the underlying. If gamma is high, the hedge needs frequent adjustments. Additionally, they must consider theta decay, particularly if the position is near expiry.
4. Advanced Hedging Strategies
Hedging with options is a way to protect portfolios from adverse movements while retaining profit potential. Advanced hedging strategies involve using combinations of options, futures, and the underlying asset.
4.1 Delta Neutral Hedging
Objective: Make a portfolio insensitive to small price movements.
Method: Offset delta of options with underlying asset or other derivatives.
Example: Long call delta of 0.6 → Short 60 shares of the underlying.
Advantages:
Reduces directional risk.
Can be dynamically adjusted to changing deltas.
Limitations:
Frequent rebalancing is required due to gamma exposure.
4.2 Gamma Scalping
Objective: Profit from price swings in the underlying asset while remaining delta neutral.
Method: Buy options with high gamma. As underlying moves, delta changes are hedged dynamically, locking in profits from volatility.
Applications: Used by market makers and professional traders to extract profit from intraday volatility.
4.3 Vega Hedging
Objective: Neutralize exposure to volatility changes.
Method: Offset vega by taking positions in options with opposite volatility sensitivity (e.g., long a call and short a call with different strike prices or maturities).
Applications: Useful during earnings announcements, geopolitical events, or expected market turbulence.
4.4 Calendar and Diagonal Spreads
Calendar Spread: Buy a long-dated option and sell a short-dated option of the same strike.
Diagonal Spread: Combine different strikes and expiries.
Purpose: Exploit theta decay and volatility differences while limiting directional risk.
Example: A trader expecting stable markets but rising volatility may buy a long-term call and sell a near-term call.
4.5 Protective Puts & Collars
Protective Put: Buying a put option to safeguard a long stock position.
Collar: Combining a protective put with a covered call to limit downside while capping upside.
Applications: Hedging large equity positions during uncertain markets.
4.6 Ratio & Backspread Strategies
Ratio Spread: Buy/sell unequal number of options to balance cost and risk.
Backspread: Sell a small number of near-term options and buy a larger number of far-term options.
Use Case: Profitable in high volatility expectations, providing leveraged exposure with hedged downside.
5. Greeks-Based Risk Management
A sophisticated options trader actively monitors Greeks to:
Adjust positions dynamically – react to price, time, and volatility changes.
Measure risk-reward tradeoffs – understand potential loss in extreme scenarios.
Stress-test portfolios – simulate scenarios like sharp price jumps or volatility spikes.
Optimize hedging costs – reduce capital expenditure while maintaining protection.
Conclusion
Options Greeks are the foundation for advanced options trading and risk management. Understanding delta, gamma, theta, vega, and rho enables traders to quantify risk, structure trades, and implement sophisticated hedging strategies. By combining these metrics with advanced approaches like delta neutral hedging, gamma scalping, vega hedging, spreads, and collars, traders can protect portfolios against adverse movements while seizing opportunities in volatile markets.
For Indian traders, these strategies are highly relevant in indices like Nifty, Bank Nifty, and sectoral options, as well as in individual stocks. Mastery of Greeks and hedging not only enhances risk management but also opens avenues for strategic income generation, volatility trading, and portfolio optimization.
In an increasingly complex and volatile market environment, leveraging Options Greeks and advanced hedging strategies is no longer optional—it is essential for any serious options trader aiming for consistent, risk-adjusted returns.
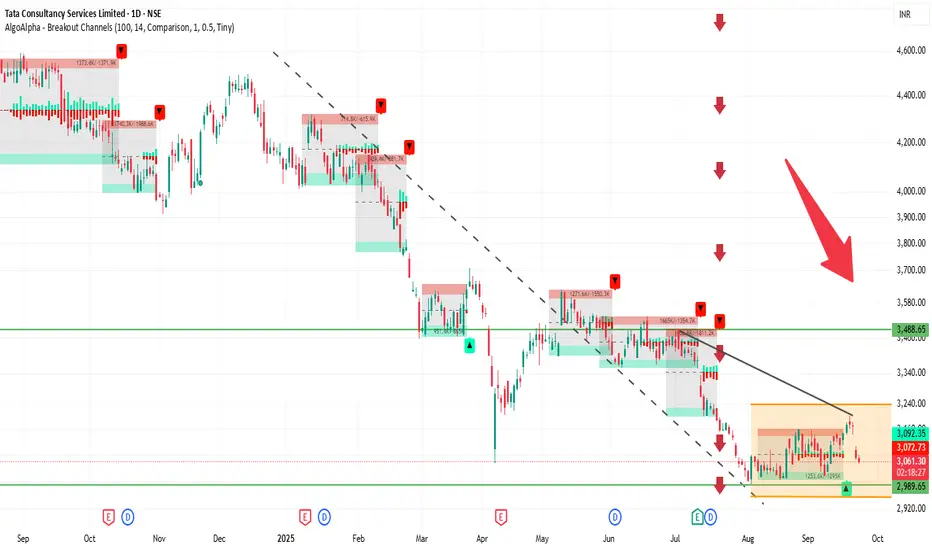
TCS Breaking outPrice consolidating near resistance after a strong base formation. A breakout above this zone may trigger momentum towards higher levels.
TCS BIG DADDY OF IT Please consult your financial advisor before investing.This is only for learning purpose of chart.
We are NISM certified EQ and MCX trader but not SEBI register investment advisor.
HOLD FOR 18-24 MONTH 4800-4900 TGT....

TCS 1D Time framePrice Action
Current Price: ₹3,111.60
Previous Close: ₹3,124.20
Day’s Range: ₹3,096 – ₹3,134
52-Week Range: ₹2,991.60 – ₹4,546.05
🔹 Support & Resistance
Support 1: ₹3,096
Support 2: ₹3,050 – ₹3,060
Resistance 1: ₹3,134
Resistance 2: ₹3,150 – ₹3,160
TCS on bullishBuy @ CMP -3108
Stoploss - 3030.75
Target - 3230.20
3267.10
3315.00
Follow me for update on the calls.
Maintain stoploss strictly
Happy Trading
Jai Hind
TCS 1D Time frame📉 Current Market Snapshot
Closing Price: ₹3,133.40
Day's Range: ₹3,121.00 – ₹3,148.70
52-Week High: ₹4,547.00
52-Week Low: ₹2,991.60
Market Cap: ₹11,21,000 crore
P/E Ratio (TTM): 22.8
Dividend Yield: 1.93%
Book Value: ₹262
ROE: 52.4%
Debt-to-Equity Ratio: 0.10
EPS (TTM): ₹136.19
Face Value: ₹1.00
TCS 1D Time frame🔢 Current Level
~ ₹3,131
🔑 Key Resistance & Support Levels
Resistance Zones:
~ ₹3,160 – ₹3,180 (near-term resistance)
~ ₹3,200 – ₹3,220 (stronger resistance above)
Support Zones:
~ ₹3,120 – ₹3,100 (immediate support)
~ ₹3,050 – ₹3,000 (secondary support)
~ ₹2,900 (deeper support if weakness intensifies)
📉 Outlook
Bullish Scenario: If TCS holds above ~ ₹3,120 and manages to break past ~ ₹3,180 – ₹3,200, there is potential to move toward ~ ₹3,220+
Bearish Scenario: A drop below ~ ₹3,100 could lead to a slide toward ~ ₹3,050 or lower
Neutral / Range: Between ~ ₹3,100 – ₹3,180, TCS may consolidate until a clearer breakout or breakdown
TCS 1D Time frame🔢 Current Level
Trading around ₹3,125 – ₹3,135
🔑 Key Resistance & Support Levels
Resistance Zones:
₹3,138 – ₹3,153 (near-term resistance; breakout above this may lead to further upside)
₹3,167 (stronger resistance above)
Support Zones:
₹3,095 – ₹3,110 (immediate support)
₹3,080 (stronger support if price dips further)
₹3,050 – ₹3,060 (deeper support zone)
📉 Outlook
Bullish Scenario: If TCS holds above ₹3,110, upward momentum may continue. Break above ₹3,153 can open the way toward ₹3,167+.
Bearish Scenario: If it falls below ₹3,080, risk increases toward ₹3,050.
Neutral / Range: Between ₹3,110 – ₹3,153, TCS may consolidate before a directional move.
TCS 1D Time framePrice Action (Daily Chart)
Current price is around ₹3,117 - ₹3,120
Price is consolidating near support zones after a recent upward move.
Candle structure shows buying interest at lower levels, but resistance is capping the upside.
📊 Indicators
Moving Averages (MA):
Short-term MAs (5-day, 10-day) are slightly mixed.
Medium to long MAs (20, 50, 100, 200-day) are in buy zone, showing broader uptrend strength.
RSI (14-day): ~62-65 → indicates mild bullish momentum, not yet in overbought zone.
MACD: Shows positive crossover, momentum favors bulls but losing some strength.
⚖️ Key Levels
Immediate Resistance: ₹3,135 – ₹3,140
Next Resistance: ₹3,170 – ₹3,200
Immediate Support: ₹3,100 – ₹3,110
Strong Support: ₹3,050 – ₹3,000
📈 Outlook
Short-term sentiment: Neutral to slightly bullish as long as price holds above ₹3,100.
A breakout above ₹3,140 may open room toward ₹3,170–₹3,200.
A breakdown below ₹3,100 may drag price to ₹3,050–₹3,000.
Overall trend on daily timeframe is still uptrend, but near resistance, so caution is needed.
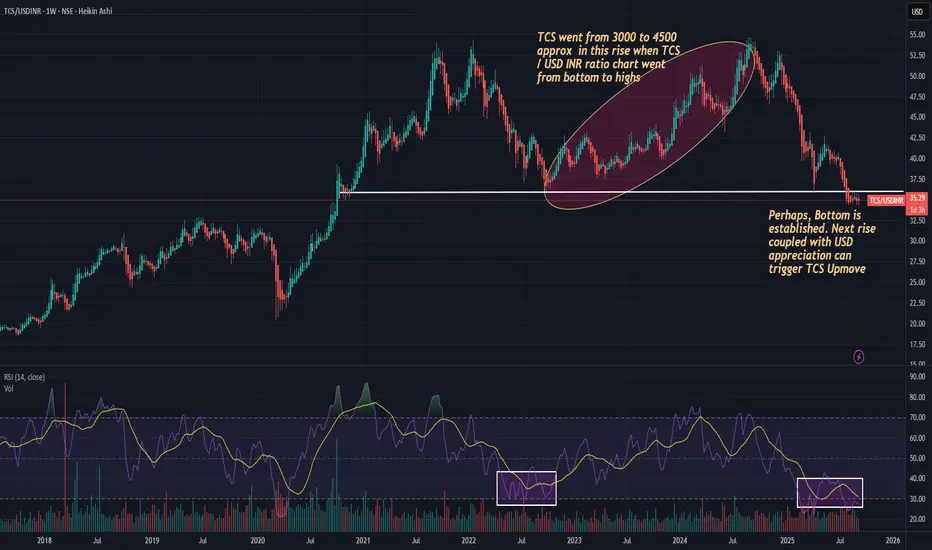
TCS - One More RISE Again.Ratio Chart of TCS to USD INR shows a clear trend where RSI is in exhaustion and Support matches previous instances of rise in 2022 and between 2020-21. USD Appreciation fundamentally is pending against INR which will aid PAT rise fundamentally. Indian IT companies have not yet launched own LLMs / AI bandwagons, which are an optionality if they do such acquisitions or around Cloud Vertical. Technically a rise of 40-50% upside can happen here.
TCS 1H Time frameTCS 1-Hour Snapshot
Price is around ₹3,110
Showing small gains in recent sessions
Has been under pressure from broader IT sector weakness, but holding above some short-term support
🔎 Technical Indicators & Trend
Moving Averages (short-term hourly) are slightly below current price → providing support
Medium-term MAs (50-hour etc.) are above → resistance overhead
RSI (hourly) is moderately neutral—neither strongly overbought nor oversold
Trend strength appears modest; no sharp momentum bars or volume spikes indicating breakout
🔧 Support & Resistance Levels (1H)
Support: ~₹3,080–₹3,090 first support zone
Resistance: ~₹3,130–₹3,140 nearby resistance
🧭 Short-Term Outlook
Bullish Case: A break above ~₹3,130-3,140 with volume could push toward ~₹3,160
Bearish Case: If it fails to break resistance and drops below ~₹3,090, possible move toward ~₹3,060
Overall Bias: Slightly bullish to neutral; waiting for confirmation from resistance breakout