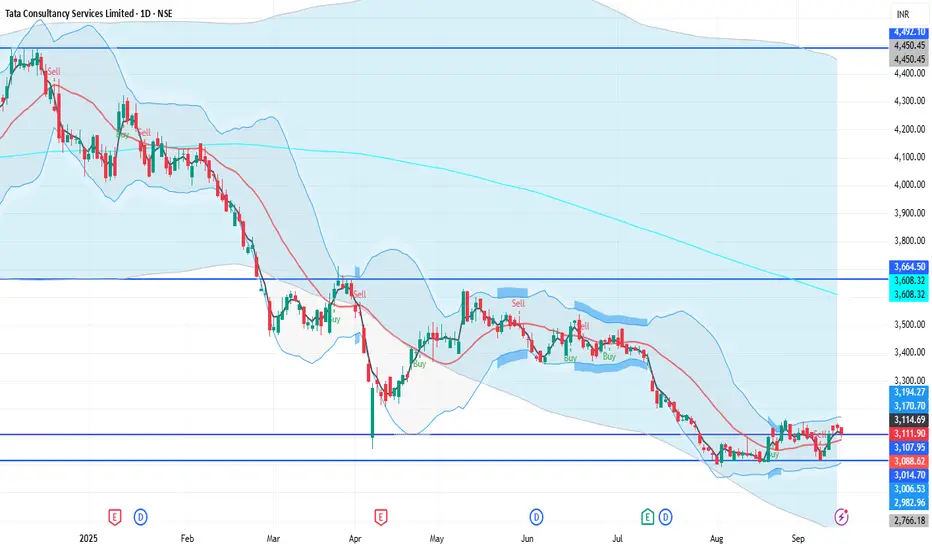
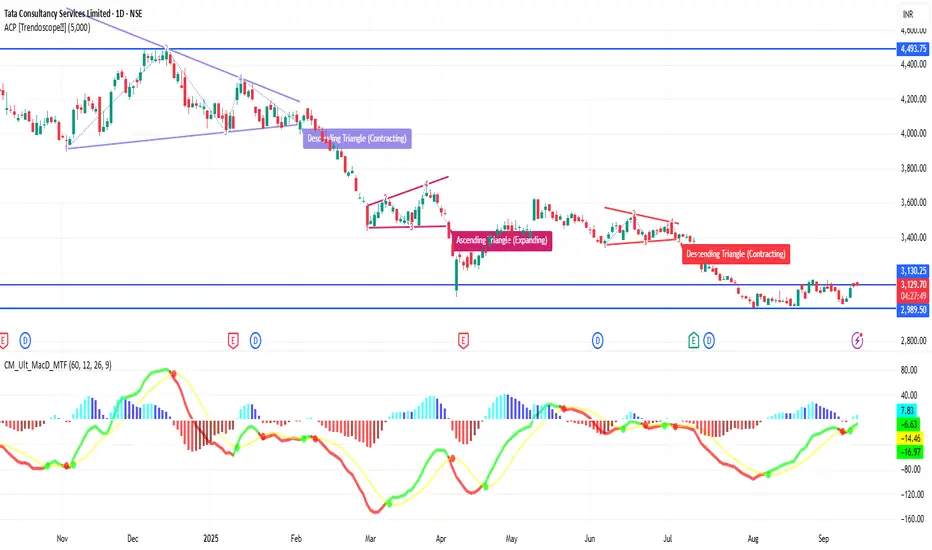
TCS 1D Time frameCurrent Snapshot
Price: ₹3,174
Stock has moved above earlier resistance zones (₹3,150 – ₹3,170).
Momentum looks positive, buyers are holding strength.
📌 Key Levels
Immediate Resistance: ₹3,190 – ₹3,200
Next Resistance: ₹3,220 – ₹3,250
Immediate Support: ₹3,150 – ₹3,160
Stronger Support: ₹3,100 – ₹3,120
✅ Outlook
If TCS sustains above ₹3,170, it can extend the rally toward ₹3,200 – ₹3,220.
If it slips back below ₹3,160, consolidation may happen around ₹3,120 – ₹3,150.
Larger trend remains bullish as long as price stays above ₹3,100.
Trade ideas
Options Greeks & Advanced Hedging Strategies1. Introduction to Options
Options are derivative instruments that provide the right, but not the obligation, to buy or sell an underlying asset at a predetermined price before or on a specified expiry date. There are two main types:
Call Options – Give the holder the right to buy the underlying asset.
Put Options – Give the holder the right to sell the underlying asset.
Unlike equities, options are inherently more complex because their value is influenced by multiple variables such as underlying price, strike price, time to expiration, volatility, interest rates, and dividends. This multidimensionality is captured by the Greeks, which form the backbone of options risk management.
2. Understanding Options Greeks
The Greeks quantify the sensitivity of an option’s price to various market factors. They are indispensable for assessing risk and structuring trades. The primary Greeks are Delta, Gamma, Theta, Vega, and Rho, each serving a specific purpose.
2.1 Delta (Δ) – Price Sensitivity
Delta measures the rate of change of an option's price with respect to the price movement of the underlying asset.
Call Delta ranges from 0 to 1.
Put Delta ranges from -1 to 0.
Interpretation:
A delta of 0.6 for a call option indicates that if the underlying asset moves up by ₹1, the call option price will increase by ₹0.60.
Traders use delta to gauge the directional exposure of their portfolio, often referred to as delta exposure.
Delta Hedging:
Delta hedging is a strategy where traders neutralize the delta of a position by taking an offsetting position in the underlying asset. For example, if you hold a call option with a delta of 0.6 on 100 shares, you can short 60 shares of the underlying to make the position delta-neutral.
2.2 Gamma (Γ) – Rate of Change of Delta
Gamma measures the rate of change of delta with respect to changes in the underlying asset price.
High Gamma indicates that delta changes rapidly with underlying price movement.
Low Gamma implies delta is stable.
Importance of Gamma:
Gamma is crucial for understanding convexity risk, especially near the option’s expiry or at-the-money options.
Traders use gamma to anticipate how delta hedges will change as the market moves.
Gamma Hedging:
Gamma hedging involves balancing a portfolio such that it remains neutral to delta changes. Typically, it requires frequent adjustments because gamma fluctuates as underlying prices move.
2.3 Theta (Θ) – Time Decay
Theta represents the rate at which an option loses value as time passes, holding other factors constant.
Options are decaying assets, losing value every day due to time erosion.
Call and put options experience negative theta for holders (long positions) and positive theta for writers (short positions).
Applications:
Long options traders must account for theta decay, especially in volatile markets.
Strategies like calendar spreads or selling options exploit theta decay to generate income.
2.4 Vega (ν) – Volatility Sensitivity
Vega measures an option’s sensitivity to changes in implied volatility of the underlying asset.
Options prices increase with higher volatility (for both calls and puts).
Vega is higher for at-the-money options and long-dated options.
Volatility Trading:
Traders can take positions purely on expected volatility changes without relying on directional movement.
Long Vega positions profit from volatility spikes, while short Vega strategies benefit from declining volatility.
2.5 Rho (ρ) – Interest Rate Sensitivity
Rho measures sensitivity to changes in the risk-free interest rate.
More significant for long-term options.
A call option’s price rises with increasing interest rates, while put options decline.
Practical Relevance:
Rho is relatively minor compared to delta or vega but becomes crucial in macroeconomic shifts, especially for options with long maturities.
3. Combining Greeks for Portfolio Management
While each Greek provides specific insights, professional traders consider multiple Greeks simultaneously to manage comprehensive risk. This multidimensional approach allows traders to:
Maintain delta neutrality – minimize directional risk.
Control gamma exposure – manage rapid changes in delta.
Optimize theta decay – benefit from time erosion.
Manage vega risk – protect against volatility shocks.
Monitor rho impact – for long-term interest-sensitive trades.
Example:
A trader holding a long call may delta-hedge by shorting the underlying. If gamma is high, the hedge needs frequent adjustments. Additionally, they must consider theta decay, particularly if the position is near expiry.
4. Advanced Hedging Strategies
Hedging with options is a way to protect portfolios from adverse movements while retaining profit potential. Advanced hedging strategies involve using combinations of options, futures, and the underlying asset.
4.1 Delta Neutral Hedging
Objective: Make a portfolio insensitive to small price movements.
Method: Offset delta of options with underlying asset or other derivatives.
Example: Long call delta of 0.6 → Short 60 shares of the underlying.
Advantages:
Reduces directional risk.
Can be dynamically adjusted to changing deltas.
Limitations:
Frequent rebalancing is required due to gamma exposure.
4.2 Gamma Scalping
Objective: Profit from price swings in the underlying asset while remaining delta neutral.
Method: Buy options with high gamma. As underlying moves, delta changes are hedged dynamically, locking in profits from volatility.
Applications: Used by market makers and professional traders to extract profit from intraday volatility.
4.3 Vega Hedging
Objective: Neutralize exposure to volatility changes.
Method: Offset vega by taking positions in options with opposite volatility sensitivity (e.g., long a call and short a call with different strike prices or maturities).
Applications: Useful during earnings announcements, geopolitical events, or expected market turbulence.
4.4 Calendar and Diagonal Spreads
Calendar Spread: Buy a long-dated option and sell a short-dated option of the same strike.
Diagonal Spread: Combine different strikes and expiries.
Purpose: Exploit theta decay and volatility differences while limiting directional risk.
Example: A trader expecting stable markets but rising volatility may buy a long-term call and sell a near-term call.
4.5 Protective Puts & Collars
Protective Put: Buying a put option to safeguard a long stock position.
Collar: Combining a protective put with a covered call to limit downside while capping upside.
Applications: Hedging large equity positions during uncertain markets.
4.6 Ratio & Backspread Strategies
Ratio Spread: Buy/sell unequal number of options to balance cost and risk.
Backspread: Sell a small number of near-term options and buy a larger number of far-term options.
Use Case: Profitable in high volatility expectations, providing leveraged exposure with hedged downside.
5. Greeks-Based Risk Management
A sophisticated options trader actively monitors Greeks to:
Adjust positions dynamically – react to price, time, and volatility changes.
Measure risk-reward tradeoffs – understand potential loss in extreme scenarios.
Stress-test portfolios – simulate scenarios like sharp price jumps or volatility spikes.
Optimize hedging costs – reduce capital expenditure while maintaining protection.
Conclusion
Options Greeks are the foundation for advanced options trading and risk management. Understanding delta, gamma, theta, vega, and rho enables traders to quantify risk, structure trades, and implement sophisticated hedging strategies. By combining these metrics with advanced approaches like delta neutral hedging, gamma scalping, vega hedging, spreads, and collars, traders can protect portfolios against adverse movements while seizing opportunities in volatile markets.
For Indian traders, these strategies are highly relevant in indices like Nifty, Bank Nifty, and sectoral options, as well as in individual stocks. Mastery of Greeks and hedging not only enhances risk management but also opens avenues for strategic income generation, volatility trading, and portfolio optimization.
In an increasingly complex and volatile market environment, leveraging Options Greeks and advanced hedging strategies is no longer optional—it is essential for any serious options trader aiming for consistent, risk-adjusted returns.
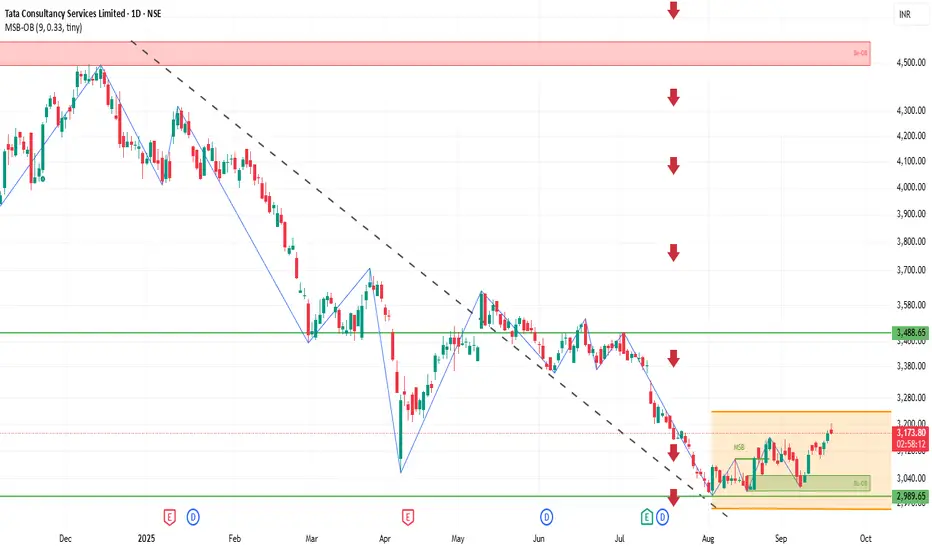
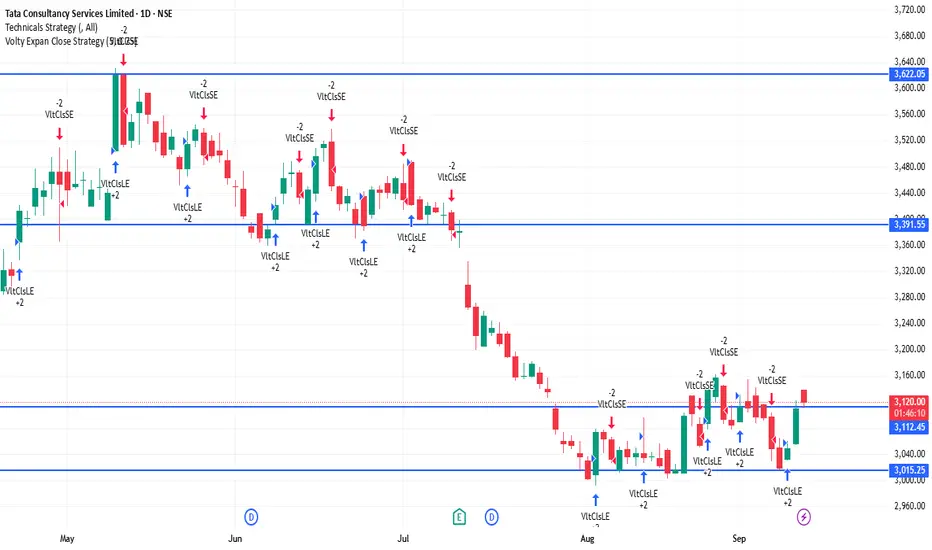
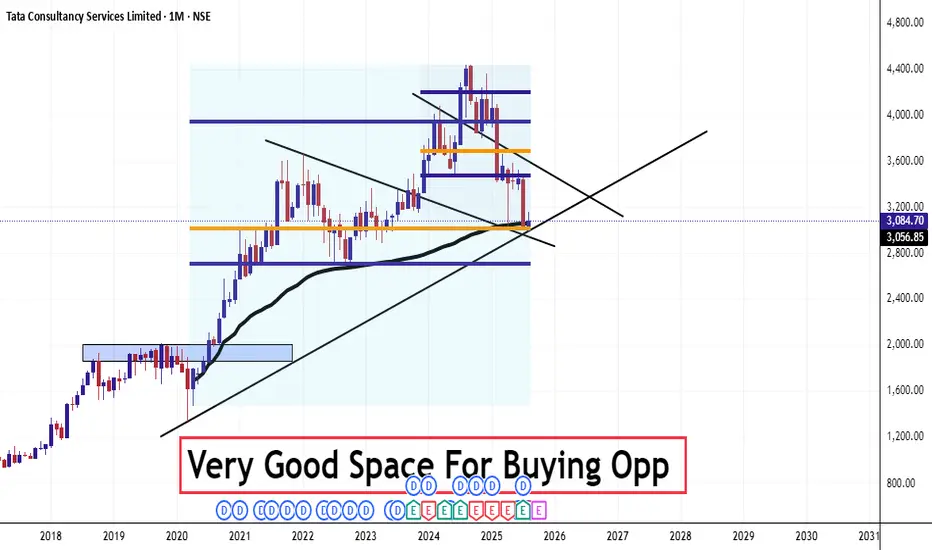
TCS Breaking outPrice consolidating near resistance after a strong base formation. A breakout above this zone may trigger momentum towards higher levels.
TCS BIG DADDY OF IT Please consult your financial advisor before investing.This is only for learning purpose of chart.
We are NISM certified EQ and MCX trader but not SEBI register investment advisor.
HOLD FOR 18-24 MONTH 4800-4900 TGT....

TCS 1D Time framePrice Action
Current Price: ₹3,111.60
Previous Close: ₹3,124.20
Day’s Range: ₹3,096 – ₹3,134
52-Week Range: ₹2,991.60 – ₹4,546.05
🔹 Support & Resistance
Support 1: ₹3,096
Support 2: ₹3,050 – ₹3,060
Resistance 1: ₹3,134
Resistance 2: ₹3,150 – ₹3,160
TCS on bullishBuy @ CMP -3108
Stoploss - 3030.75
Target - 3230.20
3267.10
3315.00
Follow me for update on the calls.
Maintain stoploss strictly
Happy Trading
Jai Hind
TCS 1D Time frame📉 Current Market Snapshot
Closing Price: ₹3,133.40
Day's Range: ₹3,121.00 – ₹3,148.70
52-Week High: ₹4,547.00
52-Week Low: ₹2,991.60
Market Cap: ₹11,21,000 crore
P/E Ratio (TTM): 22.8
Dividend Yield: 1.93%
Book Value: ₹262
ROE: 52.4%
Debt-to-Equity Ratio: 0.10
EPS (TTM): ₹136.19
Face Value: ₹1.00
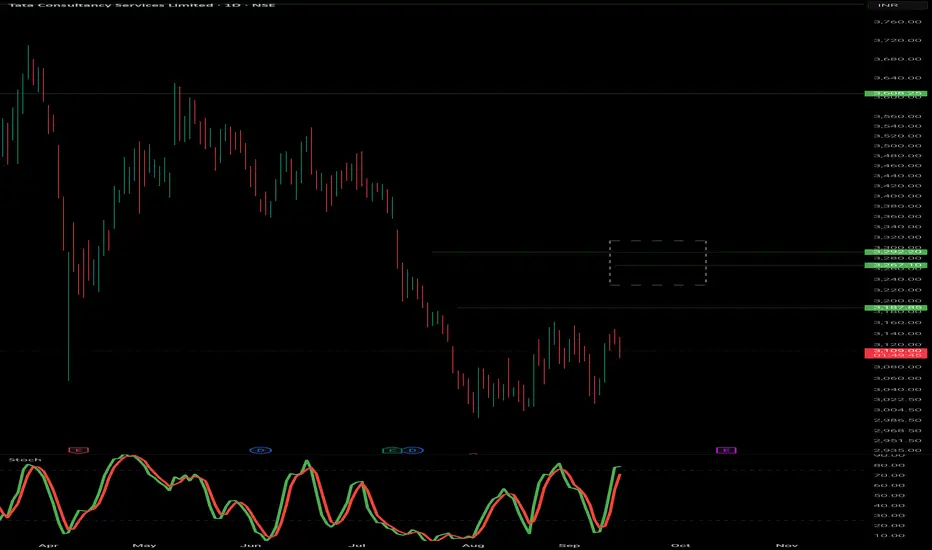
TCS 1D Time frame🔢 Current Level
~ ₹3,131
🔑 Key Resistance & Support Levels
Resistance Zones:
~ ₹3,160 – ₹3,180 (near-term resistance)
~ ₹3,200 – ₹3,220 (stronger resistance above)
Support Zones:
~ ₹3,120 – ₹3,100 (immediate support)
~ ₹3,050 – ₹3,000 (secondary support)
~ ₹2,900 (deeper support if weakness intensifies)
📉 Outlook
Bullish Scenario: If TCS holds above ~ ₹3,120 and manages to break past ~ ₹3,180 – ₹3,200, there is potential to move toward ~ ₹3,220+
Bearish Scenario: A drop below ~ ₹3,100 could lead to a slide toward ~ ₹3,050 or lower
Neutral / Range: Between ~ ₹3,100 – ₹3,180, TCS may consolidate until a clearer breakout or breakdown
TCS 1D Time frame🔢 Current Level
Trading around ₹3,125 – ₹3,135
🔑 Key Resistance & Support Levels
Resistance Zones:
₹3,138 – ₹3,153 (near-term resistance; breakout above this may lead to further upside)
₹3,167 (stronger resistance above)
Support Zones:
₹3,095 – ₹3,110 (immediate support)
₹3,080 (stronger support if price dips further)
₹3,050 – ₹3,060 (deeper support zone)
📉 Outlook
Bullish Scenario: If TCS holds above ₹3,110, upward momentum may continue. Break above ₹3,153 can open the way toward ₹3,167+.
Bearish Scenario: If it falls below ₹3,080, risk increases toward ₹3,050.
Neutral / Range: Between ₹3,110 – ₹3,153, TCS may consolidate before a directional move.
TCS 1D Time framePrice Action (Daily Chart)
Current price is around ₹3,117 - ₹3,120
Price is consolidating near support zones after a recent upward move.
Candle structure shows buying interest at lower levels, but resistance is capping the upside.
📊 Indicators
Moving Averages (MA):
Short-term MAs (5-day, 10-day) are slightly mixed.
Medium to long MAs (20, 50, 100, 200-day) are in buy zone, showing broader uptrend strength.
RSI (14-day): ~62-65 → indicates mild bullish momentum, not yet in overbought zone.
MACD: Shows positive crossover, momentum favors bulls but losing some strength.
⚖️ Key Levels
Immediate Resistance: ₹3,135 – ₹3,140
Next Resistance: ₹3,170 – ₹3,200
Immediate Support: ₹3,100 – ₹3,110
Strong Support: ₹3,050 – ₹3,000
📈 Outlook
Short-term sentiment: Neutral to slightly bullish as long as price holds above ₹3,100.
A breakout above ₹3,140 may open room toward ₹3,170–₹3,200.
A breakdown below ₹3,100 may drag price to ₹3,050–₹3,000.
Overall trend on daily timeframe is still uptrend, but near resistance, so caution is needed.
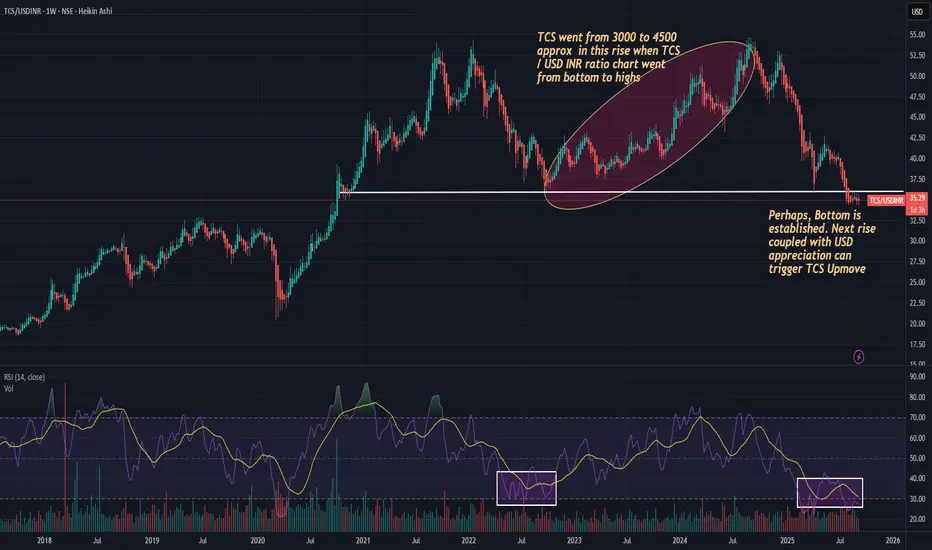
TCS - One More RISE Again.Ratio Chart of TCS to USD INR shows a clear trend where RSI is in exhaustion and Support matches previous instances of rise in 2022 and between 2020-21. USD Appreciation fundamentally is pending against INR which will aid PAT rise fundamentally. Indian IT companies have not yet launched own LLMs / AI bandwagons, which are an optionality if they do such acquisitions or around Cloud Vertical. Technically a rise of 40-50% upside can happen here.
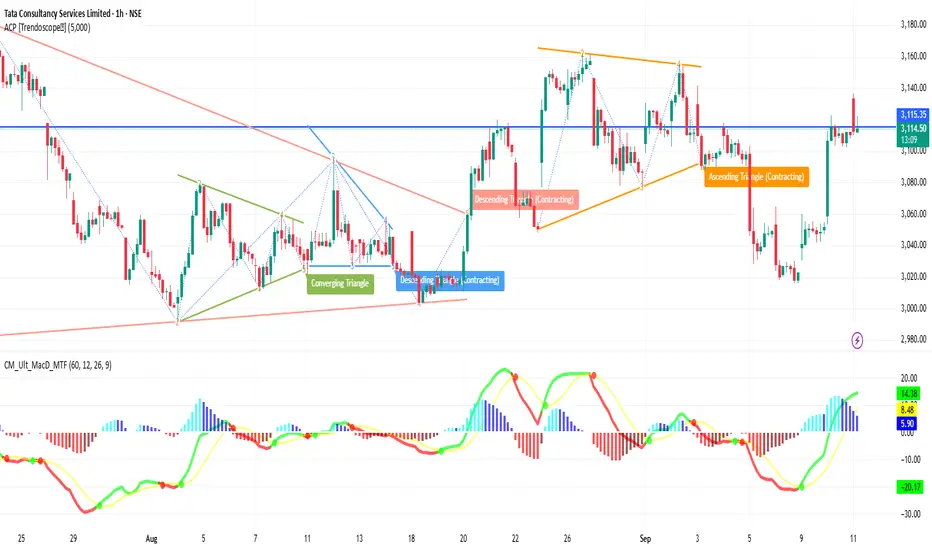
TCS 1H Time frameTCS 1-Hour Snapshot
Price is around ₹3,110
Showing small gains in recent sessions
Has been under pressure from broader IT sector weakness, but holding above some short-term support
🔎 Technical Indicators & Trend
Moving Averages (short-term hourly) are slightly below current price → providing support
Medium-term MAs (50-hour etc.) are above → resistance overhead
RSI (hourly) is moderately neutral—neither strongly overbought nor oversold
Trend strength appears modest; no sharp momentum bars or volume spikes indicating breakout
🔧 Support & Resistance Levels (1H)
Support: ~₹3,080–₹3,090 first support zone
Resistance: ~₹3,130–₹3,140 nearby resistance
🧭 Short-Term Outlook
Bullish Case: A break above ~₹3,130-3,140 with volume could push toward ~₹3,160
Bearish Case: If it fails to break resistance and drops below ~₹3,090, possible move toward ~₹3,060
Overall Bias: Slightly bullish to neutral; waiting for confirmation from resistance breakout
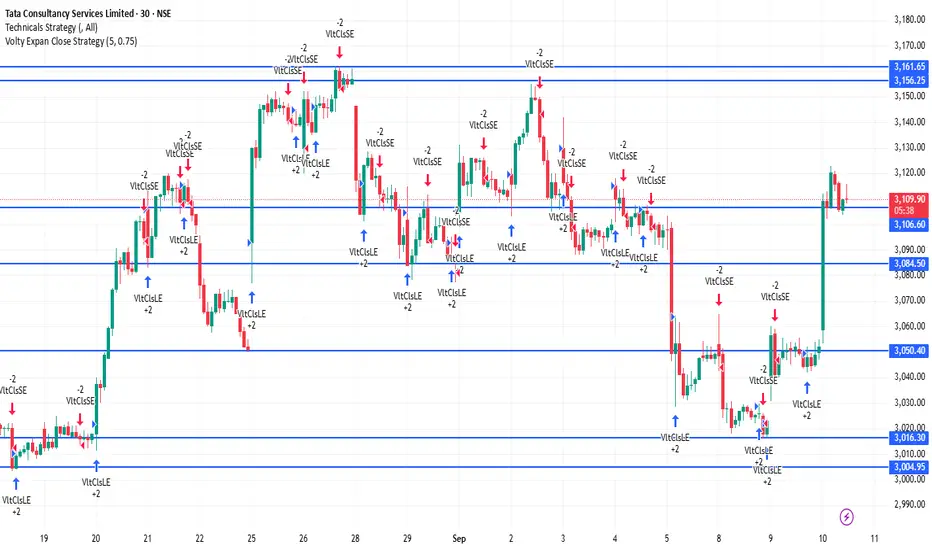
TCS 30Minutes Time frameTCS – 30-Minute Time Frame Important Levels (Current Estimate)
Support Zones
₹3,080 – ₹3,090 → Immediate intraday support
₹3,050 – ₹3,060 → Stronger support level where dip-buying may emerge
₹3,020 – ₹3,030 → Major support; a breakdown here may indicate intraday weakness
Resistance Zones
₹3,130 – ₹3,140 → Immediate intraday resistance
₹3,160 – ₹3,170 → Strong resistance zone; a breakout may extend upward momentum
₹3,200 – ₹3,210 → Major resistance; surpassing this can fuel a more sustained rally
Intraday Trend Outlook (30M Chart)
The trend appears mildly bullish as long as TCS holds above ₹3,080.
A clear move above ₹3,140 can open the path toward ₹3,160–₹3,200.
If it falls below ₹3,050, price may pull back toward ₹3,020, and a break under that could signal further downside.
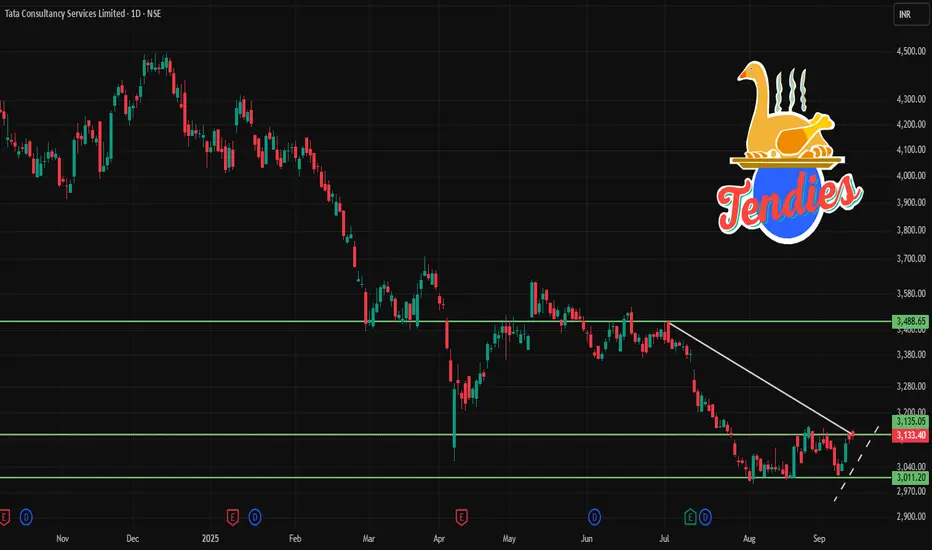
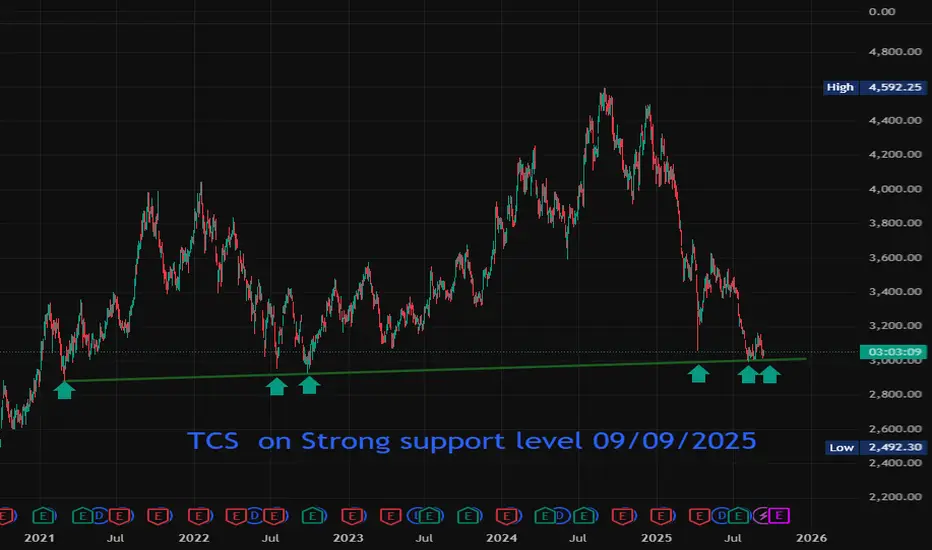
TCS on Strong support level 09/09/2025Symbol TCS : Exchange –NSE India Timeframe –Daily TCS face Strong support level first time respect the level on dated 24/02/2021 then 5 times hit the level and bounce back today TCS near the support line. Recommended one more time bounce back to up side
Technical Analysis Foundations1. Historical Background of Technical Analysis
Early Origins
Japanese Rice Trading (1700s): Candlestick charting was developed by Munehisa Homma, a rice trader, who discovered that market psychology and patterns could predict future prices.
Charles Dow (Late 1800s): Considered the father of modern technical analysis, Dow developed the Dow Theory, which laid the groundwork for trend analysis.
Evolution in the 20th Century
With the rise of stock exchanges in the U.S. and Europe, charting methods gained popularity.
The creation of indicators like Moving Averages, RSI, MACD, and Bollinger Bands in the mid-20th century expanded the technical toolkit.
Modern Era
Today, technical analysis is powered by computers, algorithms, and AI-based models.
Despite these advances, the core principle remains the same: history tends to repeat itself in markets.
2. Core Principles of Technical Analysis
Technical analysis is built on three central assumptions:
Price Discounts Everything
Every factor—economic, political, psychological—is already reflected in price.
Traders don’t need to analyze external events; studying price is enough.
Prices Move in Trends
Markets don’t move randomly. Instead, they form trends—uptrend, downtrend, or sideways.
Identifying and following the trend is the foundation of profitable trading.
History Repeats Itself
Human behavior in markets tends to repeat due to psychology (fear, greed, hope).
Chart patterns like Head & Shoulders or Double Tops repeat because investor reactions are consistent over time.
3. Types of Charts
Charts are the backbone of technical analysis. The three most commonly used chart types are:
1. Line Chart
Simplest chart, connecting closing prices with a line.
Best for long-term trend analysis.
2. Bar Chart
Displays open, high, low, and close (OHLC) in each bar.
Provides more detail than line charts.
3. Candlestick Chart
Invented in Japan, now the most popular.
Each candlestick shows open, high, low, and close with a body and wicks.
Offers visual insight into market psychology (bullish vs. bearish sentiment).
4. Understanding Market Structure
1. Trends
Uptrend: Higher highs and higher lows.
Downtrend: Lower highs and lower lows.
Sideways: Price consolidates within a range.
2. Support and Resistance
Support: Price level where buying pressure overcomes selling.
Resistance: Price level where selling pressure overcomes buying.
Key to identifying entry and exit points.
3. Breakouts and Pullbacks
Breakout: Price moves beyond support or resistance with strong volume.
Pullback: Temporary retracement before the trend resumes.
5. Technical Indicators
Indicators are mathematical calculations applied to price or volume data. They are divided into two main types:
1. Trend Indicators
Moving Averages (SMA, EMA): Smooth price data to identify trend direction.
MACD (Moving Average Convergence Divergence): Measures momentum and trend strength.
2. Momentum Indicators
RSI (Relative Strength Index): Identifies overbought (>70) or oversold (<30) conditions.
Stochastic Oscillator: Compares closing price to recent highs/lows.
3. Volatility Indicators
Bollinger Bands: Show price volatility around a moving average.
ATR (Average True Range): Measures market volatility.
4. Volume Indicators
OBV (On Balance Volume): Tracks cumulative buying/selling pressure.
Volume Profile: Highlights price levels where significant trading occurred.
6. Chart Patterns
Patterns represent the psychology of market participants. They are broadly classified into continuation and reversal patterns.
1. Reversal Patterns
Head and Shoulders: Signals a trend reversal from bullish to bearish.
Double Top/Bottom: Indicates a change in trend after testing a key level twice.
2. Continuation Patterns
Flags and Pennants: Short-term consolidations within a strong trend.
Triangles (Symmetrical, Ascending, Descending): Signal breakout in the direction of trend.
3. Candlestick Patterns
Doji: Market indecision.
Hammer / Shooting Star: Potential reversal signals.
Engulfing Patterns: Strong reversal signals based on candlestick body size.
7. Volume and Market Confirmation
Volume is a critical element in technical analysis:
Rising volume confirms the strength of a trend.
Low volume during a breakout may signal a false move.
Divergence between price and volume often hints at a reversal.
8. Timeframes in Technical Analysis
Intraday (1-min, 5-min, 15-min): For day traders and scalpers.
Swing (Hourly, 4H, Daily): For medium-term traders.
Position (Weekly, Monthly): For long-term investors.
The principle of Multiple Time Frame Analysis is key: Traders often analyze higher timeframes for trend direction and lower timeframes for precise entries.
9. Market Psychology and Sentiment
Technical analysis is rooted in psychology:
Fear and Greed: Drive most market movements.
Herd Behavior: Traders follow crowds, amplifying trends.
Overconfidence: Leads to bubbles and crashes.
Sentiment indicators like VIX (Volatility Index) or Put/Call ratios are often used to gauge market mood.
10. Risk Management in Technical Analysis
No strategy works without risk control. Key principles:
Position Sizing: Risk only 1–2% of capital per trade.
Stop Loss: Predetermine exit levels to minimize loss.
Risk-Reward Ratio: Aim for trades with at least 1:2 risk-reward.
Conclusion
Technical analysis is both an art and a science. It blends mathematical tools with human psychology to understand market behavior. While it has limitations, its principles of trend, support/resistance, and pattern recognition remain timeless.
For beginners, mastering chart basics, support/resistance, and risk management is the starting point. For advanced traders, integrating multiple indicators, refining strategies, and incorporating psychology make the difference.
Ultimately, technical analysis is not about predicting the future with certainty—it’s about increasing probabilities and managing risk. With discipline and practice, it becomes a powerful tool for navigating financial markets.

TCS BULLISHbulls its time to enter trade in tcs
buy @3861-3870
stoploss -3671
targets - 3955 4062 4188 4313
like the support if you see its genuine, follow me further analysis
this idea is for educational purpose
happy trading

Part 10 Trading Master Class With ExpertsOptions in Hedging
Options are not only for speculation. Big institutions use them for hedging.
Portfolio Hedge: A fund holding ₹100 crore worth of Nifty stocks may buy Nifty puts. If the market crashes, puts rise in value, cushioning losses.
Corporate Hedge: A company expecting payment in USD may buy currency options to protect against rupee appreciation.
Commodity Hedge: A farmer may use options to lock in selling prices for crops.
Hedging reduces uncertainty and stabilizes income.
Options in Speculation
Speculators love options because:
Small premium = big exposure.
High leverage = high potential returns.
Flexibility to bet on direction, volatility, or time.
But speculation is risky. Most retail traders lose because they treat options as lottery tickets.
Options for Income Generation
Option sellers (writers) earn premium by providing liquidity to buyers.
Covered Call Writing: Regularly selling calls on owned stock generates income.
Cash-Secured Puts: Selling puts on stocks you’re willing to buy at lower prices.
Range-Bound Strategies (Iron Condors, Butterflies): Earn premium if stock stays within range.
Many professionals and institutions rely on option selling for consistent income.

TCS No matter how much fear is there in the marketNo matter how much fear is there in the market, the price will always fall in the price of that stock where the fear of its fall is in the minds of the people. The price falls only when people sell. People sell where they know that the price has become expensive. That is why the expensive stock always falls and the money shifts to those stocks where the price becomes stable.
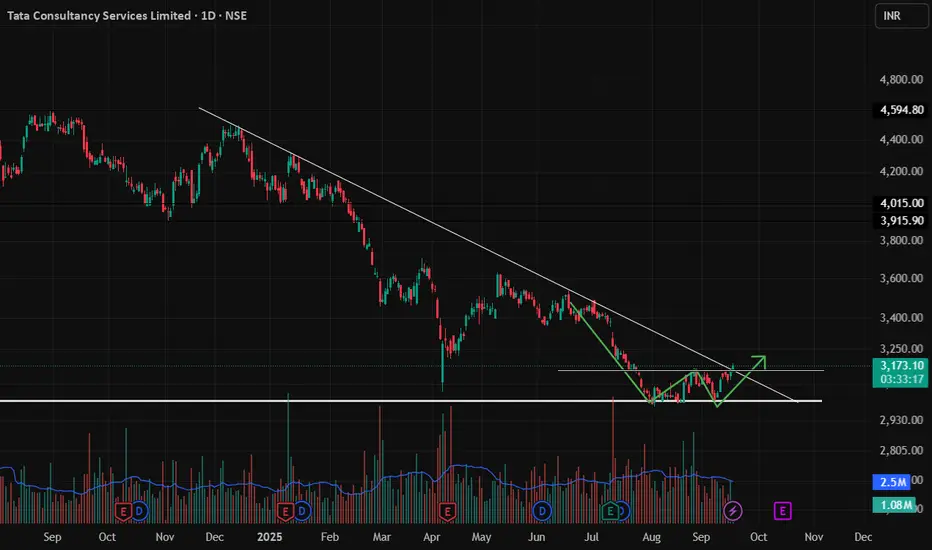
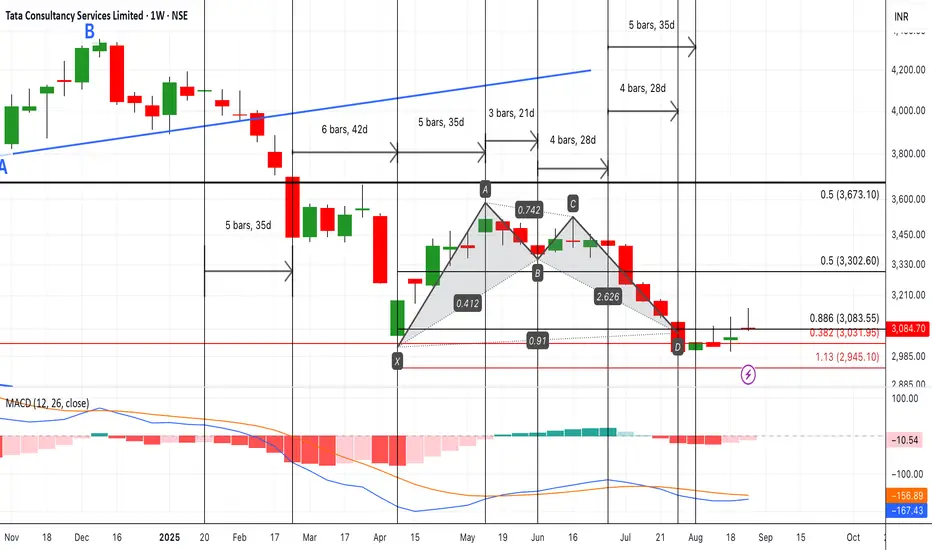
TCS LOOKING FOR TURNAROUND Keep #TCS on radar 🚀 Weekly MACD histogram shows bullish divergence + positive DMI. A bullish alt Bat harmonic also visible on weekly scale. Just a MACD positive cross needed to ignite momentum in next 1–2 months. expecting 3450
Options Watchlist — An Educational View of OI & Price Action________________________________________
📊 Options OI Trade Outlook — Bearish Setups Only
“This analysis is shared purely for educational purposes and market awareness — not a trading recommendation.”
(Educational Purpose | Not Financial Advice | SEBI Compliant)
Hello Traders 👋,
Here are 4 Bearish option setups based on today’s OI + Price Action + IV + Greeks study.
This is strictly for learning and educational purposes.
________________________________________
🔴 1. TCS 3200 PUT
LTP: 118.15
Sentiment: Bearish | Trend: Down | Strength: 5/5 (Strong)
IV: 17.7 | Delta: -0.63 | Theta: -0.93 | Vega: 3.5
Buildup: Long Build-up
Why?
3200 PE shows a Long Build-up with price up 40.4% and OI up 33.6%, confirming strong bearish positioning.
Volume surged +65%, showing active participation. IV eased (-5.4%), keeping premiums cheaper. Delta -0.63 signals high sensitivity to downside moves.
________________________________________
🔴 2. SBIN 820 PUT
LTP: 21.65
Sentiment: Bearish | Trend: Down | Strength: 5/5 (Strong)
IV: 14.8 | Delta: -0.56 | Theta: -0.31 | Vega: 0.95
Buildup: Long Build-up
Why?
820 PE reflects a Long Build-up with price rising 20.6% and OI also increasing — a textbook bearish confirmation.
Low IV (14.8) makes premiums attractive. Delta -0.56 shows quick reactivity to price moves.
________________________________________
🔴 3. INFY 1520 PUT
LTP: 42.80
Sentiment: Bearish | Trend: Down | Strength: 5/5 (Strong)
IV: 20.8 | Delta: -0.51 | Theta: -0.63 | Vega: 1.79
Buildup: Long Build-up
Why?
1520 PE shows heavy Long Build-up, with price up 36.5% and OI exploding 106%.
Volume spiked strongly, reflecting aggressive bearish positioning. IV is moderate (20.8), while Delta -0.51 indicates solid responsiveness to further downside.
________________________________________
🔴 4. LT 3600 PUT
LTP: 81.0
Sentiment: Bearish | Trend: Down | Strength: 2.5/5 (Moderate)
IV: 16.9 | Delta: -0.50 | Theta: -1.58 | Vega: 4.26
Buildup: Short Build-up
Why?
3600 PE shows a Short Build-up, with price falling 10.3% while OI rose 41%, pointing to fresh shorts.
Volume surged +29%, confirming activity. IV is steady at 16.9, and Delta -0.50 indicates balanced downside exposure.
________________________________________
⚠️ Disclaimer – Please Read Carefully
The information shared here is meant purely for learning and awareness.
It is not a buy or sell recommendation and should not be taken as investment advice.
📌 I am not a SEBI-registered investment advisor.
📌 All views expressed are based on personal study, chart patterns, and publicly available data.
📌 Trading — whether in stocks or options — carries risk. Markets can move unexpectedly, and losses can exceed capital.
📌 Past setups do not guarantee future outcomes.
👉 Beginners: use this to learn market behavior, practice with paper trades before risking money.
👉 Experienced traders: apply your own risk management, sizing, and strategy filters.
👉 Always consult a SEBI-registered financial advisor before real trades.
By engaging with this content, you acknowledge full responsibility for your own trading and investments.
________________________________________
💬 Found this useful?
🔼 Boost this post to help more traders learn.
✍️ Share your thoughts/setups in comments — let’s grow together.
🔁 Share with fellow traders & learners.
👉 “Follow for more clean, structured breakdowns with discipline at the core.”
🚀 Stay Calm. Stay Clean. Trade With Patience.
Trade Smart | Learn Zones | Be Self-Reliant 📊
________________________________________
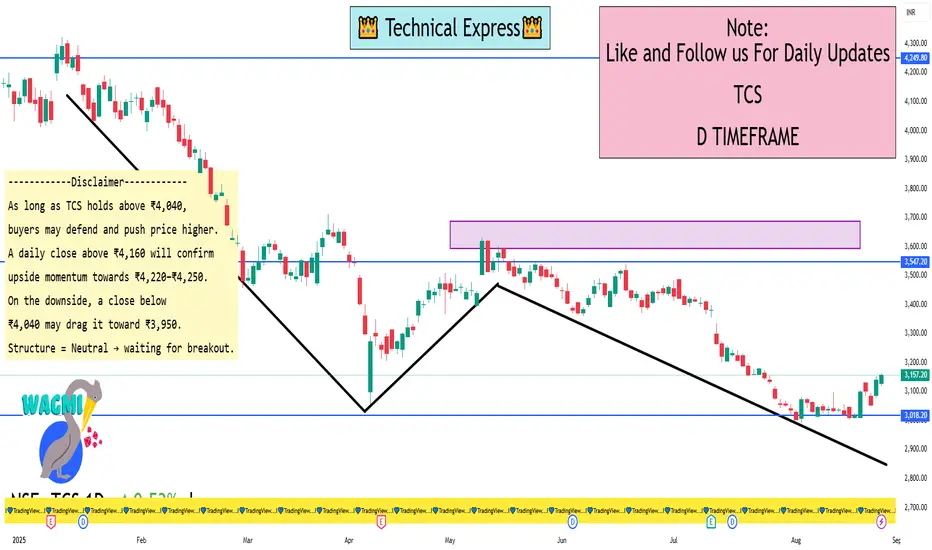
TCS 1 Day View TCS – 1 Day Timeframe Levels
🔹 Support Levels:
₹4,040 – 4,060 → Strong demand zone, recent bounce levels.
₹3,950 – 3,970 → Next major support if weakness continues.
₹3,850 → Broader support, trend-defining zone.
🔹 Resistance Levels:
₹4,140 – 4,160 → Immediate supply zone.
₹4,220 – 4,250 → Strong resistance; multiple rejections earlier.
₹4,300+ → Breakout level, opens path for higher rally.
View (Daily Structure)
Price is consolidating between ₹4,040 support and ₹4,160 resistance.
A daily close above ₹4,160 may trigger upside momentum toward ₹4,220–₹4,250.
A break below ₹4,040 could invite selling pressure toward ₹3,950.
Currently in a sideways consolidation, awaiting breakout for clear trend.
Part 4 Learn Institutional Trading Advanced Strategies
Straddle: Buy a call and a put at the same strike and expiry to profit from volatility.
Strangle: Buy OTM call and put for cheaper volatility bets.
Spread Strategies: Combine multiple calls or puts to limit risk and reward:
Bull Call Spread: Buy call at lower strike, sell call at higher strike.
Bear Put Spread: Buy put at higher strike, sell put at lower strike.
Iron Condor: Combine calls and puts to profit from low volatility.
Butterfly Spread: Profit from minimal movement around a central strike.
Pricing of Options
Option pricing is influenced by several factors:
Intrinsic Value
The real value if exercised today.
Call option IV = Max(Current Price – Strike, 0)
Put option IV = Max(Strike – Current Price, 0)
Time Value
Extra premium due to time until expiration.
TV = Option Premium – Intrinsic Value

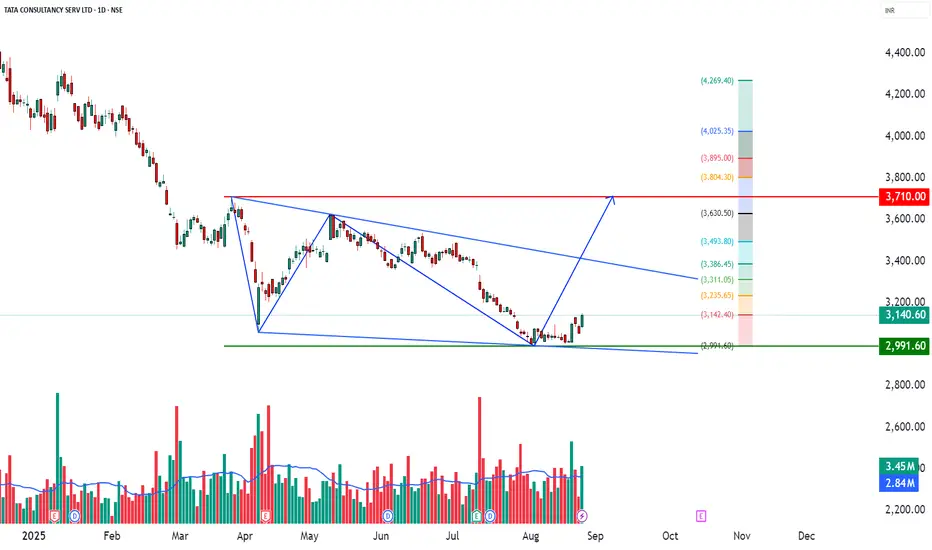
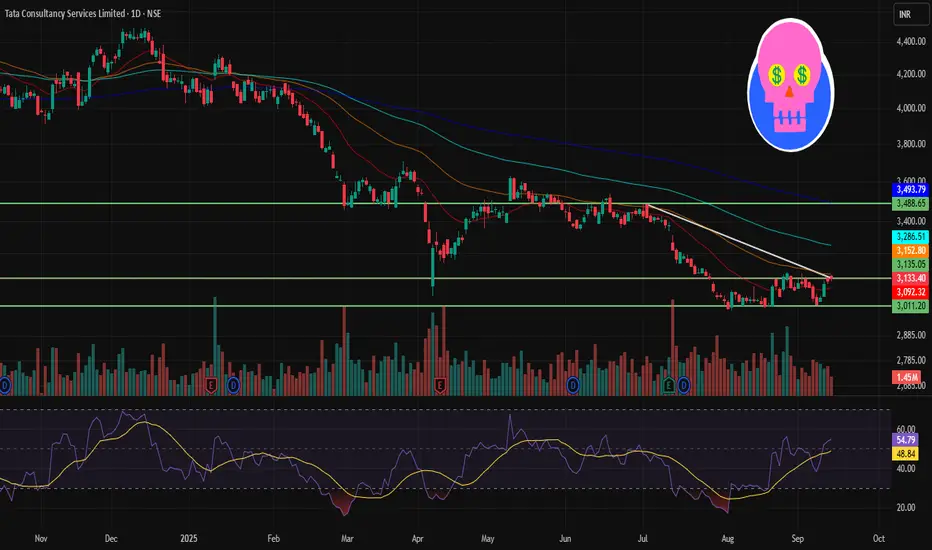
TCS – upport Bounce with Volume Confirmation📊 TCS – Technical & Educational Snapshot
Ticker: NSE:TCS | Sector: 💻 IT Services
CMP: ₹3,140.60 ▲ (+2.84% | 26 Aug 2025)
Learning Bias (for study purpose): ⭐⭐⭐ (Cautiously Bullish)
Pattern Observed: 📈 Support Bounce with Volume Confirmation
📰 Sentiment Analysis
👉 Overall Sentiment: Moderately Positive ✅
Bullish Drivers:
• Bounce from strong support near ₹3,000 with bullish candle & above-avg volume
• RSI breakout + Bollinger Band expansion → fresh buying interest
• Publicly available analyst reports indicate average estimates around ₹3,725; strong bullish case highlighted up to ₹4,610
• IT sector optimism for H2 FY26 earnings recovery
Risks (Bearish Case):
• Broader trend still marked Downtrend ⚠️
• Stochastic at 92 → overbought in short-term
• Employee layoffs & union protests (~12K–30K) may dampen sentiment
• Failure to hold ₹3,047 (support) could trigger deeper correction
Short-term Outlook: Upside momentum possible towards ₹3,160–3,200, but resistance supply zone must be watched.
Long-term Outlook: Positive — strong fundamentals, debt-free balance sheet, consistent dividends, and sector recovery cues.
📊 Technical Snapshot
TCS has formed a support bounce near the ₹3,000 bottom range, supported by a strong bullish candle and above-average volume.
Indicators: MACD bullish on daily/weekly, neutral-to-bearish on monthly.
RSI ~54 → healthy momentum without being overheated.
Trend direction still tagged as Downtrend, hence positional caution is advised.
📊 Volume Check
🔹 Current Volume: 3.45M
🔹 20 SMA Volume: 2.84M ✅
💥 Above-average participation → validates breakout reliability.
💡 Interpretation: Stronger demand from institutions/traders supporting price action.
💡 Learnings
Support bounces near psychological zones (₹3,000 in this case) often attract buying interest.
When combined with RSI breakouts, Bollinger Band expansion, and volume confirmation, the setup becomes more reliable.
However, overbought stochastic warns of possible near-term pullbacks — hence, stop-loss discipline is key.
📌 Key Levels
Resistance: 3,169 | 3,198 | 3,244
Support: 3,094 | 3,048 | 3,019
Fibonacci Reference Levels: 2,991 | 3,142 | 3,235 | 3,311 | 3,386 | 3,494 | 3,631
🎯 STWP Learning Reference
• Observed bounce zone: ~₹3,152
• Key support level: ~₹3,047
• Upside reference zones (if momentum continues): 3,200 | 3,244 | 3,310
• Pullback watch zone: 3,048–3,095
• Invalidation reference: Below 2,991 → momentum weakens
⚠️ Disclaimer – Please Read Carefully
This post is shared only for educational and informational purposes. It is not investment advice or a recommendation to buy/sell any security. I am not a SEBI-registered investment advisor. Please do your own research or consult a SEBI-registered advisor before making trading or investment decisions.
Trading and investing involve risk. Past performance or past setups do not guarantee future results. Always use stop-loss, proper position sizing, and risk management.
💬 Found this useful?
🔼 Boost this post to help more traders discover clean setups.
✍️ Share your thoughts, setups, or questions in the comments — let’s learn together.
🔁 Repost to spread awareness among traders & beginners.
✅ Follow simpletradewithpatience for clean charts, price action insights & beginner-friendly setups.
🚀 Stay Calm. Stay Clean. Trade With Patience.
Trade Smart | Learn Zones | Be Self-Reliant 📊