One Investment Idea and One Trading Idea | Detailed AnalysisI daily make educational content videos for financial markets
Trade ideas

swing trade in tcsThe stock is looking good for the both sides
lets wait for the break out and see where the market
is heading.

Long TCS - Consolidation Phase Over, Did't make lower lowTCS is excellent buy opportunity at current level as it has completed the consolidation phase from recent fall and also have made strong recovery from lowest low of 3160.
CMP 3261,
Target 3300, 3360
Stop loss 3220

TCS to move high Trend line breakout happened in TCS and now it has retested the breakout price. Now i have high conviction for tcs to move upwards target near 3800 -4000

TCS short (23 Dec)Short to medium term
TCS short (23 Dec)
Head & shoulders pattern
RSI- 42
Sell at CMP- 3240
SL- 3305
Target- 3135, 3015
Join us, Learn more, Earn more
Disclaimer- We are not SEBI registered advisor.
Charts and views are only for educational purpose.


TCS has shown a great recovery from it's support levelsNSE:TCS despite being opened gap down has shown a stellar recovery from it's lower levels. As of now, IT stocks will be in pressure but good to see not breaking it's support otherwise 3k levels can be seen soon.

TCS can be bought ABOVE 3327TCS seems to continue on its previous trend. Can be bought in Cash market around 3327 with Stop loss of 3235 and a target of 3603
FOR EDUCATIONAL AND INFORMATIONAL PURPOSES ONLY
The information posted are for educational and informational purposes only. These are trade which are taken by me personally along with money management. However, under no circumstances, or no word written on this post suggests or makes me liable for any trade which the visitor makes based on the information provided on this post. THIS POST IS STRICTLY CONSIDERED FOR INFORMATION PURPOSES ONLY and IS NOT AN INVESTMENT ADVICE. I am not a SEBI Registered Investment advisor, not do i claim to be one.

TCS: Excellent opportunity to buy on dipsIn hourly chart: 1-2-3-4-5 corrective wave appears to be over or will have little more room down side. But any downward movement would be an opp0rtunity to accumulate on dips. +ve divergence RSI from19.32 to 25.42 can be observed.
in.tradingview.com

BUY TCS | RISK REWARDS LOOKS FAVOURABLETCS near support zone and risk reward looks good for buyers.
To motivate us, Please like the idea If you agree with the analysis.
Happy Trading!
InvestPro India Team

Tcs Daily chart in head and solder making
TATA CONSULTANCY S
ONSE
pattern
I hope that shall be making in 2 season days in complete
I'm just education and learning purpose chart share I'm not provide any buy and selll recommend

Tcs daily Daily chart in head and solder making pattern
I hope that shall be making in 2 season days in complete
I'm just education and learning purpose chart share
I'm not provide any buy and selll recommend


TCS Bearsih dailyTcs seem bearish on daily , just broke the trendline follow up candle and trend continues then may go 3134 fib retracement reversal also 3136 fingers crossed lets see rsi also indicates down


#Tcs cash : Looks good sell below 3250#Tcs cash -Positional call
11.Dec 2022
Looks good sell below 3250
Stoploss 3300
Target 3162/3112
Cmp 3292.50

#Tcs cash : Looks good sell below 3250#Tcs cash -Positional call
11.Dec 2022
Looks good sell below 3250
Stoploss 3300
Target 3162/3112
Cmp 3292.50

Reason for why should you watch TCS !!TCS has given a breakout today & it's also at a good level to catch
Why TCS over all other IT Stocks NSE:TCS
Reason: Strength
When all others were in sell-off facing selling Pressure. It was the only standing man. Where the candles were forming was quite demanding.
Similarly, I've told some stocks in the Nifty Infra setup NSE:ULTRACEMCO NSE:GRASIM
Don't forget to follow
Follow for your learnings, not just for what I said

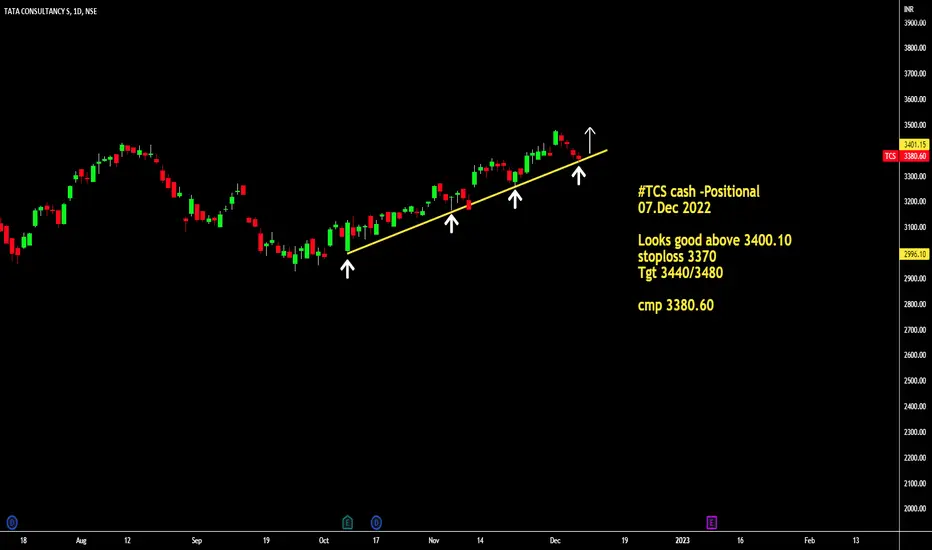
#TCS Cash : Looks good above 3400.10#TCS cash -Positional
07.Dec 2022
Looks good above 3400.10
stoploss 3370
Tgt 3440/3480
cmp 3380.60
Tata Consultancy ServicesAccumulate on dips
May take support on trendline or around 3400 levels
Keep stop loss of 3111

Bullish Strong stock:-
. Strong on 1 week And 3 months.
. High volume than 21 days average.
. Above 200 moving days EMD.
. Near 20% to 52 week high or all time high.
. Outperform nifty


TCS Daily TFA close above violet and blue trend line
can give a move up to 3430.
Trading above 50 DEMA.
SL daily close below 50 DEMA.
