TCS seems to be running towards 3350.NSE:TCS bought at 3k levels would be the best fit to book profits if it reaches 3350.
Trade ideas

Will TCS fall again?It is in a falling wedge pattern on a weekly timeframe . Price is now testing the trendline.

TCS Analysis | Good RR can be catchRight now if you look closely the nearest Gap is "3225" & then Trendline, If both are taken away with a strong candle then we can see other gaps to be filled sooner or later.
If Gap up opens then we have to watch out for Buildup & Volumes.

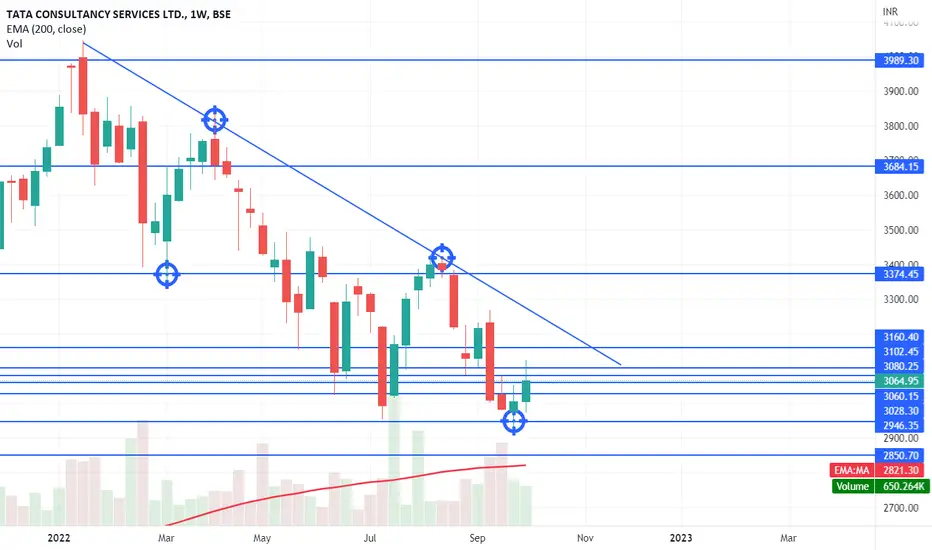
TCS: Classic Down trend Channel, Chart setup & trading strategyIn our July 2022 coverage, we had marked the red line zone as possible resistance zone and that is precisely what TCS has followed. It has fallen exactly from those levels
- If we look at the broader picture, Since the beginning of the year, TCS has been trading in a classic down trend channel. Now with results round the corner, the stock is in the middle of the channel range.
In the current set up
- we also observe a gap recently formed on September 14 2022 and the stock has struggled to surpass that gap so far
- stock is trading below 21 day EMA and below 53 day EMA
There seems to be lack of confidence and /or lack of belief amongst bulls even at current levels to go Long in the stock.
The Blue line is where things might look better for TCS buyers (refer the chart below)
You can plan your trade accordingly.
Not getting in to details of trading idea here, as efforts don't get the deserved Likes and Follow. 😒
Best wishes & safe trading...!!!
Disclaimer
- The view expressed here is my personal view
- Past performance is not a guarantee for future predictions
- I have been wrong in the past and can be wrong again in future too
- Use this for educational purpose
- Any decision you take, you need to take responsibility for the same
- It's your hard earned money. Treat it wisely
- Trade / Invest keeping in mind your trading style, goals and objectives, time horizon & risk tolerance
- if trading in F&O, understand that F&O trading involves risk
- Do take proper risk management measures
- Do your own analysis and consult your financial adviser if need be

Gearing up for a breakoutResistance and support are well respected till now. Risk Reward very favorable for longs in this zone. All it needs is a trigger. Position sizing is very critical no matter how big your capital is. I get lot of questions on this subject. I always recommend going in chunks instead of all in. Maintain SL


TCS another breakdown on cards.Below 3080 it can tumble to 2950!Contrary to what everyone is shouting, IT sector still looks weak, With stocks breaking down with huge volumes, it seems there is still room left for IT to bottom out. Lets wait for better price action to buy WIPRO, TCS etc NSE:TCS


TCS 27 OCT 2022 Analysis-1x 27OCT2022 2900PE (₹ 11.05 )
+1x 27OCT2022 2720PE (₹ 2.95 )
Margin per lot- ₹ 30,266
ROI-₹ 1,215(4.01%)
There is a very important support at 2900, so very unlikely to cross that mark as only 10 days of trading session are there
The market has a bit been sideways for a few days but still breaking that level is very unlikely. NSE:TCS NSE:TCS

TCSI got entry at 3062 on friday 7 OCT
second day huge gape down but i didnt react watching 1 hr
I always decide my stop loss on in MIND but not fit into system
I always follow stoploss on Closing base like 1 hr big candle or Daily Candle closing basis stop loss
see patience and still holding my trade my target is 3168
why i am holding this stock
1. this it field too much oversold so it show bottoming signs
Mphasis also show divergence
and LTI & Mindtree also strong
IT Index also show reversal pattern
thats my study and many more thing
Thanking you for support
TVS motor showing topping Sign so lets see what happen

TCS long trade setup for October Educational purpose only: I have Two type of Eillot wave idea couldn't post which is mostly happen this confusion due to structural formation ... Both are identified but similar changes in wave 3 or wave 5 in higher degree this change my expectations.. then I wrote trade setup for this month ...
Target : 3450-3550
Critical stoploss: 2980.
When future updates are posting after the reaction of the stock....

Cnx IT and it stocks with index analysis for 11 october markets I daily make educational content videos for financial markets

TCS FOLLOW DOWN TREND CHANNEL PATTERNTcs Posting Good Results Today Spot Cmp 3118
Tcs Follow Down Trend Channel Lower Low Pattern
Important Levels
Above 3170 Go Long For Target 3300 ++
Below 3360 Go Short For Target 2800 ++

TCS- Short Term :Bulls Counter attackTCS- Short Term :Bulls Counter attack , up trend as long as it sustains above 3000 on closing basis. Potential targets - 3353

TCS Ready for quick fall,TCS seem to be falling for a next couple of days, may try to test 3000 again

TCS is in UptrendAs per my analysis , TCS is in Uptrend and I was updated all the support and resistance levels in this chart

TCS View for Earning Season - Oct 2022 Another view of TCS for this earning season..
WIll it follow the Elliot wave or harmonic pattern post results let me know who is successful in which direction in comments...
Downside 2930 Double bottom for Harmonic Entry
If breaks this level next going to see elliot wave 5 @ 2800 - 2700 levels
If holds 2930 and good results are posted since last few Qtr's have been negative
Upside good targets of Fib level 1.618 level last Target of 3490
Short & Medium level targets: 2198 / 2232 / 2375 / 3358
Support: tradingview.com/ gopro /?share_your_love=Gunshot321
All the Best Guys!!! :)
Regards

TCS Trend and financial Analysis Financial Analysis:
1) Debt free company
2) Higher PE Ratio compare to other
IT company
3) OPM Higher than other company
4) ROCE more than 40%
5) Cash Rich Company
6) Operating Expense increase will leads to shrink in Gross Margin(even though revenue increase).
7) if revenue and gross margin get shrink in upcoming Quarter definitely TCS will touch 2073 by end of mid 2024
8) if revenue decrease in upcoming Quarter definitely we can except pressure in IT Sector in upcoming Quarter

TCS at critical point. Make or break
Good Day
Hello Traders,
With Nifty IT Index falling from the All-Time high of 39446 to 26245 , a fall of 13201 points (-33.46% )
TCS with the weightage of 29.33% in Nifty IT Index made an all time high of 4043 made a recent low of 2926 (-27.62%).
If it started trading below 3000 then can go as low as 2880 very sharply, but with the current scenario one can
start accumulating for long term portfolio as it 28% cheaper. also you keep holding with strict stop loss of 3000 for a quick upside as its been IT stocks
are lagging behind.
Disclaimer : I am not SEBI registered analyst, this is for educational purposes.
Please trade as per your risk and do consult with your financial advisor before taking any
trading decisions.
If you really like the analysis , please do comments, LIKE and Follow me.

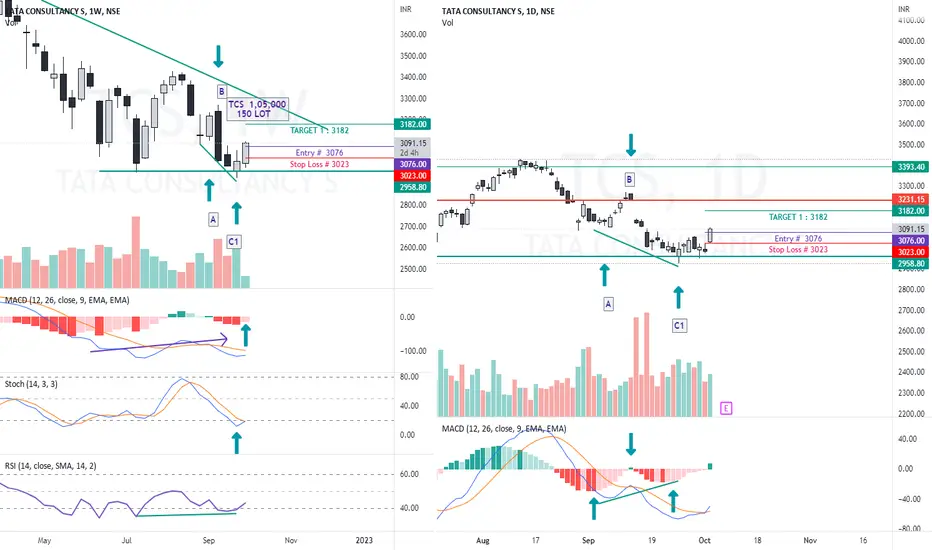
TCS As per Elder Impulse System Divergnceweekly MACD give Divergence Histogram Bar
Daily also give Divergence
Buy below as possible 3076
Stoploss 3023
target at least 1:2
TCS - Inverted HnS breakout - Good for LongTCS has given inverted Head and shoulder breakout at 3025 resistance level with good volume.
This seems to be good signal of trend reversal in the stock after underperformance since long.
Good for short / medium trade/investment.
SL: Hrly close below 2975 levels.

