How to make profit using Ex-Dividend dateStrategy will work in 70 to 80% cases. Strategy might fail if overall market conditions are opposite. Try this strategy with small Quantity on at least 4-5 stocks. Trade in good, blue-chip and FNO stocks to test this strategy.
Trade ideas

TCS - Trend strength analysis The analysis is as shown on the chart.
This is my view and for educational purpose only
Alert me know your thoughts in the comments section below.


tcsadd it in your watchlist
Always follow Risk and Position Management❇️❇️
For more information like this follow me in Tradingview @Jagadeesh11616125
Happy trading😊

TCS intraday for 16th Aug 2022Key Reference Points for Tcs for 16th Aug 2022.
I am not Sebi registered. This idea is just for education and research purposes.

SWING/POSITIONAL Idea for NSE:TCS(EQ)BUY Above 3428.70 for Targets 3503.70, 3625, 3746
DISCLAIMER: This idea is intended for educational purpose only.

TCS Daily Time frame. Breakout from Downward Channel.
And close above 16th April Anchired Avwap.
Good time for long position.
Entry : Above 3400.
Target : 3669
SL : 3334

TCS stock is good for swing trade TCS stock is good for swing trade. as a bullish flag pattern is forming in it
TCS stock resistance is broken and buy on breaking the high of todays candle
buy 3440 and sp is3320 and 1st target is3612 2nd target is3784

TCS INTRADAY SETUPTata consultancy services trading full day within a tight range with a open is equals to high price rejection pattern and in the end of the session today it reached to break triangle pattern and falling resistance trendline too relative strength indicator is also trending up it can give a good up move tomorrow if break falling trendline resistance so we can execute accordingly, check your setups too..
Note- I am not a sebi registered and authorized to give buy or sell recommendations ask your financial advisor before execution of investments and trade..

TCS intraday for 11th Aug 2022Key Reference Point for TCS 11th Aug 2022.
I am not a Sebi Registered. This is for education and research purposes.


TCS - ShortTCS CMP is at Resistance level . Bearish reversal pattern ( Hanging man pattern) can be seen. We can expect an trend reversal from here.
*Educational purpose only!

tcs Give a big brakout#sharemarket #stockmarket #nifty #sensex #investing #trading #nse #bse #stockmarketindia #stocks #indianstockmarket #investment #stockmarketnews #banknifty #finance #money #intraday #intradaytrading #investor #niftyfifty #dalalstreet #sharemarketindia #sharemarketnews #stockmarketinvesting #business #sharemarkettips #stock #india #indiansharemarket #rakeshjhunjhunwala

TCS give a big breakout chart patter ASCENDING TRIANGLE PATTERNTCS GIVE A Breakout on 15 min time frame ascending triangle pattern
#sharemarket #stockmarket #nifty #sensex #investing #trading #nse #bse #stockmarketindia #stocks #indianstockmarket #investment #stockmarketnews #banknifty #finance #money #intraday #intradaytrading #investor #niftyfifty #dalalstreet #sharemarketindia #sharemarketnews #stockmarketinvesting #business #sharemarkettips #stock #india #indiansharemarket #rakeshjhunjhunwala

TCS - Short Term BuyTCS - NSE:TCS - Short Term BUY
TCS (Tata Consultancy Limited) has been falling since last few days due to agressive selling in market . it has fallen from levels of 3300 in recent week. I Guess the impact of results has given good oppurtunity to enter this stock for short term . Kindly trade with Stoploss mentioned on chat to avoid any unfortunate trap in markets .
My Recent Buy/Sell Setup analysis on few stocks has been attached to Related Ideas below .
Happy Hunting ,
Chintamani :)

TCS now nearing long term buy zoneTCS after H&S breakdown at 3400 is now approaching 2900 levels. 200WEMA is near 2700 zone. Best levels for long term adding in range of 2700-2900 anyhow with conservative 10% CAGR for next 3 years. Risk reward ratio is 1:2

tcs longTCS can be bought for quick 10 percent gain ;breakout done ; Fundamentally strong stock ; Ab kya chaiye safe trade 10 percent ;

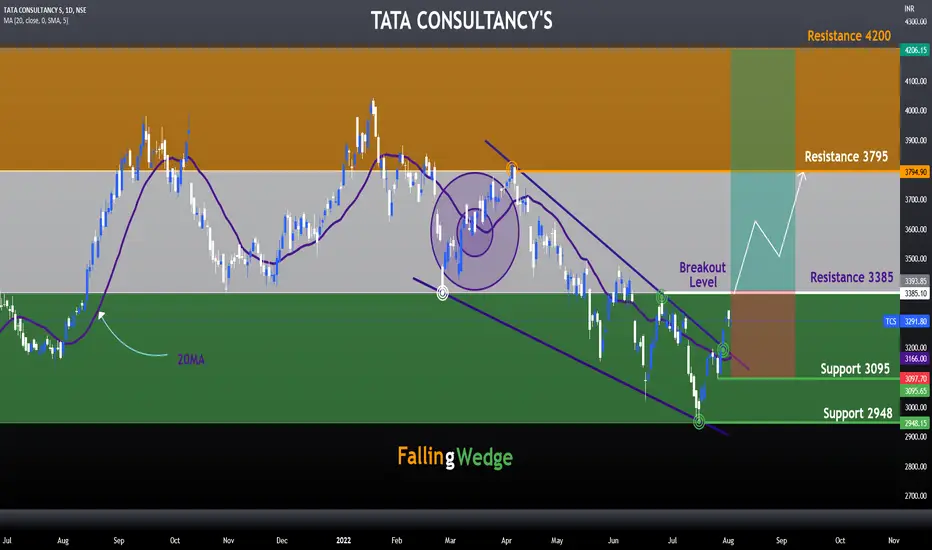
TCS Price Prediction -Aug'22In a daily time frame, TCS was observed in Falling Wedge Pattern Structure and Breakout also has done
The falling wedge is a bullish price pattern that represents a story about the market in which bulls are preparing for another push. A falling wedge pattern is bullish , although it appears after a bearish trend .The falling wedge pattern works as both a trend work as a trend reversal and a trend continuation pattern.If the falling wedge appears in a downtrend, it is considered a reversal pattern.
A falling wedge is an important technical formation that signals that the correction, or consolidation, has just ended as the asset’s price left the wedge to the upside and, in most cases, the continuation of the overall trend is taking place.
In Current structure we can see that the price has been higher than the 20 MA level ,which is good sign for Bullish and also price has given breakout above the resistance level talong with good volume accumulation.
Currently, TCS is at 3291 Rs , If the pattern continues , the price of TCS might reach the 3795 Rs level . If the trend reversed, then the price of TCS may fall to 3095 Rs level
Key Factor
Falling Wedge - Bullish Reversal Pattern
20MA - Price above 20 MA
Happy Trading ! Jai Hind !
TCSTCS
If 15min bar closes above 3333, then we can expect target level at 3430 with stop loss level at 3250.
If 15min bar closes below 3252, then we can expect target level at 3180 with stop loss level at 3333.

would like to wait for levels not in hurry as of now.please refer to the chart.
Gratify if you appreciate the practice then you can like it, share it and
If you want me to investigate any chart for you then would cherish doing that for you.
Thank you for your time and support.
Stay safe.

TCS Shooting Star - Learning Pattern shooting Star
High 3317.30
1:1 ratio target 3247.
MACD Divergence Negative.
Time-frame 1H

very nice opportunity in tcs with full quantityfor understanding this trade, we have to consider very different aspects of charts on a different time frame...
first we see chart on 1d timeframe...
we have drawn 3 line...two dotted and one green line...
after 2 dotted line...we are considering this green line as a actual trend-line....because from green line...first time market is about to cross previous high...
that's why we neglected the previous two line...(dotted one)
but the risk to reward is poor in 1D time frame....
so we comedown to 1h time frame, where we can see small trend-line which is supporting upward direction move....when can also place stop loss below this trend-line .
we took this trade at 3284...for conservative way would be to take trade near trendline..which will be somewhere around 3180
