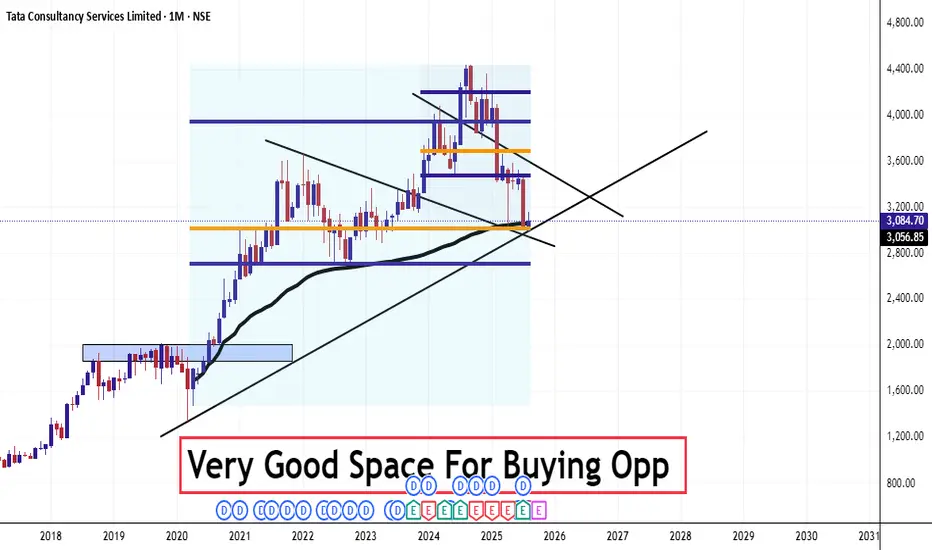
TCS BULLISHbulls its time to enter trade in tcs
buy @3861-3870
stoploss -3671
targets - 3955 4062 4188 4313
like the support if you see its genuine, follow me further analysis
this idea is for educational purpose
happy trading
Trade ideas

Part 10 Trading Master Class With ExpertsOptions in Hedging
Options are not only for speculation. Big institutions use them for hedging.
Portfolio Hedge: A fund holding ₹100 crore worth of Nifty stocks may buy Nifty puts. If the market crashes, puts rise in value, cushioning losses.
Corporate Hedge: A company expecting payment in USD may buy currency options to protect against rupee appreciation.
Commodity Hedge: A farmer may use options to lock in selling prices for crops.
Hedging reduces uncertainty and stabilizes income.
Options in Speculation
Speculators love options because:
Small premium = big exposure.
High leverage = high potential returns.
Flexibility to bet on direction, volatility, or time.
But speculation is risky. Most retail traders lose because they treat options as lottery tickets.
Options for Income Generation
Option sellers (writers) earn premium by providing liquidity to buyers.
Covered Call Writing: Regularly selling calls on owned stock generates income.
Cash-Secured Puts: Selling puts on stocks you’re willing to buy at lower prices.
Range-Bound Strategies (Iron Condors, Butterflies): Earn premium if stock stays within range.
Many professionals and institutions rely on option selling for consistent income.

TCS No matter how much fear is there in the marketNo matter how much fear is there in the market, the price will always fall in the price of that stock where the fear of its fall is in the minds of the people. The price falls only when people sell. People sell where they know that the price has become expensive. That is why the expensive stock always falls and the money shifts to those stocks where the price becomes stable.
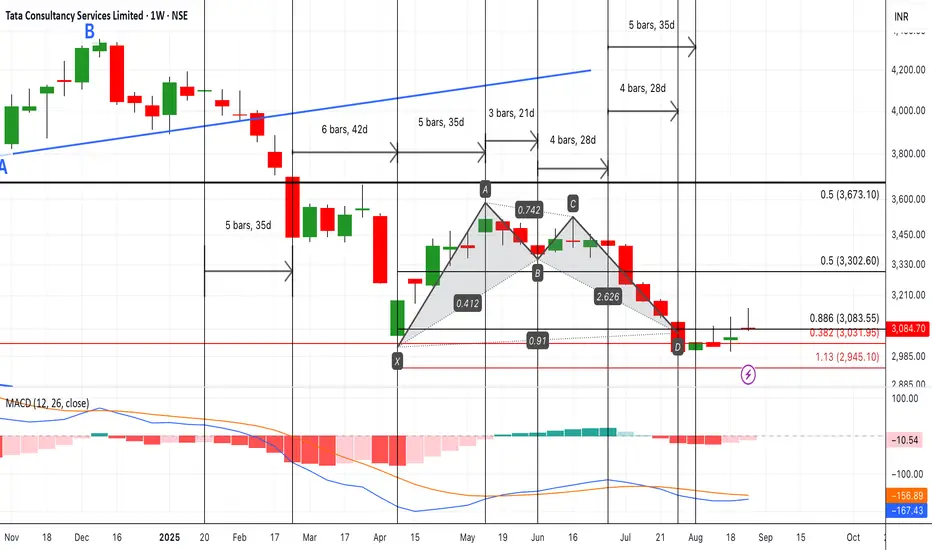
TCS LOOKING FOR TURNAROUND Keep #TCS on radar 🚀 Weekly MACD histogram shows bullish divergence + positive DMI. A bullish alt Bat harmonic also visible on weekly scale. Just a MACD positive cross needed to ignite momentum in next 1–2 months. expecting 3450
Options Watchlist — An Educational View of OI & Price Action________________________________________
📊 Options OI Trade Outlook — Bearish Setups Only
“This analysis is shared purely for educational purposes and market awareness — not a trading recommendation.”
(Educational Purpose | Not Financial Advice | SEBI Compliant)
Hello Traders 👋,
Here are 4 Bearish option setups based on today’s OI + Price Action + IV + Greeks study.
This is strictly for learning and educational purposes.
________________________________________
🔴 1. TCS 3200 PUT
LTP: 118.15
Sentiment: Bearish | Trend: Down | Strength: 5/5 (Strong)
IV: 17.7 | Delta: -0.63 | Theta: -0.93 | Vega: 3.5
Buildup: Long Build-up
Why?
3200 PE shows a Long Build-up with price up 40.4% and OI up 33.6%, confirming strong bearish positioning.
Volume surged +65%, showing active participation. IV eased (-5.4%), keeping premiums cheaper. Delta -0.63 signals high sensitivity to downside moves.
________________________________________
🔴 2. SBIN 820 PUT
LTP: 21.65
Sentiment: Bearish | Trend: Down | Strength: 5/5 (Strong)
IV: 14.8 | Delta: -0.56 | Theta: -0.31 | Vega: 0.95
Buildup: Long Build-up
Why?
820 PE reflects a Long Build-up with price rising 20.6% and OI also increasing — a textbook bearish confirmation.
Low IV (14.8) makes premiums attractive. Delta -0.56 shows quick reactivity to price moves.
________________________________________
🔴 3. INFY 1520 PUT
LTP: 42.80
Sentiment: Bearish | Trend: Down | Strength: 5/5 (Strong)
IV: 20.8 | Delta: -0.51 | Theta: -0.63 | Vega: 1.79
Buildup: Long Build-up
Why?
1520 PE shows heavy Long Build-up, with price up 36.5% and OI exploding 106%.
Volume spiked strongly, reflecting aggressive bearish positioning. IV is moderate (20.8), while Delta -0.51 indicates solid responsiveness to further downside.
________________________________________
🔴 4. LT 3600 PUT
LTP: 81.0
Sentiment: Bearish | Trend: Down | Strength: 2.5/5 (Moderate)
IV: 16.9 | Delta: -0.50 | Theta: -1.58 | Vega: 4.26
Buildup: Short Build-up
Why?
3600 PE shows a Short Build-up, with price falling 10.3% while OI rose 41%, pointing to fresh shorts.
Volume surged +29%, confirming activity. IV is steady at 16.9, and Delta -0.50 indicates balanced downside exposure.
________________________________________
⚠️ Disclaimer – Please Read Carefully
The information shared here is meant purely for learning and awareness.
It is not a buy or sell recommendation and should not be taken as investment advice.
📌 I am not a SEBI-registered investment advisor.
📌 All views expressed are based on personal study, chart patterns, and publicly available data.
📌 Trading — whether in stocks or options — carries risk. Markets can move unexpectedly, and losses can exceed capital.
📌 Past setups do not guarantee future outcomes.
👉 Beginners: use this to learn market behavior, practice with paper trades before risking money.
👉 Experienced traders: apply your own risk management, sizing, and strategy filters.
👉 Always consult a SEBI-registered financial advisor before real trades.
By engaging with this content, you acknowledge full responsibility for your own trading and investments.
________________________________________
💬 Found this useful?
🔼 Boost this post to help more traders learn.
✍️ Share your thoughts/setups in comments — let’s grow together.
🔁 Share with fellow traders & learners.
👉 “Follow for more clean, structured breakdowns with discipline at the core.”
🚀 Stay Calm. Stay Clean. Trade With Patience.
Trade Smart | Learn Zones | Be Self-Reliant 📊
________________________________________
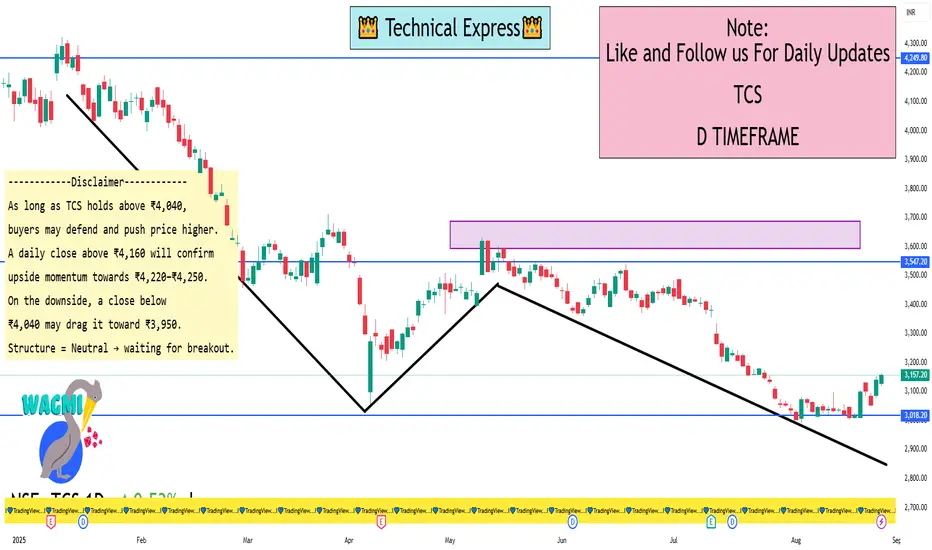
TCS 1 Day View TCS – 1 Day Timeframe Levels
🔹 Support Levels:
₹4,040 – 4,060 → Strong demand zone, recent bounce levels.
₹3,950 – 3,970 → Next major support if weakness continues.
₹3,850 → Broader support, trend-defining zone.
🔹 Resistance Levels:
₹4,140 – 4,160 → Immediate supply zone.
₹4,220 – 4,250 → Strong resistance; multiple rejections earlier.
₹4,300+ → Breakout level, opens path for higher rally.
View (Daily Structure)
Price is consolidating between ₹4,040 support and ₹4,160 resistance.
A daily close above ₹4,160 may trigger upside momentum toward ₹4,220–₹4,250.
A break below ₹4,040 could invite selling pressure toward ₹3,950.
Currently in a sideways consolidation, awaiting breakout for clear trend.
Part 4 Learn Institutional Trading Advanced Strategies
Straddle: Buy a call and a put at the same strike and expiry to profit from volatility.
Strangle: Buy OTM call and put for cheaper volatility bets.
Spread Strategies: Combine multiple calls or puts to limit risk and reward:
Bull Call Spread: Buy call at lower strike, sell call at higher strike.
Bear Put Spread: Buy put at higher strike, sell put at lower strike.
Iron Condor: Combine calls and puts to profit from low volatility.
Butterfly Spread: Profit from minimal movement around a central strike.
Pricing of Options
Option pricing is influenced by several factors:
Intrinsic Value
The real value if exercised today.
Call option IV = Max(Current Price – Strike, 0)
Put option IV = Max(Strike – Current Price, 0)
Time Value
Extra premium due to time until expiration.
TV = Option Premium – Intrinsic Value

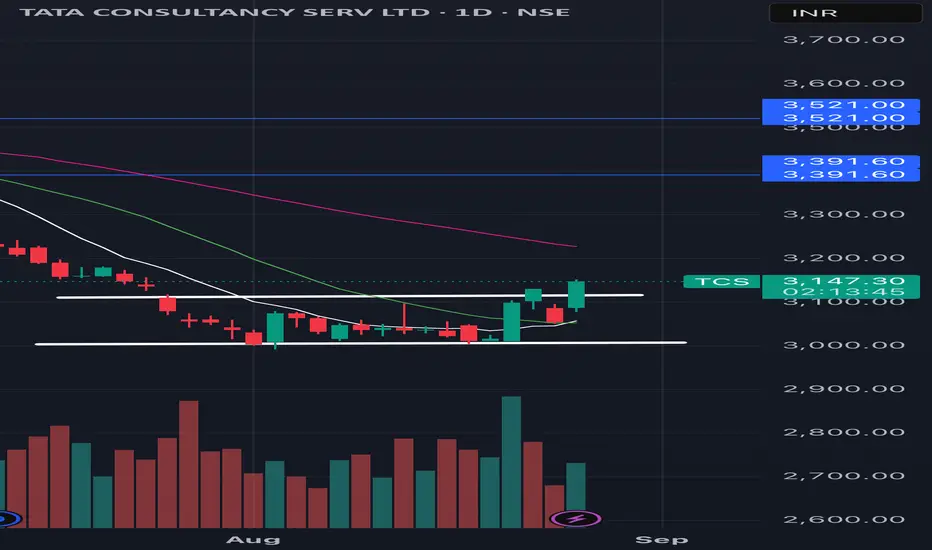
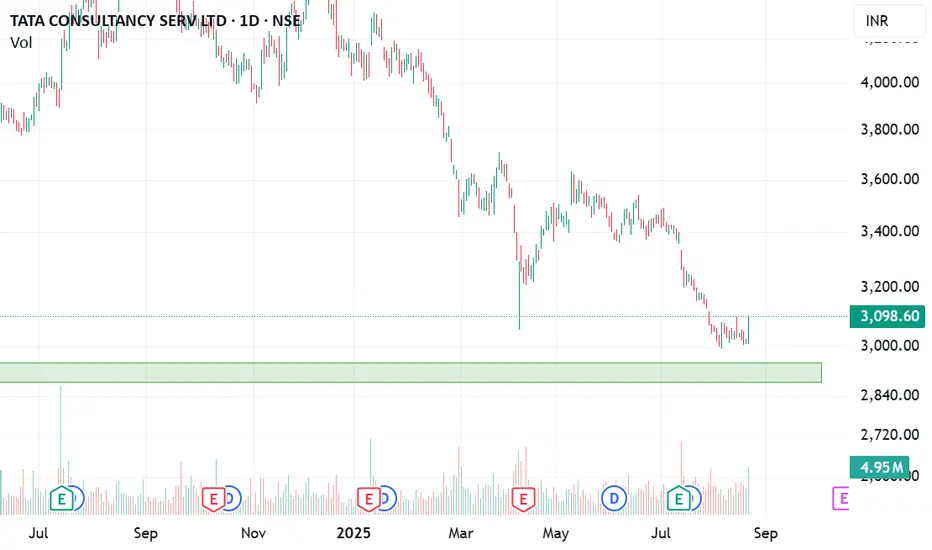
TCS – upport Bounce with Volume Confirmation📊 TCS – Technical & Educational Snapshot
Ticker: NSE:TCS | Sector: 💻 IT Services
CMP: ₹3,140.60 ▲ (+2.84% | 26 Aug 2025)
Learning Bias (for study purpose): ⭐⭐⭐ (Cautiously Bullish)
Pattern Observed: 📈 Support Bounce with Volume Confirmation
📰 Sentiment Analysis
👉 Overall Sentiment: Moderately Positive ✅
Bullish Drivers:
• Bounce from strong support near ₹3,000 with bullish candle & above-avg volume
• RSI breakout + Bollinger Band expansion → fresh buying interest
• Publicly available analyst reports indicate average estimates around ₹3,725; strong bullish case highlighted up to ₹4,610
• IT sector optimism for H2 FY26 earnings recovery
Risks (Bearish Case):
• Broader trend still marked Downtrend ⚠️
• Stochastic at 92 → overbought in short-term
• Employee layoffs & union protests (~12K–30K) may dampen sentiment
• Failure to hold ₹3,047 (support) could trigger deeper correction
Short-term Outlook: Upside momentum possible towards ₹3,160–3,200, but resistance supply zone must be watched.
Long-term Outlook: Positive — strong fundamentals, debt-free balance sheet, consistent dividends, and sector recovery cues.
📊 Technical Snapshot
TCS has formed a support bounce near the ₹3,000 bottom range, supported by a strong bullish candle and above-average volume.
Indicators: MACD bullish on daily/weekly, neutral-to-bearish on monthly.
RSI ~54 → healthy momentum without being overheated.
Trend direction still tagged as Downtrend, hence positional caution is advised.
📊 Volume Check
🔹 Current Volume: 3.45M
🔹 20 SMA Volume: 2.84M ✅
💥 Above-average participation → validates breakout reliability.
💡 Interpretation: Stronger demand from institutions/traders supporting price action.
💡 Learnings
Support bounces near psychological zones (₹3,000 in this case) often attract buying interest.
When combined with RSI breakouts, Bollinger Band expansion, and volume confirmation, the setup becomes more reliable.
However, overbought stochastic warns of possible near-term pullbacks — hence, stop-loss discipline is key.
📌 Key Levels
Resistance: 3,169 | 3,198 | 3,244
Support: 3,094 | 3,048 | 3,019
Fibonacci Reference Levels: 2,991 | 3,142 | 3,235 | 3,311 | 3,386 | 3,494 | 3,631
🎯 STWP Learning Reference
• Observed bounce zone: ~₹3,152
• Key support level: ~₹3,047
• Upside reference zones (if momentum continues): 3,200 | 3,244 | 3,310
• Pullback watch zone: 3,048–3,095
• Invalidation reference: Below 2,991 → momentum weakens
⚠️ Disclaimer – Please Read Carefully
This post is shared only for educational and informational purposes. It is not investment advice or a recommendation to buy/sell any security. I am not a SEBI-registered investment advisor. Please do your own research or consult a SEBI-registered advisor before making trading or investment decisions.
Trading and investing involve risk. Past performance or past setups do not guarantee future results. Always use stop-loss, proper position sizing, and risk management.
💬 Found this useful?
🔼 Boost this post to help more traders discover clean setups.
✍️ Share your thoughts, setups, or questions in the comments — let’s learn together.
🔁 Repost to spread awareness among traders & beginners.
✅ Follow simpletradewithpatience for clean charts, price action insights & beginner-friendly setups.
🚀 Stay Calm. Stay Clean. Trade With Patience.
Trade Smart | Learn Zones | Be Self-Reliant 📊
Part 2 Support and ResistanceWhy Trade Options? (Advantages)
Leverage: Small capital controls big positions.
Hedging: Protect stock portfolio from losses.
Flexibility: Profit in bullish, bearish, or sideways markets.
Income: Selling options generates consistent premiums.
Risk Control: Losses can be predefined by structuring trades.
8. Risks of Options Trading
Time Decay (Theta): Options lose value as expiration approaches.
Liquidity Risk: Not all options are actively traded.
Complexity: Strategies can be difficult for beginners.
Unlimited Risk (for sellers): Selling naked calls can wipe out capital.
Over-leverage: Small margin requirements may encourage oversized positions.

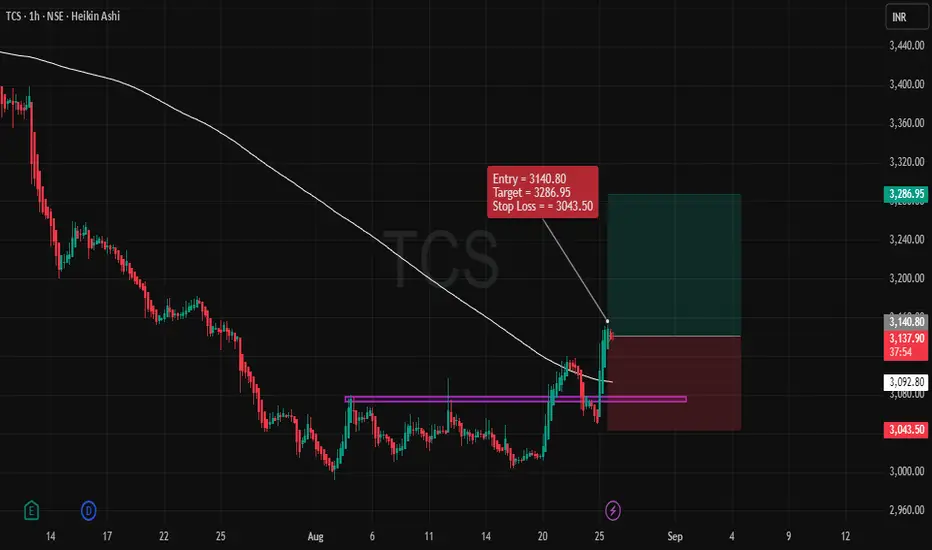
TCS – Bullish SetupSummary:
This trade setup is based on a bullish momentum seen in the recent price action of TCS. We are entering the position with the expectation that the price will continue to rise, following a significant upward breakout. The entry, stop loss (SL), and target price (TP) levels are set, and the risk-to-reward ratio (RRR) is favorable.
Key Points of the Trade:
Entry Point:
The entry for this position is at 3140.80, which is above the recent support level, indicating the continuation of the upward trend. The entry is triggered as the price has recently started to break through a key resistance zone, suggesting that the bullish momentum is likely to continue.
Stop Loss (SL):
The stop loss is set at 3043.50, just below the recent support zone. This ensures that we have a protective exit if the market reverses. Placing the stop loss here helps mitigate risk in case the trade goes against us.
Target Price (TP):
The target for this trade is 3286.95, a price level that corresponds to a recent resistance point. This target has been chosen based on the potential upside movement following the breakout, providing a good area for price to reach based on historical price action.
Risk-Reward Ratio (RRR):
With the entry at 3140.80, the stop loss at 3043.50, and the target at 3286.95, the RRR stands at 1:1.5. This is a healthy ratio, ensuring that the potential reward outweighs the risk, which is crucial for effective swing trading.
Market Context:
The price has recently bounced off a support level, and we are observing strong bullish momentum as the price moves above the resistance area. This suggests the market may continue its upward movement, making the trade setup valid.
Confirmation:
The recent price action and the movement above key levels provide confirmation of the trade. Additionally, the overall market sentiment for TCS is positive, which further validates the bullish trade idea.
Conclusion:
This trade setup is a bullish scenario for TCS, with a clear entry, stop loss, and target price. The risk-to-reward ratio is favorable, making this a logical and worthwhile trade to consider for swing trading on the 1-hour timeframe. Keep an eye on any changes in momentum or price action that may suggest a reversal, but as of now, the trend looks strong.
Tcs long playTcs can sustain here as strong support is there we can go long above 3150 with the target of 3400/3500
wait for the entry and enjoy the long momentum from here

TCSNice range breakout in stock
looks good for adding at current levels for a target of 3200-3250-3300-3400+
Part 3 Learn Institutional TradingOption Greeks – The Science Behind Pricing
Options pricing is influenced by multiple factors. These sensitivities are known as the Greeks:
Delta – Measures how much option price changes with stock price.
Gamma – Rate of change of Delta.
Theta – Time decay (options lose value daily).
Vega – Sensitivity to volatility.
Rho – Sensitivity to interest rates.
Example: A call option with Delta = 0.6 means for every ₹10 rise in stock, option premium increases by ₹6.
Basic Option Strategies (Beginner Level)
Buying Calls – Bullish bet.
Buying Puts – Bearish bet.
Covered Call – Hold stock + sell call for extra income.
Protective Put – Own stock + buy put for downside insurance.

A rally in the IT sector likelyNifty IT and TCS
Elliott - The index has completed the B wave correction and now the C wave rally will take it to 41600. logic A=C. The tgt at 41600 is a good 17% from CMP. On the other hand the rally in TCS will take it to 3550. This is a good 15% from CMP.
Conclusion - Since this is a corrective pattern the downfall will again resume post the rally. So definitely an opportunity for traders. If the Index will move 17% I am sure there will be many in the IT pack that has more potential.

Part3 Trading MasterclassOption Trading vs Stock Trading
Stocks = Ownership, long-term growth, dividends.
Options = Contracts, leverage, flexible strategies.
Stocks = Simpler, but capital-intensive.
Options = Complex, but require less capital and offer hedging.
For example:
Buying 100 shares of Reliance at ₹2500 = ₹2,50,000.
Buying 1 call option of Reliance at ₹100 premium with lot size 250 = only ₹25,000.
This leverage makes options attractive—but also riskier.
Real-Life Examples & Case Studies
Case 1: Bull Market
A trader buys Nifty 20000 Call at ₹200 premium. Nifty rallies to 20500. Profit = ₹300 (500 – 200). Huge return on a small premium.
Case 2: Bear Market
Investor holds TCS shares but fears a fall. Buys a protective put. When stock drops, put increases in value, reducing losses.
Case 3: Neutral Market
Trader sells an Iron Condor on Bank Nifty, betting price will stay range-bound. Premium collected = profit if market stays sideways.

Types of Financial MarketsIntroduction
Finance is the backbone of any economy, and at the center of this financial ecosystem lie the financial markets. These markets serve as platforms where buyers and sellers engage in the exchange of financial instruments such as stocks, bonds, currencies, derivatives, and commodities. They enable efficient capital allocation, liquidity creation, and wealth distribution in an economy.
Understanding financial markets is crucial for investors, traders, policy makers, and even the general public because these markets influence everything from government policies to personal investment decisions.
Broadly, financial markets can be categorized into several types based on the instruments traded, the maturity of securities, the nature of participants, and the purpose they serve.
In this article, we will explore:
The functions of financial markets
Major types of financial markets
Examples and their relevance in the real economy
Advantages and challenges of each type
How they interconnect to form the global financial system
Functions of Financial Markets
Before diving into the types, let’s understand why financial markets exist and what purpose they serve:
Capital Formation: They channel funds from savers (households, institutions) to borrowers (businesses, governments).
Liquidity: They provide an avenue to convert financial instruments into cash quickly.
Price Discovery: Markets determine the fair value of financial instruments through demand and supply forces.
Risk Management: Through derivatives and insurance-like instruments, investors can hedge against risks.
Efficient Allocation of Resources: Funds flow toward businesses and projects with the most promising prospects.
Economic Growth: They support industrial expansion, innovation, and employment by financing new ventures.
Broad Classification of Financial Markets
Financial markets can be broadly divided into two categories:
Money Market – Deals with short-term funds (less than one year).
Capital Market – Deals with long-term funds (more than one year).
From here, multiple subcategories exist, including stock markets, bond markets, forex markets, derivatives markets, and commodity markets.
1. Money Market
The money market is where short-term borrowing and lending take place, usually for periods of less than one year. It is essential for maintaining liquidity in the financial system.
Instruments in the Money Market
Treasury Bills (T-Bills): Issued by the government to raise short-term funds. They are risk-free and highly liquid.
Commercial Papers (CPs): Short-term unsecured promissory notes issued by corporations.
Certificates of Deposit (CDs): Issued by banks, offering fixed returns over short maturities.
Repurchase Agreements (Repos): Short-term loans where securities are sold with an agreement to repurchase later.
Call Money Market: Interbank lending for very short durations (even overnight).
Importance
Provides liquidity to banks and institutions.
Helps governments manage short-term funding needs.
Facilitates monetary policy operations by central banks.
2. Capital Market
The capital market deals with medium to long-term financing. It is divided into primary markets (new securities issued) and secondary markets (trading of existing securities).
A. Primary Market
Companies issue Initial Public Offerings (IPOs) to raise funds.
Governments issue bonds for infrastructure or development projects.
Investors provide funds directly to businesses.
B. Secondary Market
Existing securities (stocks, bonds) are traded among investors.
Provides liquidity and exit opportunities for investors.
Examples: NSE, BSE, NYSE, NASDAQ, LSE.
Functions
Mobilizes savings into investments.
Provides companies with access to long-term funding.
Encourages corporate growth and expansion.
3. Stock Market (Equity Market)
The stock market is perhaps the most well-known type of financial market. It deals with the buying and selling of company shares.
Types
Primary Stock Market: Where companies issue new shares (IPOs, FPOs).
Secondary Stock Market: Where existing shares are traded.
Key Global Stock Exchanges
New York Stock Exchange (NYSE) – USA
NASDAQ – USA
London Stock Exchange (LSE) – UK
Bombay Stock Exchange (BSE) – India
National Stock Exchange (NSE) – India
Tokyo Stock Exchange (TSE) – Japan
Importance
Helps companies raise equity capital.
Provides investors with wealth creation opportunities.
Reflects economic conditions of a country.
4. Bond Market (Debt Market)
The bond market (or debt market) is where governments, corporations, and institutions issue debt securities to raise capital.
Types of Bonds
Government Bonds (Sovereign Bonds): Risk-free, issued to fund government expenditure.
Corporate Bonds: Issued by companies for long-term financing.
Municipal Bonds: Issued by local governments for projects like schools or infrastructure.
Convertible Bonds: Can be converted into equity at a later date.
Role
Provides predictable returns to investors.
Allows governments to finance fiscal deficits.
Offers diversification to investors who seek lower risk than equities.
5. Derivatives Market
The derivatives market deals with financial contracts whose value is derived from underlying assets such as stocks, bonds, commodities, or currencies.
Types of Derivatives
Futures Contracts: Agreement to buy/sell at a future date at a predetermined price.
Options Contracts: Right, but not obligation, to buy/sell at a specific price.
Swaps: Exchange of cash flows (e.g., interest rate swaps, currency swaps).
Forwards: Customized contracts between two parties.
Importance
Helps manage risk (hedging).
Provides leverage opportunities for traders.
Facilitates price discovery.
6. Foreign Exchange (Forex) Market
The Forex market is the world’s largest financial market, where currencies are traded.
Key Features
Decentralized, operates 24/7 globally.
Daily turnover exceeds $7 trillion (2025 estimate).
Major currency pairs: EUR/USD, GBP/USD, USD/JPY, USD/INR.
Participants
Central banks
Commercial banks
Corporations
Hedge funds
Retail traders
Importance
Facilitates global trade and investment.
Provides a mechanism for hedging currency risks.
Enables speculation on exchange rate movements.
7. Commodity Market
The commodity market deals with raw materials and primary products such as gold, silver, oil, natural gas, agricultural products, and metals.
Types
Hard Commodities: Metals, oil, natural resources.
Soft Commodities: Agricultural products like coffee, wheat, sugar.
Examples of Commodity Exchanges
MCX (Multi Commodity Exchange) – India
NCDEX (National Commodity & Derivatives Exchange) – India
CME (Chicago Mercantile Exchange) – USA
LME (London Metal Exchange) – UK
Importance
Enables producers and consumers to hedge against price fluctuations.
Provides opportunities for traders and investors.
Plays a vital role in inflation and cost-of-living measures.
8. Insurance Market
The insurance market is a specialized financial market that provides risk protection.
Individuals and businesses pay premiums to insurance companies.
Insurers pool risks and pay claims in case of insured events.
Examples: Life insurance, health insurance, property insurance, reinsurance.
9. Mortgage Market
This market deals with loans secured by real estate (housing or commercial properties).
Primary Mortgage Market: Direct lending between banks and borrowers.
Secondary Mortgage Market: Mortgages are bundled and sold as securities (Mortgage-Backed Securities – MBS).
The 2008 Global Financial Crisis highlighted the risks in this market when mortgage-backed securities collapsed.
10. Cryptocurrency Market
A relatively new market, cryptocurrencies operate on blockchain technology.
Examples
Bitcoin (BTC)
Ethereum (ETH)
Ripple (XRP)
Solana (SOL)
Features
Decentralized and borderless.
Volatile but offers high returns.
Increasingly gaining mainstream adoption.
Conclusion
Financial markets are the lifeline of modern economies. They are diverse, ranging from traditional stock and bond markets to emerging cryptocurrency and derivative markets. Each type serves a unique function – from providing short-term liquidity to enabling long-term capital formation, risk management, and global trade facilitation.
For individuals, understanding these markets opens up opportunities for wealth creation, portfolio diversification, and financial security. For nations, well-functioning financial markets are critical to sustaining growth, innovation, and stability.
As economies evolve with digital technologies and globalization, financial markets will continue to expand and innovate, offering both opportunities and challenges.

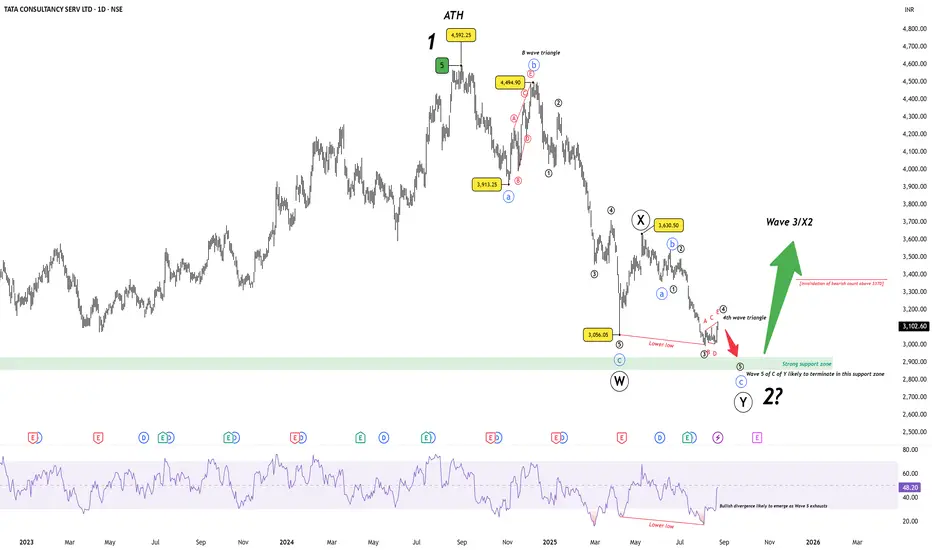
TCS – Wave 2 Correction Nearing Completion?TCS has been in a prolonged corrective phase since the all-time high at ₹4592. The decline has unfolded best as a W–X–Y double zigzag, with the current leg (Wave Y) progressing into its final stages.
Wave W ended at ₹3056 after a sharp A–B–C decline.
Wave X retraced to ₹3630.
Wave Y is in progress, and its C leg appears close to exhaustion. A mini 4th-wave triangle has developed, suggesting a final push lower remains.
The termination zone for Wave 2 is highlighted between ₹2926–₹2850, aligning with the prior Wave 4 support zone. Importantly, bullish divergence is likely to emerge on RSI if price makes a marginal new low.
Key Levels:
Support zone : 2926–2850 (probable Wave 2 low).
Bearish invalidation : A sustained move above 3370 would invalidate the immediate bearish count.
Bigger picture : If this structure holds, it would complete Wave 2 of a higher degree, setting the stage for a powerful Wave 3 rally ahead.
Disclaimer: This analysis is for educational purposes only and does not constitute investment advice. Please do your own research (DYOR) before making any trading decisions.
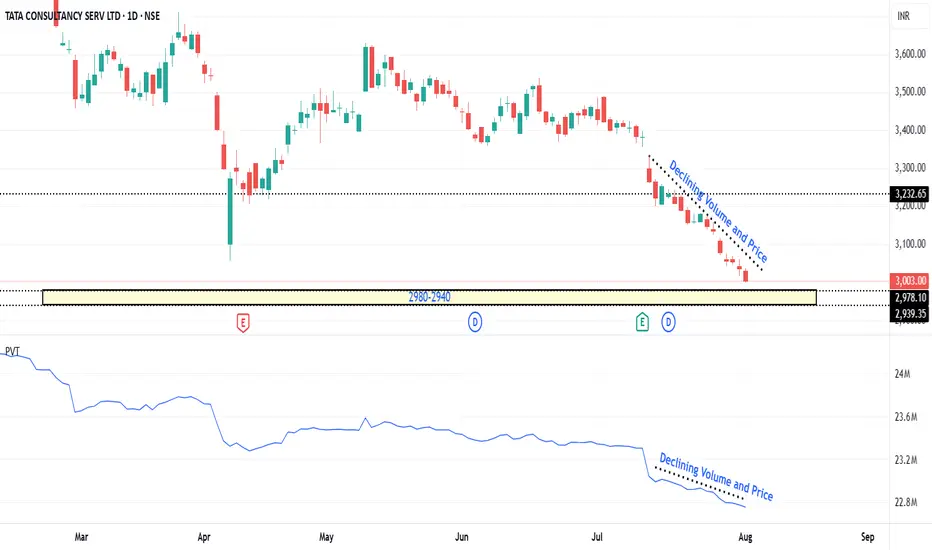
TCS in change of trend modeTCS 3003 has support at 2980-2940 zone. We expect TCS has more possibilities to change its trend to 3140 once the zone tested.
In worst case if zone violated exit and re-enter when Price enter back in to this zone
Currently trading at 22 PE of FY26 which is of Feb20 PE valuation.
Part 6 Institutional Trading When to Use Each Strategy
Bullish Market → Long Call, Bull Call Spread, Covered Call.
Bearish Market → Long Put, Bear Put Spread.
Sideways Market → Iron Condor, Butterfly, Covered Call.
High Volatility → Straddle, Strangle.
Low Volatility → Credit Spreads, Iron Condor.
Risk Management in Options
Options can be dangerous if used blindly. Key risk management rules:
Never sell naked options without hedge (unlimited risk).
Use position sizing – don’t risk more than 2–5% of capital in one trade.
Always track Greeks:
Delta (directional risk),
Theta (time decay),
Vega (volatility risk),
Gamma (rate of change).
Use stop-loss even in options.

TCS may drip down in the coming week?In the current chart pattern, TCS seems to be on the border of completing its minute wave 4 and may see a fall in the coming days to complete its wave 5.

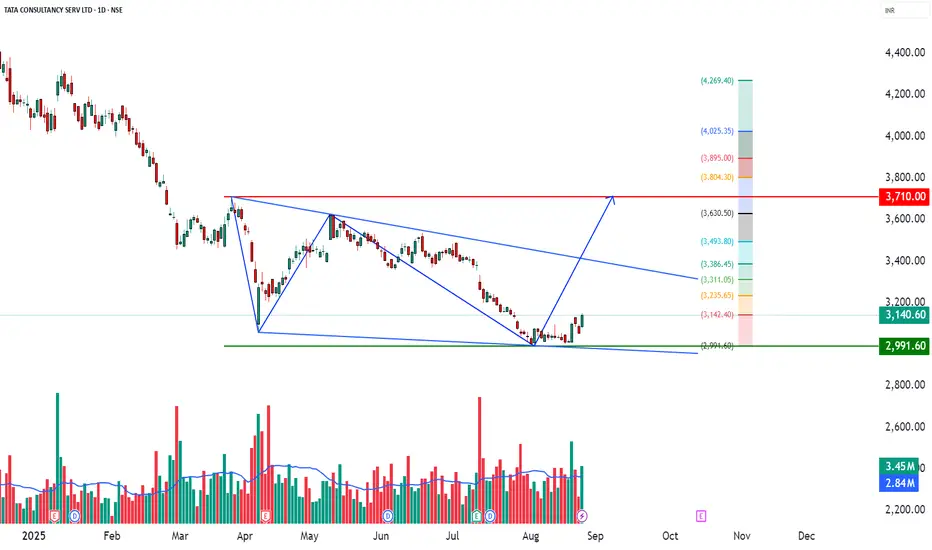
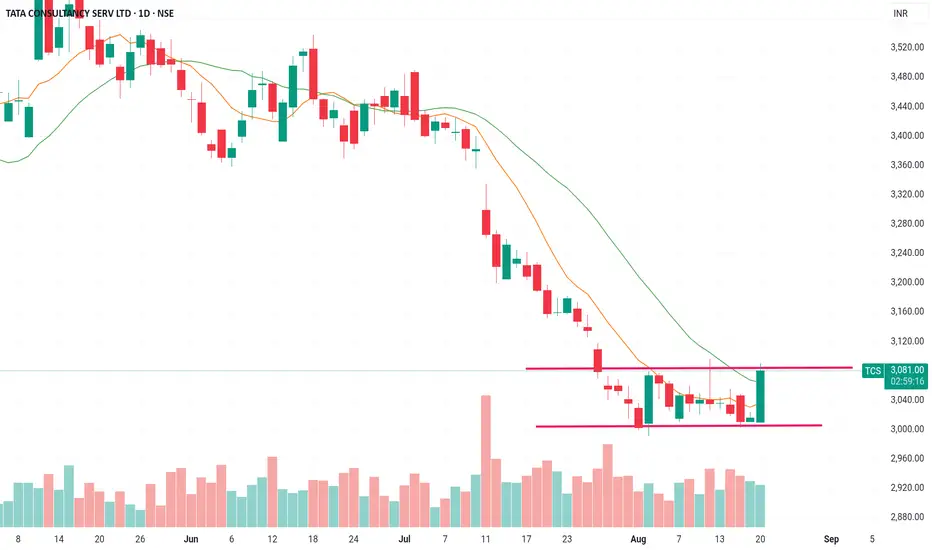
Chart Analysis - TCS1) Weekly support (context)
Price is sitting near a multi-week demand zone (prior swing lows / consolidation base). Weekly supports matter because bigger timeframes filter noise and attract institutional flows.
When price returns to a weekly support and stabilizes, it often transitions from distribution to accumulation.
2) Daily double bottom (pattern)
A double bottom forms when price tests a low, bounces, then retests roughly the same low and rejects it again. That shows buyers defending the level twice.
The neckline is drawn across the swing high between the two lows. A daily close above the neckline confirms the pattern.
3) Volume confirmation
Healthy: rising volume on up-days, especially on the rally from the second bottom and on the neckline breakout. That says demand is active, not just a technical bounce.
4) Risk line (“invalidates below today’s low”)
Your statement “bullish till it holds today’s low” defines a clear invalidity level. If price closes below today’s low, it suggests the second bottom failed—cut risk there.
5) Trade planning (illustrative, not advice)
Entry ideas:
(a) Aggressive: near current price with stop just below today’s low.
(b) Conservative: on a confirmed close above the neckline, or on a pullback/retest to the neckline that holds.
Stops: A few ticks below today’s low (aggressive) or below retest low (conservative).
Management: Scale partial at interim resistance; trail stop under higher lows / 20-EMA on the daily.
6) What would weaken the setup
Weak or declining volume on rallies, repeated rejections at the neckline, or a decisive daily close below today’s low/weekly support.
In short: Weekly support + daily double bottom + volume = constructive. Confirmation comes with a neckline break; invalidation is a close below today’s low.
TCSGood for bottom fishing. If price closes above 21 Ema and horizontal resistance line, I would like to add a long position with stop loss below 3000.
Inflation & Interest Rates Shape Commodity PricesIntroduction
Commodities are the building blocks of the global economy. Crude oil fuels industries and transport, metals like copper and aluminum are vital for infrastructure and technology, while agricultural products like wheat, corn, and soybeans feed billions of people. But what truly drives their prices beyond just supply and demand?
Two of the most powerful forces are inflation and interest rates. These economic levers not only dictate consumer purchasing power and business costs, but also ripple through investment flows, currency valuations, and ultimately, the price of commodities across the globe.
In this discussion, we’ll dive deep into how inflation and interest rates shape commodity markets, exploring both theory and real-world cases, while keeping the explanation practical and easy to follow for traders, investors, and learners.
1. The Link Between Commodities and Inflation
1.1 Why Commodities Reflect Inflation
Commodities are often called the “canary in the coal mine” for inflation. That’s because:
When prices of raw materials like oil, metals, and food rise, the cost of finished goods increases.
Rising commodity prices feed into Consumer Price Index (CPI) and Wholesale Price Index (WPI).
This makes commodities not just a victim of inflation but also a driver of inflation.
For example:
If crude oil rises from $60 to $90 per barrel, fuel prices climb, logistics costs rise, and nearly every product (from groceries to electronics) becomes more expensive.
If wheat and corn prices jump, bread, meat, and packaged foods see higher retail prices.
Thus, inflation and commodities have a feedback loop.
1.2 Commodities as an Inflation Hedge
Investors often rush into commodities during inflationary times. Why?
Unlike paper currency, which loses value when inflation is high, commodities retain real value.
Gold, for instance, is historically seen as a store of value when fiat currencies weaken.
Energy and food are unavoidable necessities, so demand remains resilient even when money loses purchasing power.
This means in inflationary phases, commodity demand often rises not just for consumption, but for investment and speculation.
2. The Role of Interest Rates in Commodity Prices
Interest rates—set by central banks like the U.S. Federal Reserve, the RBI in India, or the ECB in Europe—act as the steering wheel of the economy. They determine the cost of borrowing, capital flows, and ultimately, investment appetite.
2.1 High Interest Rates and Commodities
When interest rates rise:
Borrowing becomes expensive, slowing down industrial production and construction.
This reduces demand for industrial commodities like steel, copper, and aluminum.
Investors shift money from risky assets (like commodities) into safe interest-bearing assets (like bonds).
Higher rates strengthen the local currency, which usually pushes commodity prices down (since most commodities are priced in USD).
Example: When the Fed raised interest rates aggressively in 2022, copper and aluminum prices dropped, reflecting weaker industrial demand.
2.2 Low Interest Rates and Commodities
When rates fall:
Borrowing is cheaper, stimulating economic activity.
Demand for commodities like oil, metals, and agricultural goods rises.
Investors seek returns in riskier assets, driving money into commodities and equities.
A weaker currency (due to low rates) often makes dollar-priced commodities cheaper for global buyers, increasing demand.
Example: After the 2008 global financial crisis, the Fed cut rates to near zero. Easy liquidity flooded into commodities, driving gold to record highs above $1,900 by 2011.
3. Inflation + Interest Rates: The Push-Pull Effect
Inflation and interest rates are not independent—they are two sides of the same coin. Central banks raise or lower interest rates mainly to control inflation.
High Inflation → Higher Interest Rates → Commodities pressured
Low Inflation → Lower Interest Rates → Commodities supported
But it’s not always linear. Some commodities, like gold, may rise both when inflation is high and when interest rates are high (if real interest rates are still negative).
4. Commodity-Specific Impacts
Let’s break down how inflation and interest rates affect major categories of commodities.
4.1 Energy (Oil, Natural Gas, Coal)
Inflationary effect: Energy is a primary driver of inflation since it impacts transport, electricity, and production costs. Rising oil prices often signal or cause inflation.
Interest rate effect: Higher rates can reduce oil demand as industries slow, but if inflation is too high, oil can still rise despite rate hikes (e.g., during 2022 Russia-Ukraine conflict).
4.2 Precious Metals (Gold, Silver, Platinum)
Inflationary effect: Gold and silver thrive when inflation is high, as investors use them as a hedge.
Interest rate effect: High interest rates typically hurt gold (since it doesn’t yield interest). However, if inflation exceeds rate levels (negative real interest rates), gold still shines.
4.3 Industrial Metals (Copper, Aluminum, Nickel)
Inflationary effect: Rising input and construction costs lift industrial metal prices.
Interest rate effect: Rate hikes slow housing, manufacturing, and infrastructure demand, weakening these metals.
4.4 Agricultural Commodities (Wheat, Corn, Soybeans, Sugar)
Inflationary effect: Food inflation hits hardest because it’s essential. Rising wages and population growth amplify the impact.
Interest rate effect: Higher rates increase farming credit costs and slow global trade, but food demand remains relatively inelastic.
5. Global Currency Connection
Most commodities are priced in U.S. dollars. That means:
When U.S. interest rates rise, the dollar strengthens, making commodities more expensive for buyers in other currencies → lower demand.
When rates fall, the dollar weakens, boosting demand globally → higher prices.
Thus, the USD Index and commodities often move inversely.
6. Historical Case Studies
6.1 1970s Stagflation
High oil prices + high inflation + weak growth.
Gold surged as an inflation hedge.
Central banks struggled to balance rates without worsening recession.
6.2 2008 Global Financial Crisis
Fed slashed rates → liquidity rush into commodities.
Gold, oil, and copper soared until demand collapsed during the recession.
6.3 2020 Pandemic & 2021–22 Inflation Surge
Initially, oil collapsed (negative prices in April 2020).
Massive stimulus + low rates → commodities roared back in 2021.
By 2022, inflation hit multi-decade highs → Fed hiked rates aggressively → commodity rally cooled except for energy (fueled by Ukraine war).
7. The Trader’s Perspective
For commodity traders and investors, understanding this cycle is critical:
Track inflation indicators (CPI, WPI, PPI).
Follow central bank policy (Fed, RBI, ECB).
Watch bond yields (real vs nominal).
Monitor USD Index (inverse relationship with commodities).
Example:
If inflation is rising but interest rates are low → bullish for commodities.
If inflation is peaking and central banks are hiking rates aggressively → bearish for commodities (except gold sometimes).
8. The Future: AI, Green Energy & Inflation Dynamics
Looking ahead:
Energy transition (from fossil fuels to renewables) will reshape how inflation flows into commodity markets. Lithium, cobalt, and rare earths may act like “new oil.”
AI-driven trading will make interest rate expectations even more quickly reflected in commodity prices.
Geopolitical conflicts will add to supply-driven inflation shocks, as seen in oil and wheat during Russia-Ukraine.
Conclusion
Inflation and interest rates are like the yin and yang of commodity pricing. Inflation fuels higher prices by raising demand for real assets, while interest rates act as the braking system, cooling overheated demand and strengthening currencies.
For traders, investors, and businesses, understanding this balance is essential. Commodities don’t just respond to supply and demand—they are deeply intertwined with monetary policy, global currency flows, and the psychology of inflation.
In simple terms:
Inflation pushes commodities up.
Interest rates can pull them down.
But the net effect depends on timing, central bank actions, and market sentiment.
Mastering this relationship is the key to anticipating commodity price trends in an ever-changing global economy.