Trade ideas


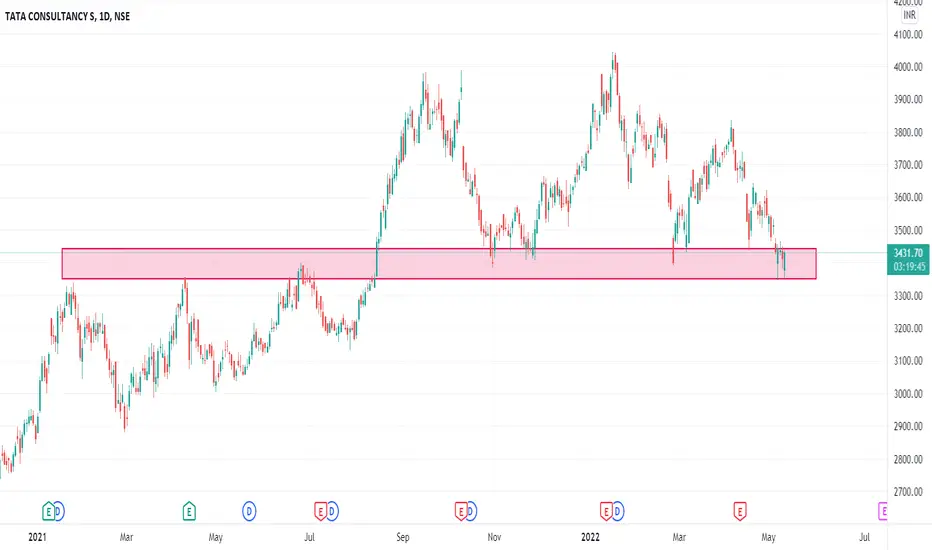
TCS IS AT MAJOR SUPPORT ZONEA long time resistance zone turned into a strong support. Awaiting for a bounce back. If the support zone is broken, a great fall is anticipated.

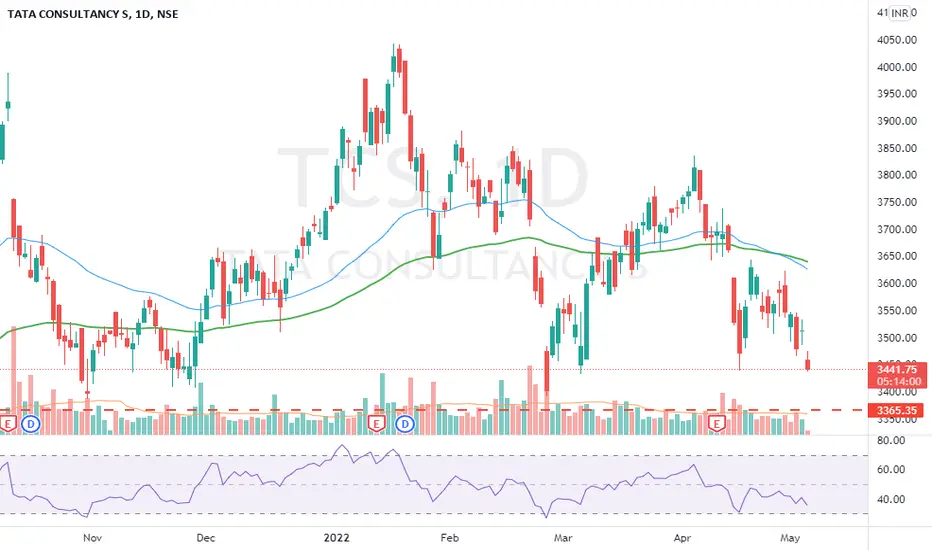
TCS AT DEMAND ZONE AGAIN !! TCS at the demand zone might bounce back from here. One can look for building small positions and add furthermore if the price at the demand zone performs well.


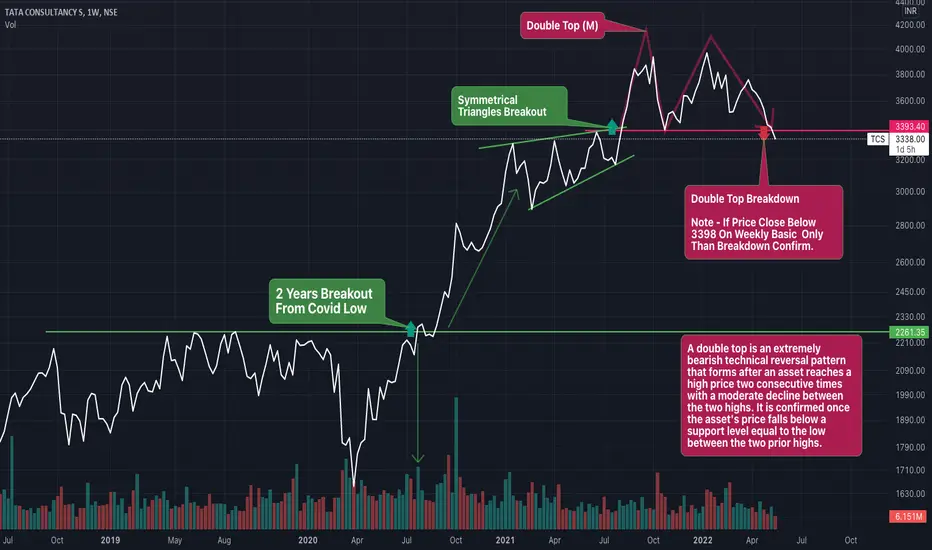
Double Top Pattern at TCSBe Cautious Double Top Pattern (trend reversal ) at #TCS weekly chart.
A double top is an extremely bearish technical reversal pattern that forms after an asset reaches a high price two consecutive times with a moderate decline between the two highs. It is confirmed once the asset's price falls below a support level equal to the low between the two prior highs.
NOTE- INVESTED #TCS
ONLY FOR #educational
NOT SEBI REGISTERED. #LEARNEARN (DONT TRUST ANYONE)
#nifty50 #sharemarket #BREAKOUTSTOCKS #Multibagger #sharemarket #sharemarketindia #sensex #technicalanalysis #kukiinvest #Chartanalysis #headandshoulders #doubletop #doublebottom

TCS is LONG......Looks like TCS is ready to reach 3600, after having strong support at 3400..
Good Risk/Reward ratio.. Mentioned in chart.

TCS building longTranch1 - 22 shares at 3435
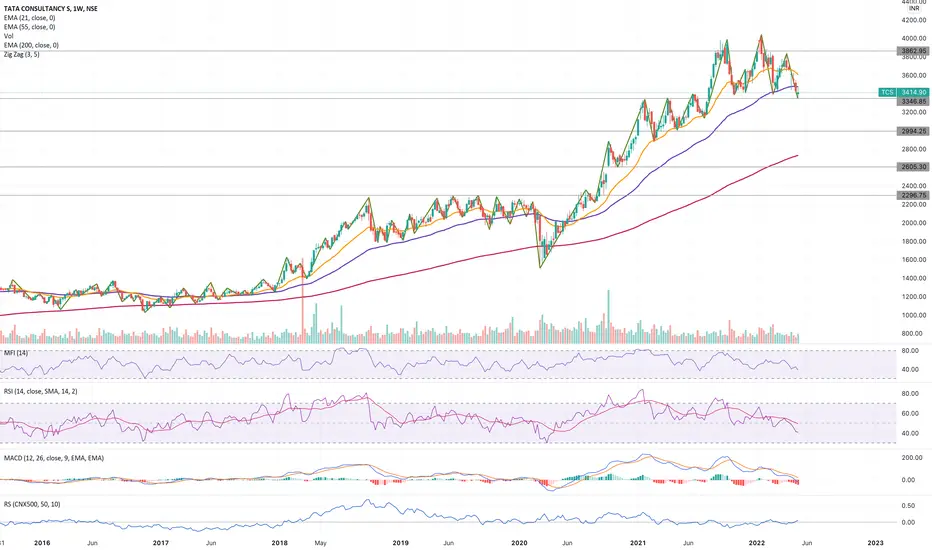
1. Market is in what stage - Identified by what kind of highs and lows that are being formed + movement of price w.r.t 21, 50 and 200 EMA
Price in range since Aug 2021, now started decline on 6 May i.e. broke previous support, will build at major supports
2. Is there any trend reversal in play?
1. Multiple divergence confirmations on MACD , RSI and MFI? No
2. At important support or resistance - horizontal - Yes - 3345
3. At important confluence of EMAs + price + support - Yes - Weekly 50
3. How are the candlesticks behaving and what is the volume doing
Candlesticks - consolidating
4. Is there any trend continuation in play?
Currently in consolidation, may drop more.. next big support 3000
5. Is there any pullback or breakout in play with volume confirmation from a strong horizontal level (support or resistance)
No
6. Fundamental factors in play
1. Revenue growth - EPS vs PE ratio - last 5 years comparison - EPS rising quarterly + Yearly... PE lowest in last 6 months - revenue and profit growth very strong
2. Are institutional investors/promotors increasing their stake - No major change, all constant
TCS HEAD AND SHOULDERNSE:TCS
Head and Shoulder Pattern formed in TCS,
CMP- 3400
Entry- 3400 or 3200
Target- 3400/3600/4000
stoploss- 3200

TCS idea for upcoming daysHere is the scenario in TCS stocks in upcoming days and now market is looking for correction here we can see a strong sell order block at the arrow

tcs on important supporttcs on important support
Please do watch
this is only for educational purpose not recommended for trade

TCSAbove is just for study purpose, Price near support with divergences as conviction with good volume and if follows by green candle then a good support for view

TCS MEGA SHORTING OPPORTUNITYTCS Is testing Medium Term support again in weekly chart'
One can short below support
Detail levels mentioned on chart .

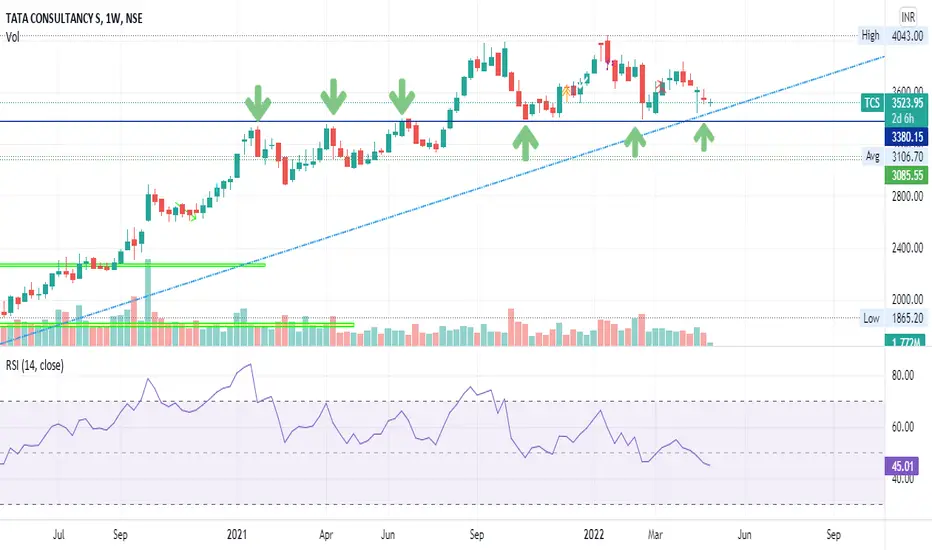
TCS Reached Major support level !!NSE:TCS
#TCS BO level shared in Aug 21 and it booked 20% profits. Now stock reached the same level 5th Time.
Seems to be weak below 3370.
Marked levels for practice.
Happy LEarning !!

TCS - IT giant looking weak to test major support zone3400 is major level for TCS and from the chart it looks that TCS is again going to test this level. It as broken its short term previous support around 3450 and now heading to 3400.
Levels are mentioned for entry & target.
Entry below 3430
Safe trader below 3425
Target 3400
Thanks
Piyush Gupta
Learn & Earn

TCSThis analysis for Short term positional purpose is based on Price Action and Support & Resistance
For Educational Purpose

TCS at Support LineTCS daily chart is at support line (Green) and forming a triangle pattern.
If it sustains at support level then it may go long.
Keep it in your watchlist.
Trade at your own risk. This is for educational purpose only. Happy Trading.

Double TopTCS if breaks down can easily lose 1000 points
Clean double top and pullback forming a lower swing low

Golden Rules Equity 1st What to BUY = Fundamentals (Business)
2nd When to BUY/SELL = Technicals (Price-Volume)
If Second gone wrong You can manage somehow , but if First thing goes wrong It will be a Blunder!
TCS - Intraday ShortShort term breakdown..short below 3460..
First target 3400.
Stoploss 3490.
If it falls below 3460 it could continue to melt downwards.

tcs weekly tcs weekly if breaks 3506 today then good to carry short positions, support is near 3380, its an important pivot level, from where trice its resistance level, and now acting as support level, expecting 3380-3390 as good support level