TCSThis analysis for Short term positional purpose is based on Price Action and Support & Resistance
For Educational Purpose
Trade ideas

TCS at Support LineTCS daily chart is at support line (Green) and forming a triangle pattern.
If it sustains at support level then it may go long.
Keep it in your watchlist.
Trade at your own risk. This is for educational purpose only. Happy Trading.

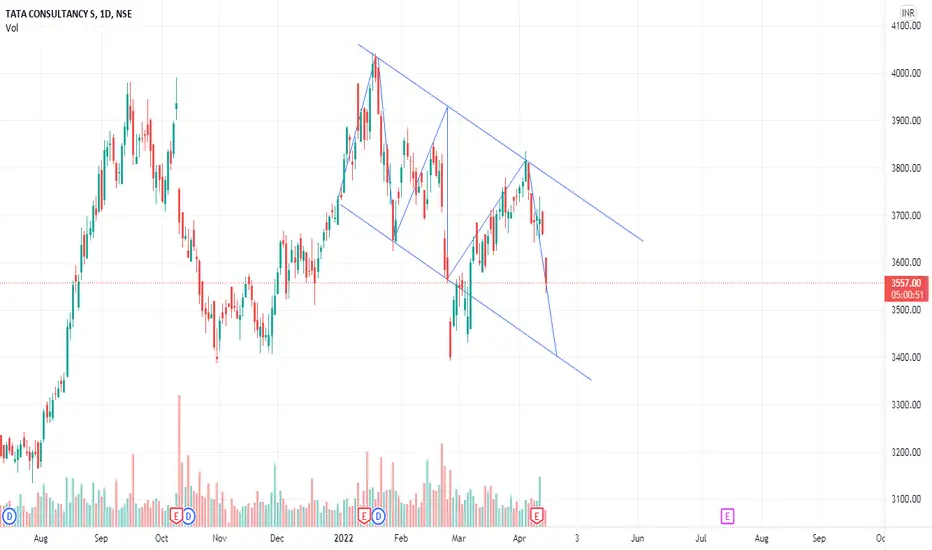
Double TopTCS if breaks down can easily lose 1000 points
Clean double top and pullback forming a lower swing low

Golden Rules Equity 1st What to BUY = Fundamentals (Business)
2nd When to BUY/SELL = Technicals (Price-Volume)
If Second gone wrong You can manage somehow , but if First thing goes wrong It will be a Blunder!
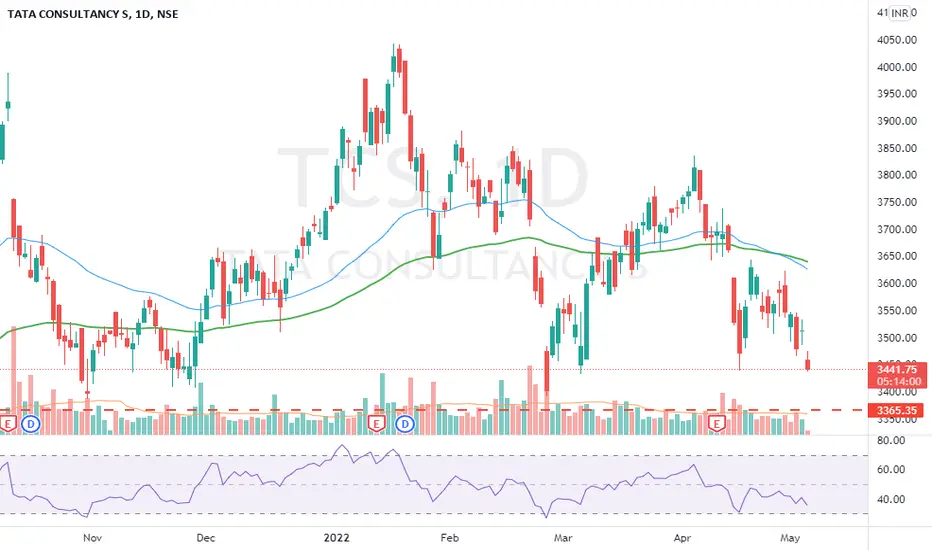
TCS - Intraday ShortShort term breakdown..short below 3460..
First target 3400.
Stoploss 3490.
If it falls below 3460 it could continue to melt downwards.

tcs weekly tcs weekly if breaks 3506 today then good to carry short positions, support is near 3380, its an important pivot level, from where trice its resistance level, and now acting as support level, expecting 3380-3390 as good support level
TCS - IT weaknessWith some good and some average results and the weakness in the Nasdaq the Nifty IT index is directly coorelated.
Short below 3535 with a stoploss at 3580 with a target of 3400.
This is first a short term trade. Below that if it further breaks down things could then get nasty for IT overall.

TCS - TRADEVIRLSPIVOT LEVELS
Resistance 1 : 3616
Resistance 2 : 3639
Resistance 3 : 3678
Support 1 : 3577
Support 2 : 3561
Support 3 : 3522

buy tcs tcs going up in coming 15 days chart time frame if some want to buy tcs. your target is 3647.3700.3800.3845.. now tcs traded on 3600.
..... you can hold one month chart time frame

TCS technical anylisysJust view
TCS made a dessending pattern in 15min timeframe
If tcs break 3570 level then its good for long
For the Targets 3595,3615++


TCS. Can have a bounce back from supportsStock is at support. It is finding difficult to sustain above 200 EMA. Can go to 3660 which is a resistance. Supports marked in green.


TCS Target 3400 sell sell sell for 3400 trgt...........
not a advise its an idea do own research before investing
Bearish Corrective Trend in TCS Hi Traders
This is an good opportunity for both buyers and sellers. As price is corrective than sellers can short sell here for quick profit. Investors can wait for the correction as they will get the buy the stocks as much cheaper price.
Anyway as i said in the chart this is an corrective structure. Form the looks like it is an flat structure so its should fall to given price range and expect a bounce from that area.
Anyway in present scnerio look for sell side as this correction is surely going to take some weeks to finish it. See weekly chart for more clear understanding of degree.
Please do follow our charts with likes and comments. Let me know if you have anymore query
Thank You Everyone
* This is an weekly chart of TCS, in this you will sell an line near price 3000 which will work as a support for wave of D-4, It should not breach this level if it want to go up for wave D-5
* To learn how to read our neowave charts see below image

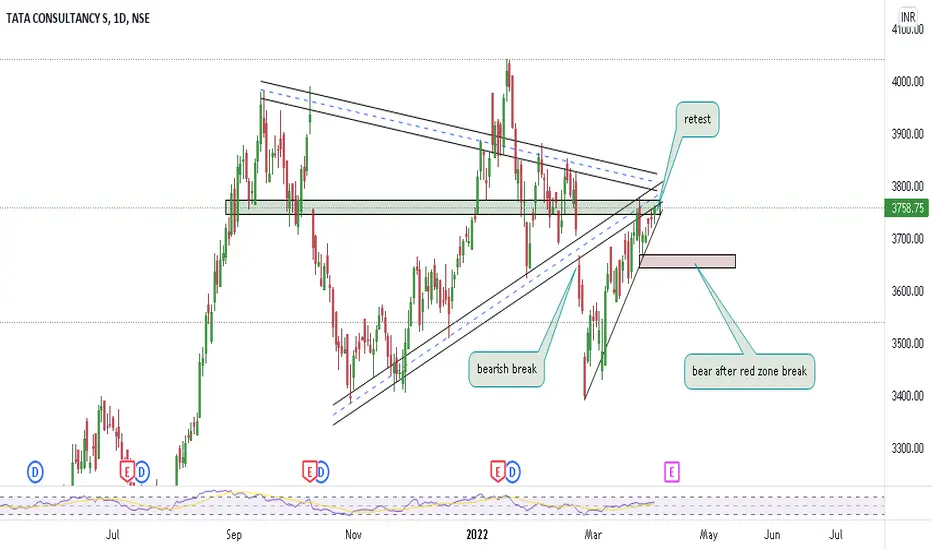
May lord have mercy and TCS touch the parallel trapTcs can enter the parallel trap.
Buy on the lower region and don't panic in the trap once it swings just book your profits.
------3580 - Wait -3484 - Buy - 3388-----------

Simple Trade Setup | TCS | 13-04-2022 [INTRADAY]NSE:TCS
Observations:
1) On 1day time frame, we can see 3645 is immediate major support level.
And 3680-3700 is no trade zone. Above this zone it will be bullish and below this it will be bearish till 3645.
Breakdown of 3645 will lead it to more bearish.
Please refer below chart : 1day time frame.
2) On 1hr time frame, it is forming head and shoulder pattern, which is a bearish pattern.
Neckline we can consider at 3645 level only.
If this pattern gets active then we can see fall only on 3645 level breakdown.
But sometimes, pattern fails.
Please refer below chart : 1hr time frame.
-------------------------------------
Trade Setup for 13-04-2022
1) Don't Jump in to trade at the beginning of the market. Let it get settle for 15-20min first and judge the price action.
2) Everything is mentioned on the chart. I hope it is easy to understand.
3) All the levels will work as support, resistance, entry and exit w.r.t price action near that level.
4) Avoid gap up or gap down chase. Wait and trade between levels.
Please refer below chart for levels.
This is only for Intraday.
Hope I made it easy to understand it.
Do comment your doubt or suggestion.
Note: Trade with Strict SL. It may or may not hit all the levels. So one can book profit / loss at respective level considering how price action works near that level.


TCS looking goodTCS has reversed from FIb .382 and is at strong support , expect a rally from here
No recommendation above view only for learning purpose

TCS Short small swingTCS can be shorted with the levels mentioned. Use trailing SL. RS and RSI negative, stock reversing from weekly pivot level.
Disclaimer: For educational purposes only. Trade at your own risk.

TCS - potential breakout above 3780Forming W pattern in daily time frame and price getting tight. Stock might breakout above 3780.

TCSNSE:TCS
please note that we are not a SEBI Registered Investor Adviser/PMS/ Broking House.
All the contents over here are for educational purposes only and are not investment advice or recommendations
offered to any person(s) with respect to the purchase or sale of the stocks / futures and options.
You are also requested to apply your prudence and consult your advisers in case you choose to act on
any such content available as WE claims no responsibilities for any of your actions or any outcome of
such action
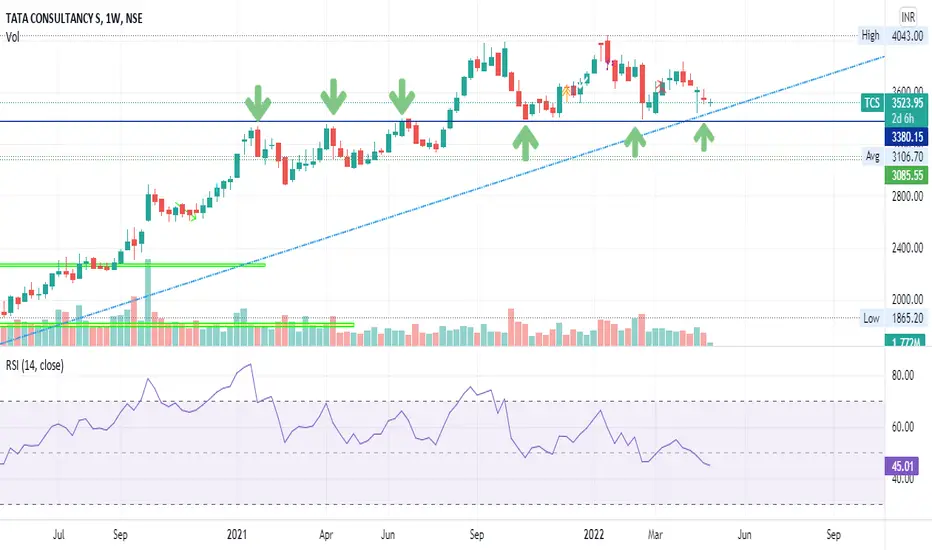
Double bottom formed in TCS.In weekly T/F double bottom has formed stock can seek new highs from here 4500-4800.One can keep Stop loss of 3300. NSE:TCS
