TCS - breakout resistance ?hi guys ,
as per chart we see tcs will be consolidate and ready for break its 4000 level resistance , and target gives 4500 or 4600 .
within 2 week it will happend if there is good global market .
buy - 3600
target - 4500
sl- 3300
Trade ideas

TCS under symmetrical triangleCHART -> TCS DAILY SETUP
Keep an eye on TCS as it is trading under a symmetrical triangle in daily timeframe, with upper trendline as resistance and lower trendline as support.
Disclaimer: This is for educational purpose only. This is not any recommendations. I am not SEBI registered. Please consult your financial advisor before taking any action.


#Tcs cash : Looks good around 3800#Tcs cash -Positional call
15 Feb 2022
Looks good around 3800
stoploss 3740
Target 3900/3980/4100
Cmp 3817.80

Inverted head and shoulders makes it long trade in TCSInverted head and shoulders makes it long trade in TCS

TCS Support ZonesCheckout How many times TCS has touched the support Zone and bounce back after nearing to the support area.
The Idea is for Educational Purpose only

TCSTCS
Disclaimer : This idea is only for education purpose, Pls consult your financial advisor
We are not Sebi registered.
Retweet and Like

TCS consolidating in tight rangeTCS consolidating in a tight range with a possible breakdown looming


TCS Rockets In Preparation For Liftoff To 4000+TCS is forming an ending diagonal in sub-wave 5 of wave((5)).
Price is about to complete the last move of the ending diagonal.
It has created sub-waves 'i' and 'ii' of wave 5.
The trader can initiate a long position for wave 'iii' after the breakout of wave 'i'.
Rule of invalidation : wave 'ii' can never overlap the starting point of wave 'i'. The best way to reduce risk is through t railing stops.
Acceleration of wave (5) can give the move up to 4080 .

TCS Pre-emptive Cup and Handle Target 4600• Historically, 7 out of 10 years TCS has closed positively in the months April to Aug, Avg Monthly returns in these months are >3%
• Highest gains in term of % (~24% in April’18 | ~12% in May’17 | ~14% June’14 | ~20% Jul’13 | ~20% Aug’21) has also come in the same time frame
• Recent announcement of buy back at 4500/shares can support the momentum
• Currently the stock is in formation of Cup and Handle patter on weekly chart, which expected to complete the pattern by March’22, after consolidation of ~7 months
• Upward momentum is expected to pick up post Q4FY21 and stock is expected to rally till 4600+ levels in Q1FY22 to Q2FY22
One can pre-empt the handle formation of the pattern and enter in to long trade at CMP or on dips till 3625, for the target of 4600+ in next six months.
If stock closes below 3600 on weekly basis, the view will get negated.
*************
Disclaimer :
-Please conduct your thorough research/analysis before doing the trade
-Idea shared is only for educational purpose
-Please trade on your own risk
************


TCS Short term Support and Resistance.TCS Short term Support and Resistance.
Mark the levels on chart and trade with them.

TCSThis is how tcs can react tomorrow, it's on its important zone if it breakes then we can expect a good move towards all time high, but we should wait and should see whether it consolidates at this level or what.

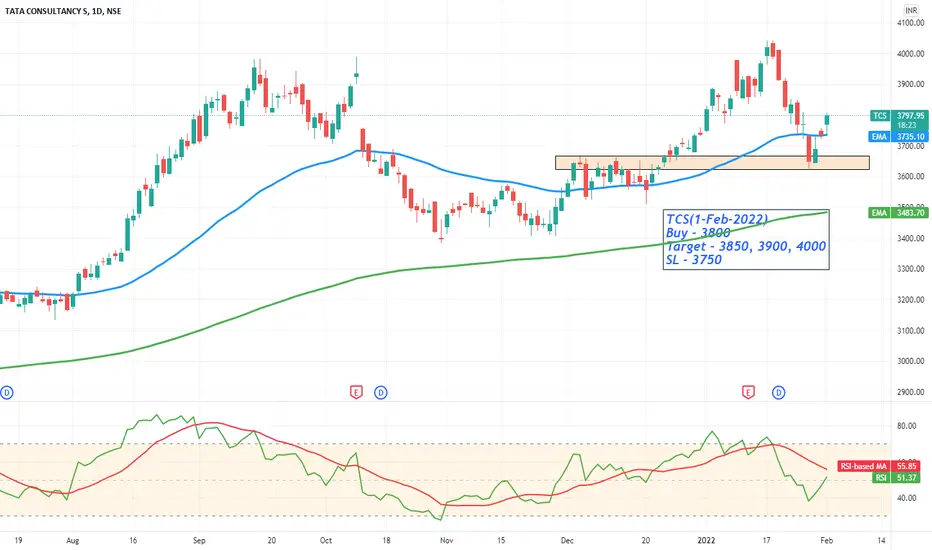
TCS SWING TRADE(1-FEB-2022)Swing Trade(1/Feb/2022)
TCS - Ready for an bullish move.
Price Action Analysis - TCS is taking major support at the same level for several times in daily candle and ready for breakout upside with confirmation form 200EMA.
TCS(1-Feb-2022)
Buy - 3800
Target - 3850, 3900, 4000
SL - 3750
The Finwiser 📈📊
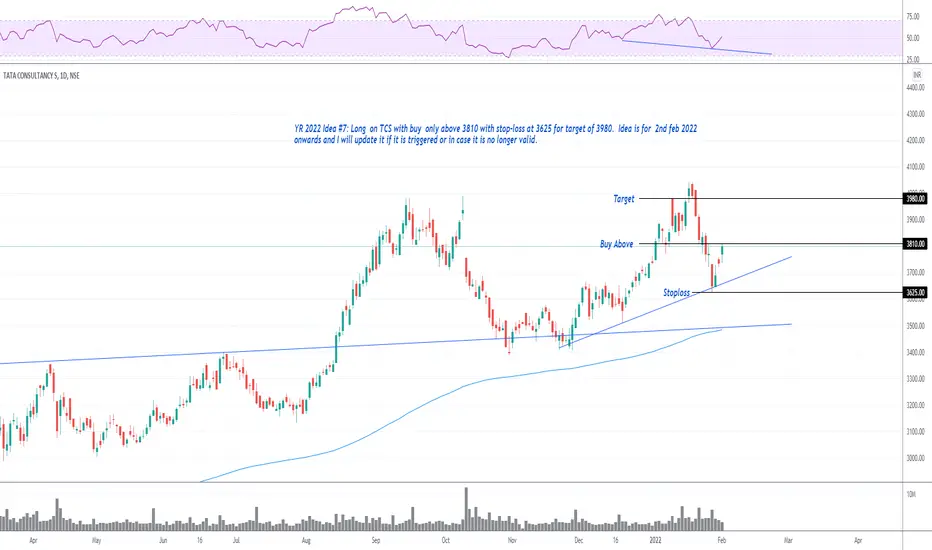
YR 2022 Idea #7: Long on TCS This is a public swing trade idea and is only for Learning and observational purpose. Please understand your risk and take full responsibility of your actions. We would comment on any further updates on our entry, targets and stop-loss on this idea, so make sure to follow if you want to get further updates. Our objective to help anyone who wants to learn technical analysis using charts. You can post your queries in comment section here and we will try to answer asap.
TCS GOING TO HIT AGAIN 4000 SOONOn the daily chart, the Share holds a major support level at 3750 with good volumes. If he holds it and momentum continues as per the chart then it going to test again at 4000 levels in the near future. Also, Rounding Curve is showing if he breaks level 3930 and holds it.
Short term target is 4000 from the current level
Long term target is 4200 in 6 months

Buy on dips strategy in TCSNSE:TCS
Leading global IT consultant TCS is available at an attractive valuation ahed of buyback. Opportunity for medium term buying. Trading exactly in middle of bollinger band. One can hold this gem for long term.


TCS IS NOW THE BEST FOR LONG1. Rsi is taking support on 40 levels
2. Price is also getting support on the levels
3. Can give fortune

TCS - S & RSupport and Resistance for TCS - Feb 2022 Expiry
TCS is in range bound for a long period and it is expected to continue in the same range if we don't expect any violent move due to upcoming budget.
Trade with cautious !!

TCS Double TOP on Weeklyit has formed double top on weekly chart at 4000.
3660 is daily retest was done.
3400 is best price to enter, if it touches this level due to volatility.
since 4400 is buyback price, logically price will touch this level. or it may consolidate between 3400 - 4000 levels

Long #TCS for TGT - 4200, Swing Trade- Reason - 150 DMALong #TCS for TGT - 4200, Swing Trade- Reason - 150 DMA
