[ INTRADAY ] TCS LONG BETrisk: Reward ratio is 1: 2
Rest as per Charts
********
Note -
One of the best forms of Price Action is to not try to predict at all. Instead of that, ACT on the price. So, this chart tells “where” to act in “what direction. Unless it triggers, like, let’s say the candle doesn’t break the level which says “Buy/Sell if it breaks”, You should not buy/sell at all.
=======
I use shorthands for my trades.
“Positional” - means You can carry these positions and I do not see sharp volatility ahead.
“Intraday” -means You must close this position at any cost by the end of the day.
=======
Always follow a stop loss.
In the case of Intraday trades, it is mostly the “Low/High of the Candle”.
In the case of Positional trades, it is mostly the previous swings
********
Trade ideas

TCSTCS made double top .
make entry with stop loss provided with target .
all detail are in graph .
Can buy Put of january and make entry and exit when target is hit.
thank you
happy trading


Target hit with 10% gains!! Link below for reference of my previous analysis.
Kindly do your analysis before initiating trade.

[ INTRADAY ] TCS LONG BET
risk: Reward ratio is 1: 2
Rest as per Charts
********
Note -
One of the best forms of Price Action is to not try to predict at all. Instead of that, ACT on the price. So, this chart tells “where” to act in “what direction. Unless it triggers, like, let’s say the candle doesn’t break the level which says “Buy/Sell if it breaks”, You should not buy/sell at all.
=======
I use shorthands for my trades.
“Positional” - means You can carry these positions and I do not see sharp volatility ahead.
“Intraday” -means You must close this position at any cost by the end of the day.
=======
Always follow a stop loss.
In the case of Intraday trades, it is mostly the “Low/High of the Candle”.
In the case of Positional trades, it is mostly the previous swings
********

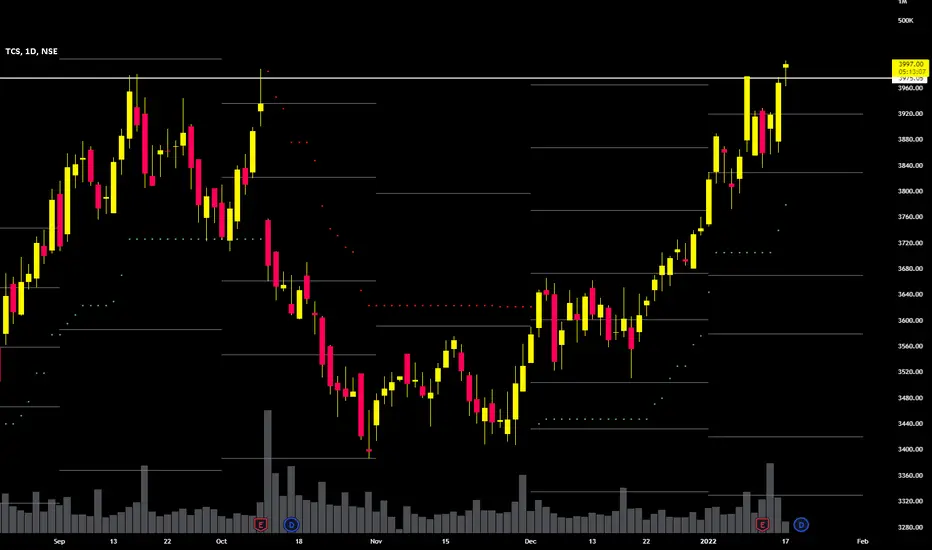
TCS looks Bullish as it gave breakout of all time highIt not just gave breakout but also sustaining over it which is a bullish sign.
TCS share price was Rs 3,985.00 as on 17 Jan, 2022, 10:07 AM IST. TCS share price was up by 0.42% based on previous share price of Rs. 3897.9. In last 1 Month, TCS share price moved up by 11.01%.
Top 4 Peers for TCS are Infosys Ltd., HCL Technologies Ltd., Wipro Ltd. and Tech Mahindra Ltd.
Key Metrics for TCS are:
PE Ratio of TCS is 39.10
Earning per share of TCS is 98.89
Price/Sales ratio of TCS is 7.16
Price to Book ratio of TCS is 16.85
TCS BREAKOUT SOON!!- Major resistance near 3980-4000
- Trading in a bullish channel
- Strong bullish trend
- Buy above 4000 (Hourly Close)
- SL: 3835
- Target: 4200/4400/4600+
- TF: 3-4 Months

TCSGo long above 3990 DCB
Rounding bottom pattern of 550 points forming
Can draw targets according to that
Support 3770-3800

TCS#TCS
CMP - 3968
Above 3990 - 4000
Next Levels to be expect -> 4266,4579
View will be negated below 3764
Disclaimer : This idea is only for education purpose, Pls consult your financial advisor
We are not Sebi registered.
Retweet and Like


TCS - Trading at Previous high, potential targetPrice trading near the previous high, as discussed CNXIT is about to break the previous high these IT stocks should be the potential targets for the traders.
One can wait for the breakout from the previous high or get it on when there is a retest of the breakout level !!!

TCSPrice is near the resistance zone. Will it break the resistance or fall down? Price action will give the reply in few days. Taking fresh longs is risky at this point.


Rounding bottom formation on TCSKey Notes on TCS-
- Rounding bottom formation on Daily candle
- RSI Bullish Trend
- Positive Results


TCS at Demand zone sure callTCS at demand Zone: 3333.80 to 3473.70
buy at : 3473.70 near price
target 1: 3705.80
target 2: 3994.80
target 3: 4358.10 ( expected jan 2022) 25.4% return and annual return expected: 101.83%
stop loss :3138 (9.66%)
risk reward ratio: 1:2.5

TCS INTRADAY ANALYSISAs we see the symmetrical triangle formation in the TCS. we can enter either side after breaking NO TRADING ZONE.targets are mentioned in the chart itself

TCSTCS is respecting this trend line and this is the fourth day it close above its trendline . If tomorrow 1 green candle form above the trend line it will be a good conformation for a long position.

TCS BULLISH BREAKOUT - positional TCS after recent correction again heading to bullish after breakout seen in daily chart. bullish confirmation candle seen clearly on chart .
As Prime bet from IT Sector TCS can outperform even in falling market .
BUY TCS @3640
TARGET 3850-3900 (1 month )
Stop Loss 3450
This analysis purely base on technical indicators please make own study and take final call.
Wish u Happy Trading !!

TCS Buy-back & how I got it rightTCS BUY BACK & HOW I GOT IT RIGHT
BACKGROUND
TCS declared its Q3 results last evening and it was expected to announce a share buy-back proposal. This news was available ahead of the results and therefore, I decided to work out what could be the likely buy-back price that it may offer.
Based on my observations, TCS has a tendency to cross the buy-back price and then retrace either below or around the buy-back price just when the buy-back approaches. The logic is that the scrip is unlikely to trade above the buy-back price and is more likely to fall for some time.
INTENT
I have holdings in the scrip so I was eager to test my logic of arriving at the likely buy-back price.
In the past. I have traded TCS pre and post-buy-back with the intention to make trading gains so I may enter a trade as & when I find a good risk-reward opportunity.
So my intent was to know the likely range that it may offer should I decide to buy TCS.
WORKING
In my view, a company that opts for buy-back of shares is either trying to compensate the shareholders from the available surplus or it may be willing to consolidate its own position as it expects improved performance in the coming periods. It could also be for both the reasons. In reality, I am not affected by their reason as long as the price offered is at a better premium than the ruling price. This will motivate me to stay put with my holdings and or induce me to initiate a new trade.
My work to arrive at the price was done a day ahead of the announcement and for those who may be quick to think that what is the point in writing the article post-facto, I have pasted a link to the video where I have stated the price range that may be used for arriving at the buy-back price.
On 11-1-21, TCS closed above 3900 so I kept 3900 as the base and did the following:
Case 1
The offer price could be at a premium of 10% to the ruling price.
So, 3900*1.10 = 4290 so I rounded-off to 4300.
Case 2
The offer price could be at a premium of 15% to the ruling price.
So, 3900*1.15 = 4485 so I rounded-off to 4500.
The reason for 10% is that it is a good enough incentive to the shareholders to tender the shares and is more than the returns that a debt instrument would give.
The reason for 15% is that the company may want to top up the premium with a hidden component of dividend which is otherwise taxable.
My conclusion was that TCS may offer the buy-back within this range with 4500 being the cap as I felt anything more would mean that the company may be doing social service than rewarding its shareholders.
My reading was that the shares would in any case not cross 4000 immediately as TCS has the tendency to go sideways to negative post results and as the time elapses from the result release, it goes down if the sentiment is not positive.
CONCLUSION
Since I have some holdings in TCS, I am happy that a part of that would be tendered at the final price that the company may announce .
I now have a range of 600 points from 3900 to 4500 which is available for me to decide about trading the scrip subject to the right set-up and more importantly funds availability.
I am now encouraged to test the approach for such announcements that the other companies may make.
Here is the link to the video:
youtu.be
I would be happy to read your feedback.
Thank you,
Umesh
13-1-22
Not SEBI Regd.
Shared for the purposes of Educational & Informational purposes only.


Tcs Tcs
2 target
Up 4070
Down 3640
My view mostly relavany up move to only use. This idea target 4070
Today also Q3 response

