Inflation & Interest Rates Shape Commodity PricesIntroduction
Commodities are the building blocks of the global economy. Crude oil fuels industries and transport, metals like copper and aluminum are vital for infrastructure and technology, while agricultural products like wheat, corn, and soybeans feed billions of people. But what truly drives their prices beyond just supply and demand?
Two of the most powerful forces are inflation and interest rates. These economic levers not only dictate consumer purchasing power and business costs, but also ripple through investment flows, currency valuations, and ultimately, the price of commodities across the globe.
In this discussion, we’ll dive deep into how inflation and interest rates shape commodity markets, exploring both theory and real-world cases, while keeping the explanation practical and easy to follow for traders, investors, and learners.
1. The Link Between Commodities and Inflation
1.1 Why Commodities Reflect Inflation
Commodities are often called the “canary in the coal mine” for inflation. That’s because:
When prices of raw materials like oil, metals, and food rise, the cost of finished goods increases.
Rising commodity prices feed into Consumer Price Index (CPI) and Wholesale Price Index (WPI).
This makes commodities not just a victim of inflation but also a driver of inflation.
For example:
If crude oil rises from $60 to $90 per barrel, fuel prices climb, logistics costs rise, and nearly every product (from groceries to electronics) becomes more expensive.
If wheat and corn prices jump, bread, meat, and packaged foods see higher retail prices.
Thus, inflation and commodities have a feedback loop.
1.2 Commodities as an Inflation Hedge
Investors often rush into commodities during inflationary times. Why?
Unlike paper currency, which loses value when inflation is high, commodities retain real value.
Gold, for instance, is historically seen as a store of value when fiat currencies weaken.
Energy and food are unavoidable necessities, so demand remains resilient even when money loses purchasing power.
This means in inflationary phases, commodity demand often rises not just for consumption, but for investment and speculation.
2. The Role of Interest Rates in Commodity Prices
Interest rates—set by central banks like the U.S. Federal Reserve, the RBI in India, or the ECB in Europe—act as the steering wheel of the economy. They determine the cost of borrowing, capital flows, and ultimately, investment appetite.
2.1 High Interest Rates and Commodities
When interest rates rise:
Borrowing becomes expensive, slowing down industrial production and construction.
This reduces demand for industrial commodities like steel, copper, and aluminum.
Investors shift money from risky assets (like commodities) into safe interest-bearing assets (like bonds).
Higher rates strengthen the local currency, which usually pushes commodity prices down (since most commodities are priced in USD).
Example: When the Fed raised interest rates aggressively in 2022, copper and aluminum prices dropped, reflecting weaker industrial demand.
2.2 Low Interest Rates and Commodities
When rates fall:
Borrowing is cheaper, stimulating economic activity.
Demand for commodities like oil, metals, and agricultural goods rises.
Investors seek returns in riskier assets, driving money into commodities and equities.
A weaker currency (due to low rates) often makes dollar-priced commodities cheaper for global buyers, increasing demand.
Example: After the 2008 global financial crisis, the Fed cut rates to near zero. Easy liquidity flooded into commodities, driving gold to record highs above $1,900 by 2011.
3. Inflation + Interest Rates: The Push-Pull Effect
Inflation and interest rates are not independent—they are two sides of the same coin. Central banks raise or lower interest rates mainly to control inflation.
High Inflation → Higher Interest Rates → Commodities pressured
Low Inflation → Lower Interest Rates → Commodities supported
But it’s not always linear. Some commodities, like gold, may rise both when inflation is high and when interest rates are high (if real interest rates are still negative).
4. Commodity-Specific Impacts
Let’s break down how inflation and interest rates affect major categories of commodities.
4.1 Energy (Oil, Natural Gas, Coal)
Inflationary effect: Energy is a primary driver of inflation since it impacts transport, electricity, and production costs. Rising oil prices often signal or cause inflation.
Interest rate effect: Higher rates can reduce oil demand as industries slow, but if inflation is too high, oil can still rise despite rate hikes (e.g., during 2022 Russia-Ukraine conflict).
4.2 Precious Metals (Gold, Silver, Platinum)
Inflationary effect: Gold and silver thrive when inflation is high, as investors use them as a hedge.
Interest rate effect: High interest rates typically hurt gold (since it doesn’t yield interest). However, if inflation exceeds rate levels (negative real interest rates), gold still shines.
4.3 Industrial Metals (Copper, Aluminum, Nickel)
Inflationary effect: Rising input and construction costs lift industrial metal prices.
Interest rate effect: Rate hikes slow housing, manufacturing, and infrastructure demand, weakening these metals.
4.4 Agricultural Commodities (Wheat, Corn, Soybeans, Sugar)
Inflationary effect: Food inflation hits hardest because it’s essential. Rising wages and population growth amplify the impact.
Interest rate effect: Higher rates increase farming credit costs and slow global trade, but food demand remains relatively inelastic.
5. Global Currency Connection
Most commodities are priced in U.S. dollars. That means:
When U.S. interest rates rise, the dollar strengthens, making commodities more expensive for buyers in other currencies → lower demand.
When rates fall, the dollar weakens, boosting demand globally → higher prices.
Thus, the USD Index and commodities often move inversely.
6. Historical Case Studies
6.1 1970s Stagflation
High oil prices + high inflation + weak growth.
Gold surged as an inflation hedge.
Central banks struggled to balance rates without worsening recession.
6.2 2008 Global Financial Crisis
Fed slashed rates → liquidity rush into commodities.
Gold, oil, and copper soared until demand collapsed during the recession.
6.3 2020 Pandemic & 2021–22 Inflation Surge
Initially, oil collapsed (negative prices in April 2020).
Massive stimulus + low rates → commodities roared back in 2021.
By 2022, inflation hit multi-decade highs → Fed hiked rates aggressively → commodity rally cooled except for energy (fueled by Ukraine war).
7. The Trader’s Perspective
For commodity traders and investors, understanding this cycle is critical:
Track inflation indicators (CPI, WPI, PPI).
Follow central bank policy (Fed, RBI, ECB).
Watch bond yields (real vs nominal).
Monitor USD Index (inverse relationship with commodities).
Example:
If inflation is rising but interest rates are low → bullish for commodities.
If inflation is peaking and central banks are hiking rates aggressively → bearish for commodities (except gold sometimes).
8. The Future: AI, Green Energy & Inflation Dynamics
Looking ahead:
Energy transition (from fossil fuels to renewables) will reshape how inflation flows into commodity markets. Lithium, cobalt, and rare earths may act like “new oil.”
AI-driven trading will make interest rate expectations even more quickly reflected in commodity prices.
Geopolitical conflicts will add to supply-driven inflation shocks, as seen in oil and wheat during Russia-Ukraine.
Conclusion
Inflation and interest rates are like the yin and yang of commodity pricing. Inflation fuels higher prices by raising demand for real assets, while interest rates act as the braking system, cooling overheated demand and strengthening currencies.
For traders, investors, and businesses, understanding this balance is essential. Commodities don’t just respond to supply and demand—they are deeply intertwined with monetary policy, global currency flows, and the psychology of inflation.
In simple terms:
Inflation pushes commodities up.
Interest rates can pull them down.
But the net effect depends on timing, central bank actions, and market sentiment.
Mastering this relationship is the key to anticipating commodity price trends in an ever-changing global economy.
Trade ideas
PCR Trading StrategyMoneyness of Options
Moneyness shows whether the option has intrinsic value:
In the Money (ITM): Already profitable if exercised.
At the Money (ATM): Strike price = market price.
Out of the Money (OTM): No intrinsic value, only time value.
Factors Affecting Option Prices (Option Greeks)
Options are influenced by multiple factors:
Delta: Sensitivity to underlying price changes.
Gamma: Sensitivity of Delta.
Theta: Time decay – options lose value as expiry nears.
Vega: Sensitivity to volatility.
Rho: Sensitivity to interest rates.
Payoff Profiles
Buyer of Call/Put: Limited loss (premium), unlimited profit.
Seller of Call/Put: Limited profit (premium), unlimited or large risk.

Part 1 Master Candle PatternIntroduction to Options Trading
Options trading has become one of the fastest-growing segments of the Indian financial market. Once considered a playground only for institutions and advanced traders, options are now widely accessible to retail investors thanks to online trading platforms, mobile apps, and reduced brokerage costs.
In India, the NSE (National Stock Exchange) is the world’s largest derivatives exchange in terms of contracts traded, with Bank Nifty and Nifty 50 options leading the charge. For retail traders, options present opportunities for hedging, speculation, and income generation, making them versatile instruments.
But options are also complex. Unlike stocks, where you directly own a piece of a company, options are derivative contracts—their value depends on the price of an underlying asset. This makes them both powerful and risky if not understood properly.
What are Options?
An option is a financial contract that gives the buyer the right, but not the obligation, to buy or sell an underlying asset at a predetermined price (strike price) before or on a specific date (expiry).
Call Option → Right to buy an asset at a strike price.
Put Option → Right to sell an asset at a strike price.
Unlike futures contracts, option buyers are not obligated to execute the trade. They can choose to let the option expire worthless if the trade doesn’t go their way.

Part 3 Trading Master Class With Experts Non-Directional Strategies
Used when you expect low or high volatility but no clear trend.
Straddle
When to Use: Expecting big move either way.
Setup: Buy call + Buy put (same strike, same expiry).
Risk: High premium cost.
Reward: Large if price moves sharply.
Strangle
When to Use: Expect big move but want lower cost.
Setup: Buy OTM call + Buy OTM put.
Risk: Lower premium but needs bigger move to profit.
Iron Condor
When to Use: Expect sideways movement.
Setup: Sell OTM call + Buy higher OTM call, Sell OTM put + Buy lower OTM put.
Risk: Limited.
Reward: Premium income.
Butterfly Spread
When to Use: Expect price to stay near a target.
Setup: Combination of long and short calls/puts to profit from low volatility.

PCR Trading StrategyNon-Directional Strategies
Used when you expect low or high volatility but no clear trend.
Straddle
When to Use: Expecting big move either way.
Setup: Buy call + Buy put (same strike, same expiry).
Risk: High premium cost.
Reward: Large if price moves sharply.
Strangle
When to Use: Expect big move but want lower cost.
Setup: Buy OTM call + Buy OTM put.
Risk: Lower premium but needs bigger move to profit.
Iron Condor
When to Use: Expect sideways movement.
Setup: Sell OTM call + Buy higher OTM call, Sell OTM put + Buy lower OTM put.
Risk: Limited.
Reward: Premium income.
Butterfly Spread
When to Use: Expect price to stay near a target.
Setup: Combination of long and short calls/puts to profit from low volatility.

Basics of Volume AnalysisIntroduction
Volume is one of the most crucial yet underrated elements in trading and technical analysis. While most traders focus on price alone, professionals know that volume provides the fuel behind price movements. It answers the “how much” behind the “how far.” In simple words, volume tells us the strength or weakness of a move.
Without volume, price movement can be misleading because a rally or sell-off without sufficient participation may not sustain. Hence, understanding and analyzing volume correctly can help traders distinguish between real moves and false signals.
This comprehensive guide explains the basics of volume analysis, its role in trading, the theories behind it, and how traders can practically use it to improve decision-making.
Chapter 1: What is Volume in Trading?
Volume refers to the total number of shares, contracts, or lots traded in a particular asset within a specified time frame (such as 1 minute, 5 minutes, daily, or weekly).
For example:
If 10,000 shares of Reliance Industries are traded in one day, then the daily volume of Reliance is 10,000 shares.
In futures and options, volume refers to the number of contracts bought and sold.
In forex trading, volume is usually represented as the number of ticks (price changes) in a given time.
Key Points About Volume:
Volume measures activity and participation in the market.
High volume means greater interest and liquidity.
Low volume means lack of participation and higher risk of false moves.
Volume is relative — 100,000 shares traded in a small-cap stock may be considered high, but the same volume in a large-cap stock may be low.
Chapter 2: Importance of Volume in Trading
Why should traders pay attention to volume? Because price without volume is like a car without fuel.
1. Confirmation of Trend
Rising prices with rising volume = strong uptrend.
Falling prices with rising volume = strong downtrend.
Rising prices with falling volume = weak uptrend (may reverse).
Falling prices with falling volume = weak downtrend (may reverse).
2. Identifying Reversals
Volume often spikes at major reversal points, as large traders and institutions enter or exit.
3. Recognizing Breakouts and Breakdowns
Breakout above resistance with strong volume = reliable.
Breakout above resistance with weak volume = false breakout risk.
4. Detecting Accumulation and Distribution
High volume near support levels suggests accumulation by smart money.
High volume near resistance suggests distribution (selling).
5. Liquidity & Execution
High-volume assets are easier to trade with minimal slippage.
Chapter 3: Theories Behind Volume Analysis
Several technical analysis theories stress the role of volume:
1. Dow Theory and Volume
Charles Dow, father of modern technical analysis, said volume must confirm the trend.
In an uptrend, volume should increase as prices rise and decrease on pullbacks.
In a downtrend, volume should increase as prices fall and decrease on rallies.
2. Volume Precedes Price
Many times, volume surges before price makes a significant move. Institutions build positions quietly, and this hidden activity shows up in volume before the price breakout.
3. Effort vs. Result Principle (Wyckoff Theory)
Effort = volume
Result = price movement
If effort (volume) is high but result (price move) is small, it indicates hidden resistance or absorption.
Chapter 4: Types of Volume Analysis
1. Simple Volume Analysis
Looking at volume bars below a candlestick chart to see if it confirms price movement.
2. Relative Volume
Comparing today’s volume with average historical volume.
Example: If a stock’s average daily volume is 1 million shares, but today it trades 5 million, something important is happening.
3. Volume Oscillators and Indicators
Many indicators are built on volume, such as:
On-Balance Volume (OBV)
Volume Weighted Average Price (VWAP)
Accumulation/Distribution Line
Chaikin Money Flow
Volume Price Trend (VPT)
Chapter 5: Practical Techniques of Volume Analysis
1. Volume with Support and Resistance
A breakout above resistance with high volume = trend continuation.
A breakout with low volume = false signal.
2. Volume Spikes
Sudden large increases in volume usually precede strong price moves or mark exhaustion at tops/bottoms.
3. Volume Divergence
If price makes new highs but volume decreases, the trend is weakening.
4. Volume in Consolidation
Low volume during sideways movement = healthy consolidation.
Rising volume in sideways = accumulation or distribution.
5. Volume & Candlestick Patterns
Bullish engulfing with high volume = strong reversal.
Doji with high volume = uncertainty and potential turning point.
Chapter 6: Popular Volume Indicators
1. On-Balance Volume (OBV)
OBV adds volume on up days and subtracts on down days. It helps identify accumulation or distribution trends.
2. Volume Weighted Average Price (VWAP)
VWAP shows the average price at which a stock has traded throughout the day, weighted by volume. Used by institutions for fair value.
3. Accumulation/Distribution Line
Measures how much of a stock’s volume is flowing in or out.
4. Chaikin Money Flow (CMF)
Shows buying and selling pressure over a period based on volume and closing price.
5. Volume Price Trend (VPT)
Combines percentage price change with volume to confirm strength of trends.
Chapter 7: Volume in Different Timeframes
1. Intraday Trading
Intraday traders use volume spikes to enter momentum trades.
VWAP is critical for institutional intraday positions.
2. Swing Trading
Swing traders watch volume on breakout of ranges.
They avoid low-volume stocks as moves may not sustain.
3. Long-Term Investing
Investors analyze accumulation phases with high volume at bottoms.
Volume helps identify institutional entry points.
Chapter 8: Case Studies
Example 1: Breakout Confirmation
Suppose Infosys stock has been consolidating between ₹1,400–₹1,450 for months. One day, it breaks above ₹1,450 with 3x average volume. This confirms buyers’ strength, and price is likely to sustain upward.
Example 2: False Breakout
Another stock breaks above resistance but on very low volume. Price quickly falls back. Here, volume warned traders of a trap.
Example 3: Market Tops
At market peaks, price may still rise, but volume gradually declines. This divergence signals weakening demand.
Chapter 9: Limitations of Volume Analysis
Different Markets Measure Volume Differently: Forex uses tick volume, not actual trade volume.
False Signals: High volume can also occur due to news or rumors, leading to traps.
Not Standalone: Should be combined with price action, trend analysis, and indicators.
Institutional Tricks: Smart money sometimes creates artificial volume to mislead retail traders.
Chapter 10: Best Practices for Traders
Always compare volume with price action, not alone.
Use relative volume (compare with historical averages).
Combine with technical tools like candlestick patterns, moving averages, or VWAP.
Avoid illiquid stocks with low volume.
Watch for volume divergences — they often precede reversals.
For intraday, focus on the first 30 minutes and last 30 minutes when volume is highest.
Conclusion
Volume analysis is like the heartbeat of the market. It reveals the hidden intentions of big players, confirms the strength of moves, and warns against false signals. By mastering volume, traders can improve their accuracy in identifying trends, reversals, breakouts, and consolidations.
While volume is not perfect and should not be used in isolation, it is one of the most powerful tools when combined with price action and other indicators. From Dow Theory to modern-day VWAP strategies, volume continues to be a central pillar of trading success.
For beginners, the journey starts with simply observing volume bars on price charts and gradually moving to advanced concepts like OBV, VWAP, and Wyckoff’s effort vs. result principle. Over time, volume analysis becomes second nature, helping traders see beyond the surface of price and into the market’s underlying strength.
Option TradingHow Options Work in Trading
Imagine a stock is trading at ₹1,000.
You believe it will rise to ₹1,100 in a month. You could:
Buy the stock: You need ₹1,000 per share.
Buy a call option: You pay a small premium (say ₹50) for the right to buy at ₹1,000 later.
If the stock rises to ₹1,100:
Stock profit = ₹100
Call option profit = ₹100 (intrinsic value) - ₹50 (premium) = ₹50 net profit (but with much lower capital).
This leverage makes options attractive but also risky — if the stock doesn’t rise, your premium is lost.
Categories of Options Strategies
Options strategies can be divided into three main categories:
Directional Strategies – Profit from price movements.
Non-Directional (Neutral) Strategies – Profit from sideways markets.
Hedging Strategies – Protect existing positions.
Directional Strategies
These are for traders with a clear market view.

TCS Movement 12.8.25TCS Try To Maintain Is Track Or Path After Many Weeks This Is Good Sign of Strength
macd Looks Bullish And Divergence Is Also Looks Positive and Strong

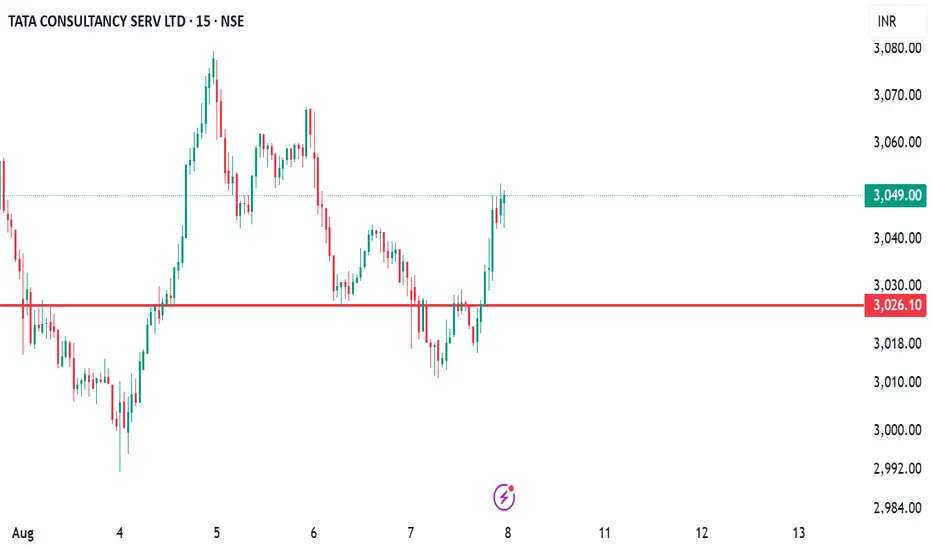
TCS Oversold — Eyeing a Short-Term ReboundTata Consultancy Services (TCS) is approaching oversold territory on the daily chart with RSI near 30, signaling potential for a short-term bounce. Price action is testing support, and risk is well-defined with a 1:1+ risk-reward setup. While the broader IT sector remains under watch, this setup offers an attractive opportunity for swing or short-term traders.
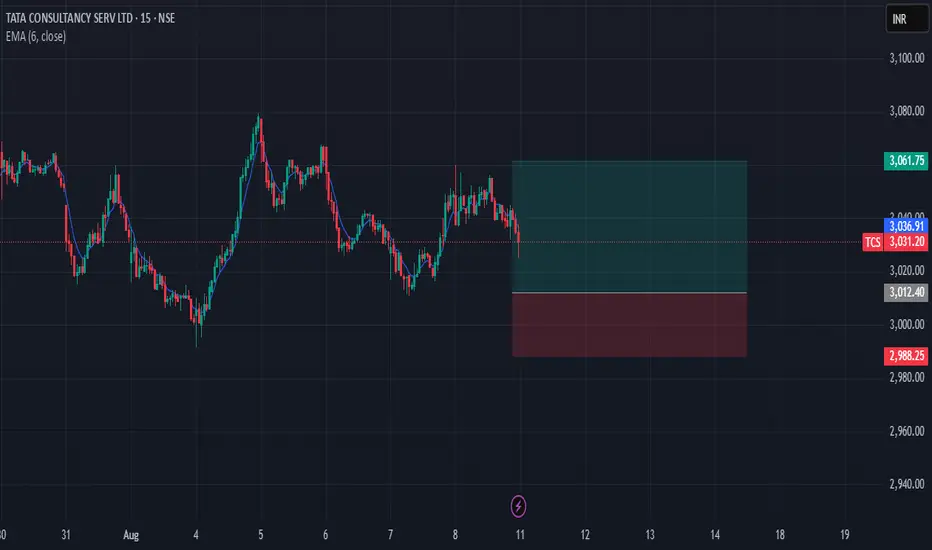
TCS - BuyExpecting a short pullback after a deep correction in IT stocks
TCS Buy at 3048 Stoploss 3005 Target 3140

TCS Buy ViewTCS is showing strength with positive price action and strong support at lower levels. A bullish trend is expected to continue in the coming sessions. From the current market price (CMP), we anticipate a 6–7% upside potential.
📈 Trend: Bullish
🎯 Target: 6% to 7% from CMP
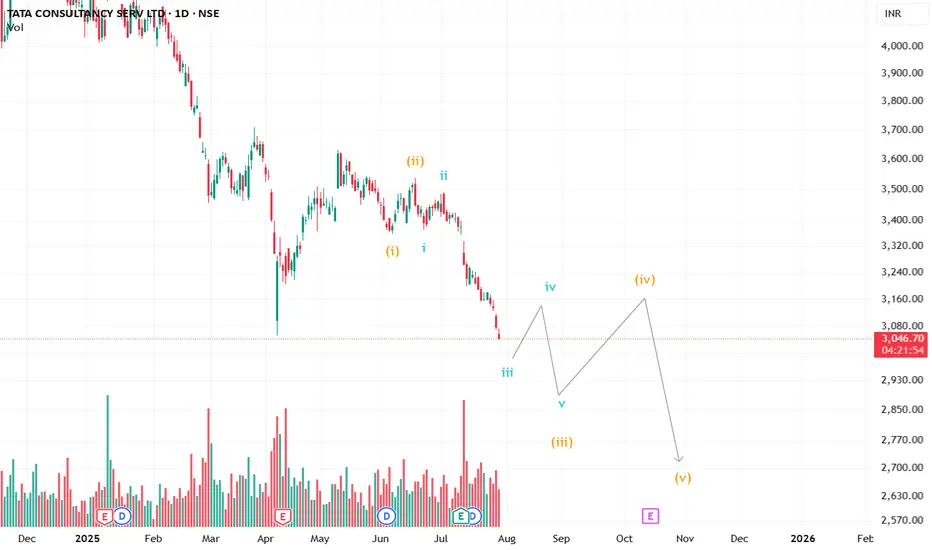
TCS appears to be in bad shapeLooking at the current structure, relief is not expected for some time. We may see some wild moves on the downside to complete the corrective phase before TCS sees another day of glory.
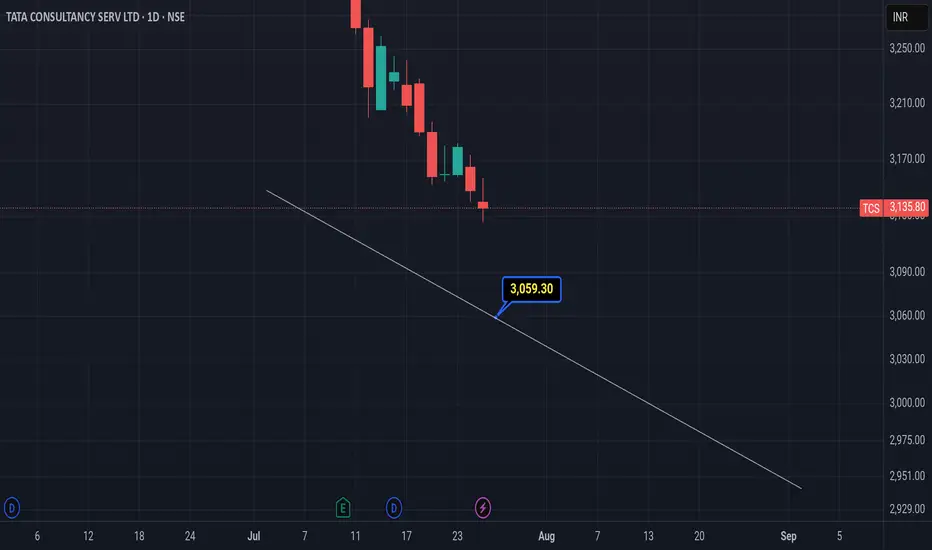
TCSThere's a Imp Gap pending at 3059 level, so chances are high it could possibly test that support level or to the white line.
Disclaimer :
It's a personal view not a financial advice and I assume no responsibility and liability whatever outcome arises.
A rally from here likelyTCS CMP 3098
Geometry - the green lines on the left chart are lines using current market geometry. The stock is trading below it right now, but in my view it will recover. It will be a buy on a weekly close above this line.
Elliott - this downfall is the b wave of X. The c wave of X will take it to 3420 and 3670. That is where we have the iv wave. The natural place where correction end.
Fibs - the fibs are indicating 3520 and 3670 as a place of resistance.
Conclusion - Mkt is just preparing to move in the opp direction. Traders be ware.

TCS at Reasonable PriceTata Consultancy Services (TCS), a part of the Tata Group, is one of the world’s largest IT services, consulting, and business solutions companies. Here's a detailed overview of the **TCS Business Model**:
---
### 🔷 **1. Core Business Areas**
TCS operates primarily in the **IT services and consulting domain**, offering a wide range of services, including:
* **IT Services**: Application development, maintenance, testing, and infrastructure services.
* **Consulting**: Business transformation, digital strategy, and IT consulting.
* **Business Process Services (BPS)**: Outsourced business operations for clients (e.g., finance, HR, customer support).
* **Digital & Cloud Services**: AI/ML, cloud migration, analytics, IoT, cybersecurity.
* **Products & Platforms**: TCS BaNCS (for banking), Ignio (AI ops), TCS MasterCraft, etc.
---
### 🔷 **2. Revenue Model**
TCS earns revenue through:
| Revenue Source | Description |
| ------------------------------ | ------------------------------------------------------------------ |
| **Project-based billing** | Fixed-price or time & material projects for software services. |
| **Subscription-based revenue** | SaaS products and platforms. |
| **Long-term contracts** | Multi-year IT and BPO contracts with recurring income. |
| **Consulting fees** | Specialized consulting for digital transformation and IT strategy. |
---
### 🔷 **3. Key Industry Verticals**
TCS serves various industries, such as:
* **Banking, Financial Services & Insurance (BFSI)** – Largest revenue contributor.
* **Retail & Consumer Goods**
* **Telecom & Media**
* **Manufacturing**
* **Life Sciences & Healthcare**
* **Energy & Utilities**
---
### 🔷 **4. Global Delivery Model (GNDM)**
TCS uses a **Global Network Delivery Model**, combining:
* **Onshore** (client location)
* **Nearshore** (close-by country)
* **Offshore** (India-based delivery centers)
This model ensures cost-efficiency, scalability, and 24x7 service delivery.
---
### 🔷 **5. Clients & Geography**
* Serves **1000+ global clients**.
* Key markets: **North America (biggest)**, Europe, UK, and emerging markets (India, APAC, LATAM).
* Long-term relationships: >95% of revenue from repeat clients.
---
### 🔷 **6. Cost Structure**
* **Employee salaries** (largest cost, with over 600,000 employees).
* **Training and upskilling**
* **Infrastructure and data centers**
* **R\&D and innovation labs**
---
### 🔷 **7. Value Proposition**
* **End-to-end IT services**
* **Digital transformation at scale**
* **Deep industry knowledge**
* **Strong delivery and execution capability**
* **Trust and governance (Tata brand)**
---
### 🔷 **8. Growth Strategy**
* **Investing in AI, Cloud, Cybersecurity**
* **Platform-based offerings**
* **Partnerships with AWS, Microsoft, Google Cloud**
* **Geographic and sectoral diversification**
* **Upskilling employees for future-ready services**
---
### 🔷 **9. Competitive Advantage**
* Strong brand (Tata)
* Consistent financial performance
* High client retention
* Scalable and flexible delivery
* Robust risk management
---
### 🔷 **10. Recent Innovations**
* **TCS AI.Cloud**, **TCS Digitate**, **Quartz Blockchain**
* Co-innovation with clients via **TCS PacePort™ innovation hubs**
thanks

Bullish View In TCS Mark The Date & Price 24.7.25 CMP Is 3150Tata Consultancy Services (TCS) is one of the largest IT services companies globally and a flagship of the Tata Group. Here's a **detailed overview of the TCS business model**:
---
## 🧩 **TCS Business Model**
### 1. **Core Business**
TCS operates primarily as an **IT services, consulting, and business solutions company**. It provides a wide range of services across various domains using a **global delivery model**.
---
### 2. **Revenue Streams**
TCS generates revenue mainly through:
| Revenue Stream | Description |
| ----------------------------------- | ------------------------------------------------------------------------------------ |
| **IT Services** | Application development, maintenance, infrastructure, testing, and managed services. |
| **Consulting** | Business strategy, IT consulting, enterprise transformation. |
| **Digital Services** | AI, IoT, Blockchain, Cloud, Cybersecurity, and Analytics. |
| **Business Process Services (BPS)** | Outsourcing services like finance, HR, and customer care. |
| **Platform-Based Services** | Products like TCS BaNCS (banking), Ignio (AI/automation), and CHROMA (HR). |
---
### 3. **Target Industries**
TCS serves a broad range of industries, including:
* **Banking, Financial Services, Insurance (BFSI)** – \~40% of revenue
* Retail & Consumer Goods
* Telecom & Media
* Manufacturing
* Healthcare & Life Sciences
* Energy & Utilities
* Public Services & Government
---
### 4. **Delivery Model**
**Global Network Delivery Model (GNDM)** is TCS's key competitive advantage. It means:
* 24x7 service from global delivery centers
* Mix of onsite and offshore teams
* Cost-efficient and scalable delivery
---
### 5. **Geographic Presence**
* **North America** – Largest market (50%+ revenue)
* Europe
* India
* Asia-Pacific
* Middle East & Africa
---
### 6. **Innovation & R\&D**
TCS invests in innovation through:
* **TCS Research Labs** (AI, ML, quantum computing)
* **COIN™ (Co-Innovation Network)** – Collaborates with startups, academia, and customers
---
### 7. **Human Resources**
* 600,000+ employees globally
* Focus on training and upskilling (TCS iON, Elevate)
* High employee retention (among the best in industry)
---
### 8. **Key Clients**
TCS serves:
* Over **1,000 clients globally**
* 58 clients with \$100M+ annual revenue
* Long-term contracts, often >5 years
---
### 9. **Digital Transformation Projects**
TCS helps companies adopt:
* Cloud migration (via AWS, Azure, Google)
* ERP systems (SAP, Oracle)
* Industry 4.0 and automation
---
### 10. **Cost Structure**
* Major costs: Human resources, tech infra, R\&D
* Operates at high profit margins (\~24% EBIT margin)
---
### 🏆 **Strengths of TCS**
* Strong brand and Tata legacy
* Scalable and diversified portfolio
* Consistent financial performance
* Client stickiness and long-term contracts
---
Thanks

The Nuances of Trading : How to draw lines on chart (Examples)Let's Learn the Trading Together... I have started a new series of trading called #LNT (Learn the Nuances of Trading) where you are going to learn All the things which is going to help you to be a good trader.. (#TNT program)
Learning in Video : In This Video I have teach you how to draw Lines (Examples) ..
It is going to very helpful if you participate the challenges so that we can build a very good trading community..
It is my attempt to teach you the trading.. Hope you will like.
Disclaimer : It is my personal view as a trader and for educational purpose only. Equity market involves risk.
Please consult your financial adviser before taking any decision.

As long as TCS is below 3305, it is a value buying opportunity. As long as TCS is below 3305, it is a value buying opportunity. No need to panic. You are going to make money in India's number one IT company.

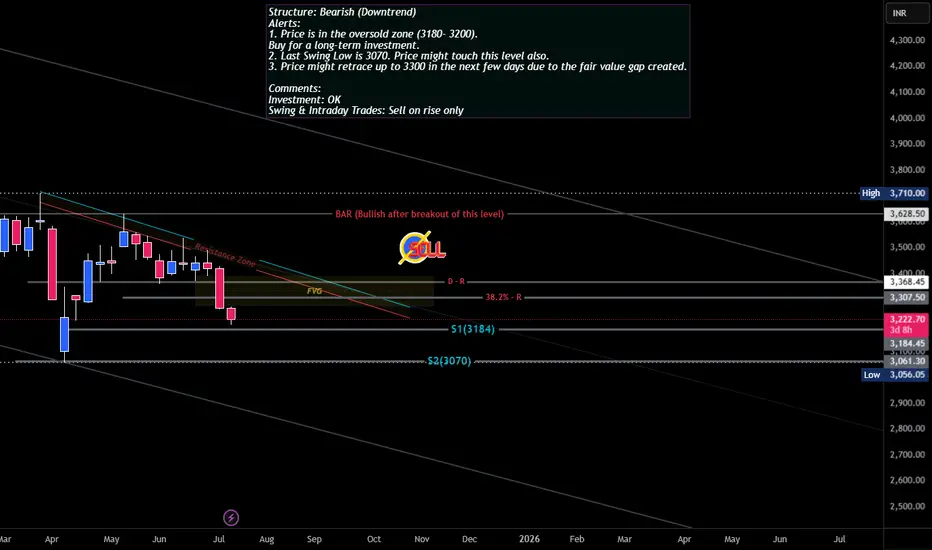
TCS Trade SetupStructure: Bearish (Downtrend)
Alerts:
1. Price is in the oversold zone (3180- 3200).
Buy for a long-term investment.
2. Last Swing Low is 3070. Price might touch this level also.
3. Price might retrace up to 3300 in the next few days due to the fair value gap created.
Comments:
Investment: OK
Swing & Intraday Trades: Sell on rise only
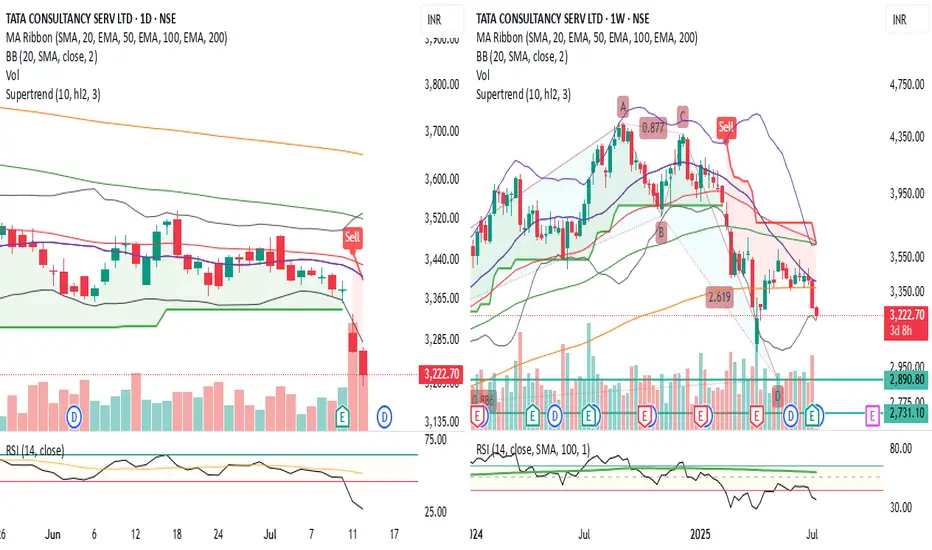
TCS BULLISH BAT formation or breakdown TCS seems to be forming bullish BAT pattern on weekly chart
RSI on daily and weekly below 40
Price below all major moving averages on daily and weekly
Price broke down 50 month EMA last week
Next Harmonic Support near 2890 - 2930 levels
Lets See How it Evolves.
Disclaimer: NOT A BUY / SELL RECOMMENDATION I am not an expert I just share interesting charts here for educational purpose and not to be taken as buy/sell recommendation. Please seek expert opinion before investing and trading as trading/ investing in market is subject to market risks. I do not hold any position in the stock as on date but I may look to take some position with my own Risk Reward matrix.
TCS breakdown ?TCS 2286 is showing signs of breakdown . Shorts could be considered below 3413.
Keep away from longs below 3413.
TCS No Need To Fear TCS No Need To Fear reason Behind
All Short position Are Reverse From VWAP
And Trend Change Here
This Gap Down Is Fixed
Vwap is 3299 which Indicating By Black Line On Charts

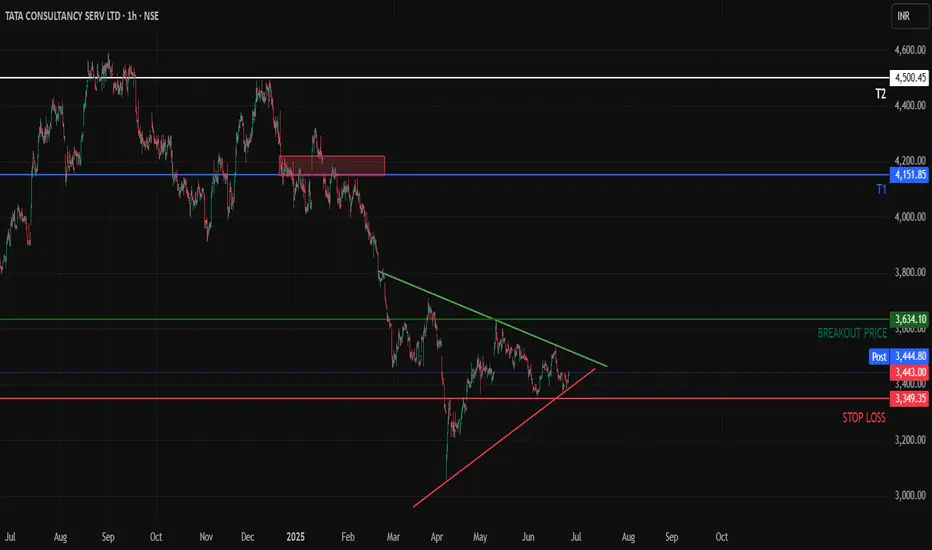
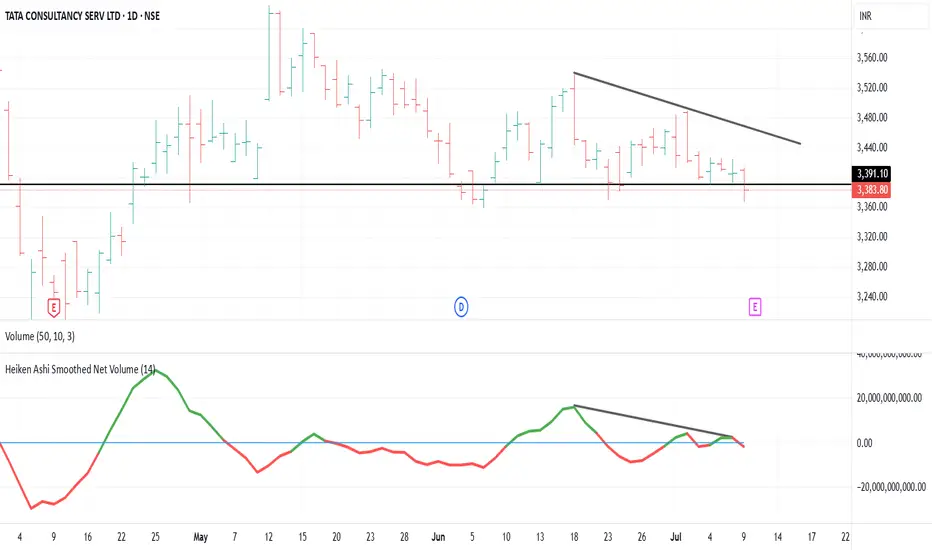
TCS - About to Break out of a consolidation Hello All,
Here is the 1H time frame of TCS which is making a triangle pattern with converging prices at the bottom its recent downtrend.
We can expect T1 once Breakout Price is reached and we get at least a 1H candle closing above the marked breakout price
Once the supply zone near T1 is cleared we can expect prices to hit T2 as well
Above T2, Sky is the Limit for TCS