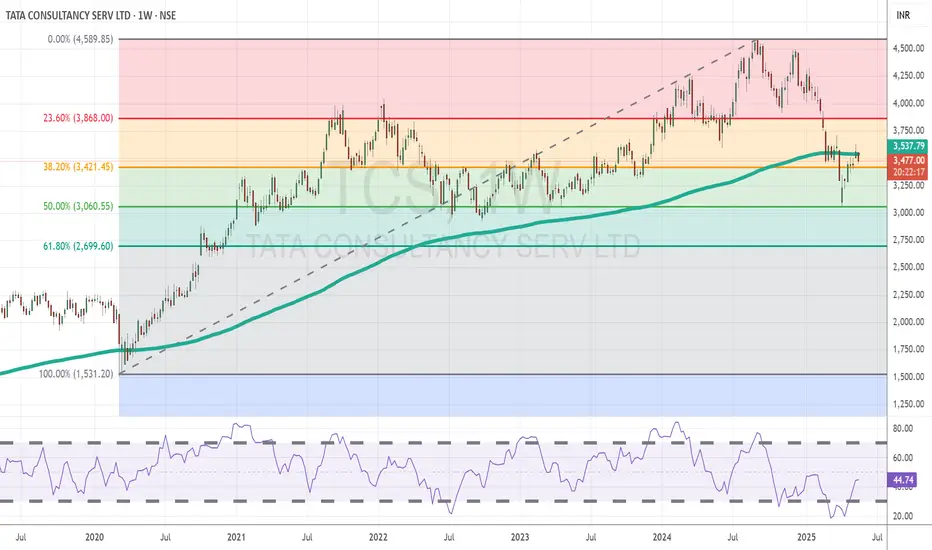
TCS Eyes Recovery After Holding Strong at Key Support LevelsTopic Statement:
TCS has shown signs of recovery after a recent correction, with strong technical support levels reinforcing bullish potential.
Key Points:
The price previously found strong and consistent support near the ₹3000 mark, reaffirmed during the recent market correction.
A full retracement to the 50% Fibonacci level** at ₹3060 attracted significant buying interest, highlighting renewed strength.
Currently, the stock trades just below the 200-day EMA, indicating it remains in oversold territory, but with potential for reversal if momentum continues.
Trade ideas
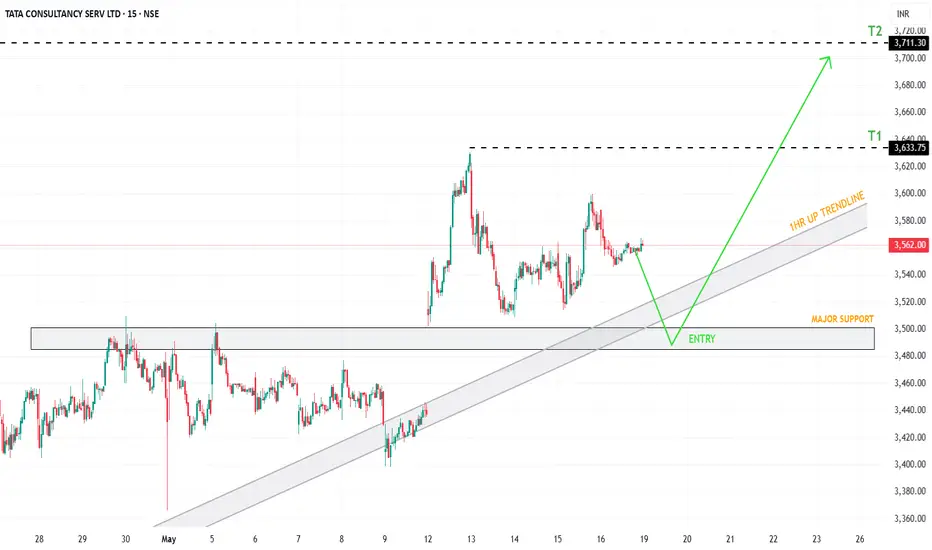
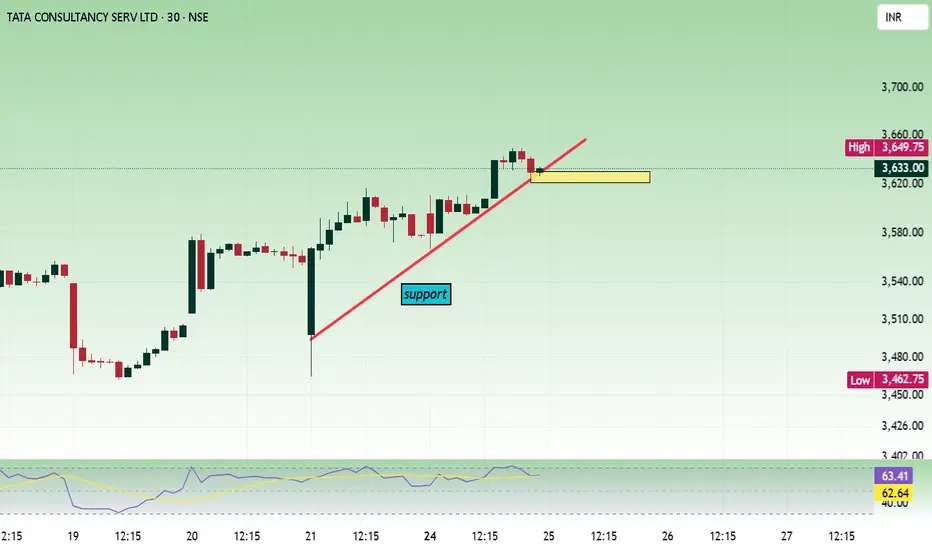
TCS | 15 min Idea – 18 May 2025 | BTST / SWING 📌 TCS | 15 min Idea – 18 May 2025
Bias: Bullish above trend-line
CMP: ₹3,562
Market Structure
• Higher-lows forming along 1HR trendline; price holding above 200 EMA cluster
• Sideways consolidation above ₹3,520 – potential breakout setup forming
Levels
│ R1 ₹3,633 │ R2 ₹3,711
│ S1 ₹3,520 │ S2 ₹3,490
Trade Plan
🟢 Breakout Long → Entry on 15‑min close > ₹3,633
Targets ₹3,685 / ₹3,711 | SL ₹3,600
🟢 Pullback Long → Buy ₹3,500–₹3,520 zone on bullish 15‑min candle
Targets ₹3,600 / ₹3,633 | SL ₹3,485
🔴 Breakdown Short → Entry on 15‑min close < ₹3,490
Targets ₹3,460 / ₹3,430 | SL ₹3,510
Notes
• ₹3,520–500 zone = strong support with trendline + EMA confluence
• Break above ₹3,633 can unleash momentum toward ₹3,700+ swing level
Set TradingView alerts at ₹3,633 & ₹3,490; manage risk ≤ 1% per trade.
#PriceAction #TCS #15min #GLOBALTRADESECURITIES
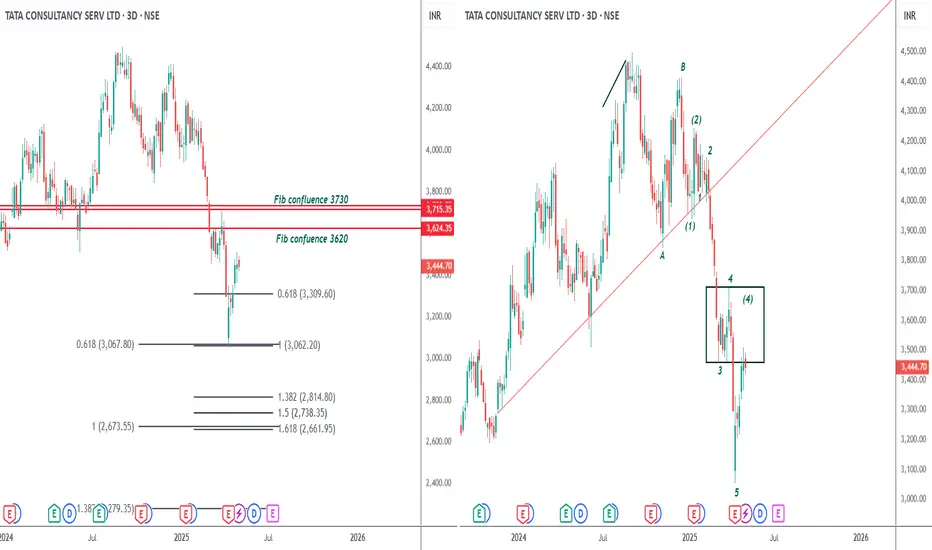
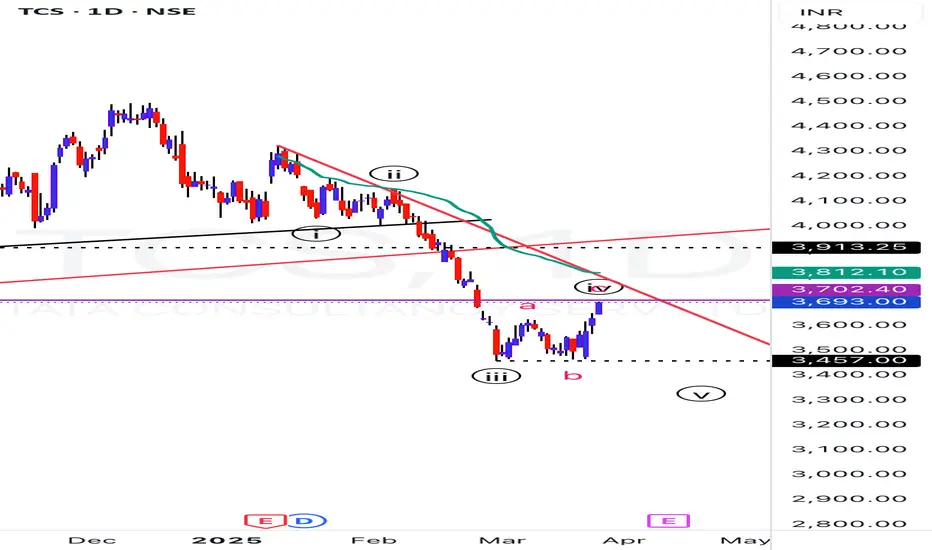
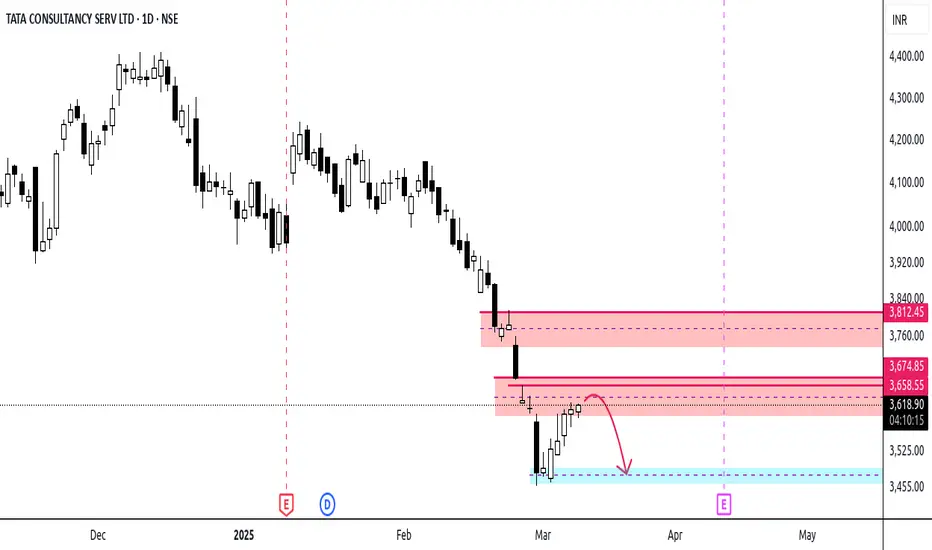
Fall still not overTCS CMP 3444
Elliott - The 4th waves tend to cluster together. I have put a box around the 4th wave. Hence the current zone to 3730 is where this rally should fizzle. The 5th wave should start post that.
Fibs Even the Fib confluence is confirming a max rally to 3730. The first tgt is back to the lows at 3060. the second tgt is at 2670. Both these zones are fib confluence zones and are a high prob tgts.
Conclusion - The fall is still not over. So will suggest to be on the sidelines. The stock can turn from anywhere from the current zone to max of 3730.
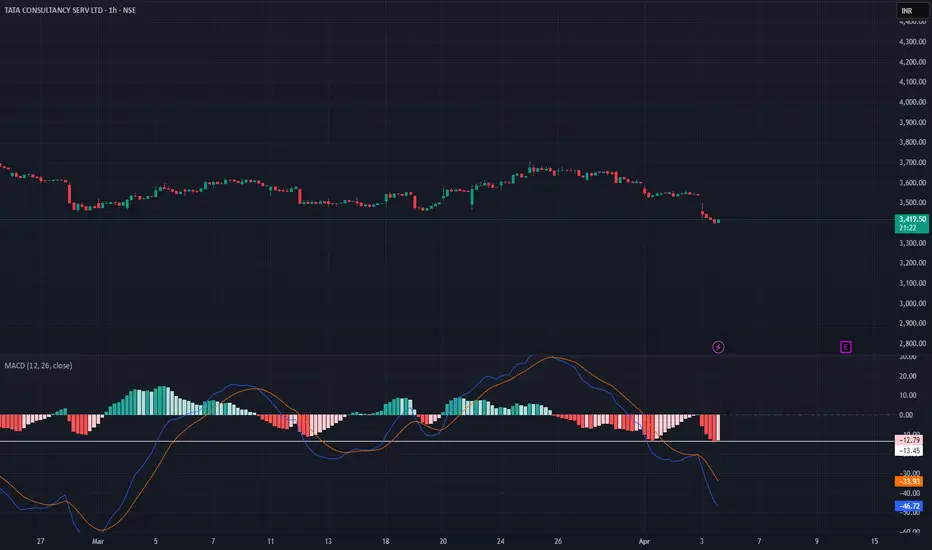
TIME TO BUY OR WAITMACD line: -47.04, Signal line: -34.00 — massive divergence = strong downward momentum
Histogram still expanding — no sign of slowing bearish pressure yet
Price is not diverging from MACD yet = no reversal setup
This is not a buy-the-dip yet
This zone (₹3,380–3,400) is previous support from Dec/Jan, so we’re testing an old demand zone
wait and watch
TCS No any Resistance up to 15% . 28/02/2025NSE INDIA, Symbol : TCS Timeframe : Daily. TCS 28/02/2025 I was predicted TCS Break down good support line then next support 3600 .TCS down fouls her marked target 3600 below. Today TCS is above 3600 , taking the lower support of the marked is a good support level and the resistance on the upside is above 20%. Therefore, a strong UP bounce back move in TCS will be recommended.

TCSPrice is at trend line support. Sustaining above 3600 is important to be bullish.
Buy above 3625 with the stop loss of 3602 for the targets 3646, 3668, 3690, 3704 and 3730.
Sell below 3580 with the stop loss of 3600 for the targets 3560, 3530, 3504, 3488 and 3472.
Always do your own analysis before taking any trade.
TCS - One more Low is due?The wave counts suggests that one more low is due on TCS.. but price actions suggests that double bottom breakout and W pattern formation in play.. let’s see what’s in store
TCS with W pattern Seems like, IT stocks creating W pattern. More focus on TCS as it gives very good divident too. It is creating W pattern with very good old support. One can buy for long term considering its divident.
Database Trading# **Database Trading**
Database trading leverages **historical market data, AI, and quantitative analysis** to identify high-probability trade setups.
✅ **Data-Driven Approach:** Uses past price action, volume, and indicators.
✅ **Backtesting & Optimization:** Tests strategies on historical data for accuracy.
✅ **Automated Execution:** Uses algorithms for fast, precise trading decisions.
### **Conclusion**
This method enhances **consistency, precision, and risk management**, making trading more systematic and efficient. 🚀

TCS Approaches Strong Support Amid Severe CorrectionTopic Statement:
TCS has seen a sharp correction in recent months, with the stock finding support at the 3500 level while trading below the 180-day EMA, indicating oversold conditions, further confirmed by a highly oversold weekly MFI.
Key points:
- Stock takes support at the 38.2% retracement level
- Price is below the 180-day EMA, marking it as oversold
- Weekly MFI is at 18, indicating the stock is highly oversold
what is MACD trading ?# **What is MACD Trading?**
MACD (**Moving Average Convergence Divergence**) is a trend-following momentum indicator used to identify **trend direction, strength, and potential reversals**.
## **1️⃣ Key MACD Components**
✅ **MACD Line:** Difference between the **12-day & 26-day EMA**.
✅ **Signal Line:** **9-day EMA** of the MACD line (triggers buy/sell signals).
✅ **Histogram:** Measures distance between MACD & Signal Line (momentum strength).
## **2️⃣ How to Trade with MACD**
✅ **MACD Crossover:**
🔹 **Bullish:** MACD crosses above Signal Line → **Buy signal**.
🔹 **Bearish:** MACD crosses below Signal Line → **Sell signal**.
✅ **MACD Divergence:**
🔹 **Bullish:** Price makes **lower lows**, MACD makes **higher lows** → **Uptrend reversal**.
🔹 **Bearish:** Price makes **higher highs**, MACD makes **lower highs** → **Downtrend reversal**.
### **Conclusion**
MACD is a **powerful tool for trend confirmation and momentum analysis**. Using it with **support-resistance and volume** increases trade accuracy. 🚀

TCS | To Bleed MoreFrom the Highs of 4400s to the recent lows of 3500s stock has almost corrected near 20% n finally started to rose from a good weekly demand zone
But it seems the trouble is not over yet
As we can see a strong supply zone with gaps is present in the daily time frame, with a supply range between 3600 - 3670
Any signs of bearishness in lower time frame will be a good time to sell CE or buy PE with a strict Sl above 3680 for a downside target of 3450
Stock also has one more selling opportunity area in daily time frame with supply range between 3750 - 3775
If monitored properly can benefit from both the opportunities
TCS trading at nearby support regionThe price is falling like a crash and there is support at 1.272 level as per harmonic patterns. After confirmation,lets take long position. This is for educational purposes only.

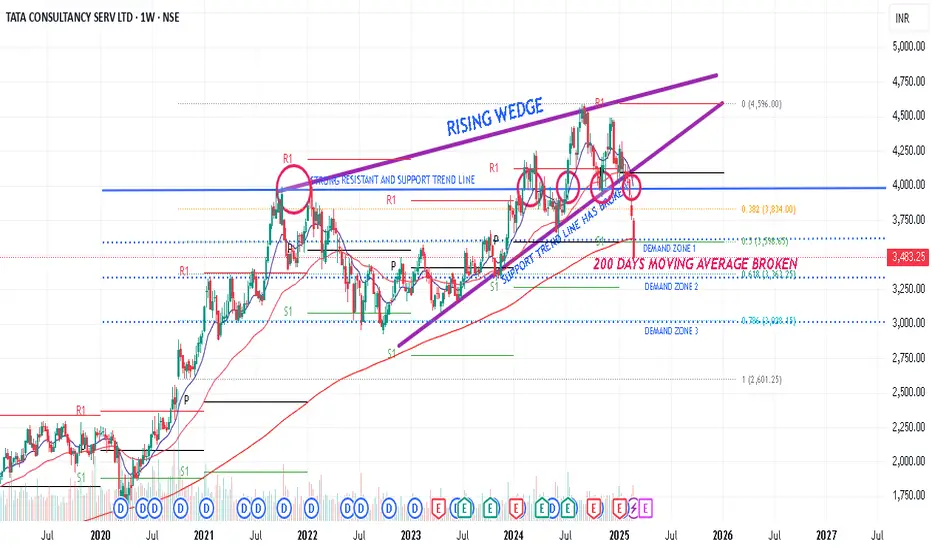
TCS Rising wedgeRising wedge support line has broken and retesting thar line
and the following demand zones are very important for consideration and accumulation.
demand zone 1 - 3600
demand zone 2 - 3330
demand zone 3 - 3000
This analysis is my own idea.
I don't recommend taking trade based on this idea.
consult your SEBI registered adviser to Know the market risk before.
in.tradingview.com
TCS Breakdown Support 3600 28/02/2025NSE INDIA , SYMBOL : TCS TIMEFRAME : DAILY , I was predicted 21/01/2025 TCS on big support line 12/02/2025 TCS Breakdown the line & Next TCS support 3600 Today Breakdown this support line

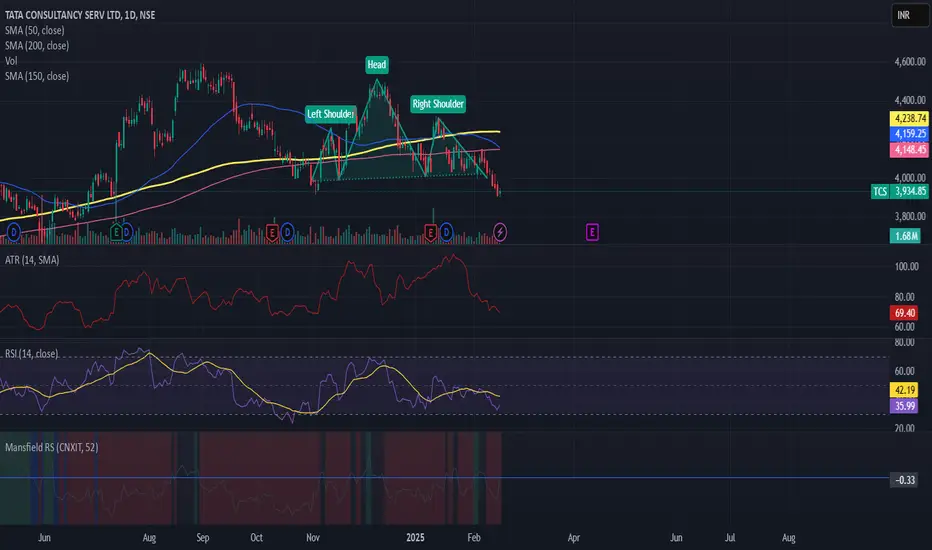
Clear weakness in the Indian markets now extending to IT sectorContinued selling pressure dragging the markets with a spillover effect on one of the most resilient sectors. NSE:TCS has caught my attention forming H&S pattern over 4 months. This signifies weakness with a stop above 4310 with targets 3780,3660,3455. Lacklustre volumes couples with poor outlook and MAGA 2.0 adds more conviction. Chose the pullback near 4000 and CAPITALISE
Opportunities in India's IPO Market# Opportunities in India's IPO Market
India’s IPO market is booming, with companies across sectors raising capital through public listings. Investors can capitalize on early-stage growth, listing gains, and long-term wealth creation by strategically investing in IPOs.
## 1️⃣ Why Consider IPO Investments?**
✅ Early-Mover Advantage:** Get in at the ground level before institutional investors.
✅ Listing Gains: Strong demand often leads to high first-day premiums.
✅ Long-Term Growth: Quality IPOs with strong fundamentals deliver multi-bagger returns.
## 2️⃣ Key Sectors Driving IPO Growth
✅ Tech & Startups: New-age businesses like fintech, SaaS, and e-commerce attract investors.
✅ Manufacturing & Infrastructure: Government initiatives like PLI schemes boost IPO activity.
✅ Healthcare & Pharma: Growing demand post-pandemic fuels new public offerings.
## 3️⃣ How to Identify Profitable IPOs?
✅ Strong Fundamentals: Look for consistent revenue, profitability, and growth potential.
✅ Valuation Analysis: Compare IPO pricing with industry peers to avoid overvaluation.
✅ Anchor Investor Participation: High FII & DII involvement signals strong confidence.
### Conclusion
India’s IPO market offers exciting opportunities, but due diligence is key. Evaluating **business fundamentals, industry trends, and valuation helps investors maximize gains while managing risks. 🚀

Understanding Bullish & Bearish Candles FormationHello Traders!
In today’s post, we’ll be discussing the Candlestick Formation setup, which is essential for reading price action and identifying potential trend reversals. Candlestick patterns are a crucial tool for traders to understand market sentiment and predict future price movements. Let’s break down the two most common formations: Bullish Candlestick and Bearish Candlestick .
Bullish Candlestick Formation Setup
What is a Bullish Candlestick?
A bullish candlestick appears when the price closes higher than it opened. This formation suggests that buyers are in control and the price is likely to rise further.
Key Components of the Bullish Candlestick:
Body : The green section between the open price and the closing price . This is the main body of the candle, indicating the price movement during that time period.
Wicks : The thin lines above and below the body of the candle. The upper wick shows the highest price reached during the period, while the lower wick shows the lowest price.
Closing Price : The point at which the price closed for the trading period. A higher closing price indicates strong bullish momentum.
Open Price : The price at which the asset opened at the start of the trading period.
Low & High : The low is the bottom of the lower wick, and the high is the top of the upper wick.
When to Look for Bullish Candlesticks?
A bullish candlestick typically forms at the bottom of a downtrend, indicating a potential reversal or continuation to the upside. It’s a signal that the market is gaining upward momentum.
Bearish Candlestick Formation Setup
What is a Bearish Candlestick?
A bearish candlestick forms when the price closes lower than it opened. This indicates that sellers have control, and the price might continue to fall.
Key Components of the Bearish Candlestick:
Body : The red section between the open price and the closing price , representing downward price movement during the period.
Wicks : Similar to the bullish candlestick, the upper wick shows the highest price during the period, and the lower wick shows the lowest.
Closing Price : The point at which the price closed during the period, showing the downward momentum of the asset.
Open Price : The price at which the asset opened, showing the start of the downward movement.
Low & High : The high is at the top of the upper wick, and the low is at the bottom of the lower wick.
When to Look for Bearish Candlesticks?
A bearish candlestick typically forms at the top of an uptrend, signaling a possible trend reversal or a continuation to the downside. It suggests that selling pressure is building up.
Key Differences: Bullish vs Bearish Candlesticks
Bullish Candlestick:
The close is above the open .
Indicates upward price movement or buying strength.
Appears during a downtrend reversal .
Bearish Candlestick:
The close is below the open .
Signals downward price movement or selling pressure.
Appears during an uptrend reversal .
Trading with Candlestick Formations
Confirm the Trend : Look for candlestick formations at key levels, such as support and resistance, or after a strong uptrend or downtrend.
Use Multiple Candles : Don’t rely on just one candlestick. Look for multiple bullish or bearish candles to confirm the direction.
Combine with Other Indicators : Use candlestick patterns in conjunction with technical indicators like RSI, MACD, or moving averages for stronger confirmation.
Pay Attention to Volume : High volume with a bullish or bearish candlestick gives more weight to the signal.
Conclusion
Candlestick formations are one of the most powerful tools in a trader’s arsenal. By understanding the bullish and bearish setups, you can predict market movements and make informed decisions. Remember, always confirm the pattern with other indicators and never trade based on just one candlestick.
What candlestick patterns do you use in your trading strategy? Let me know in the comments!

TCS Trade Setup### **📊 TCS Trade Setup (1D Chart) 📊**
🔹 **Pattern:** Harmonic Bullish Pattern
🔹 **Entry Zone:** **3,629.55**
🔹 **Stoploss:** **3,507.65** 🚨
🔹 **Target Levels:**
✅ **3,913.70**
✅ **4,004.25**
✅ **4,326.05**
💡 **Key Insights:**
✅ **D-Point Reached** – Possible Bullish Reversal 🟢
✅ Strong Demand Zone observed around **3,565 – 3,629**
✅ **Risk-Reward Ratio** looks favorable 📈
📌 **Disclaimer:** This analysis is for **educational purposes only** and not financial advice. Trade cautiously! 🚀

tata consultancy services longTata Consultancy Services (TCS) is a leading global IT services, consulting, and business solutions organization headquartered in Mumbai, India. As a part of the Tata Group, TCS operates in over 50 countries and employs more than 600,000 professionals. citeturn0search1
**Fundamental Analysis:**
- **Financial Performance:**
- **Revenue Growth:** TCS has demonstrated consistent revenue growth, with a reported revenue of $25.7 billion in the fiscal year ending March 2024. citeturn0search1
- **Profitability:** The company maintains a strong profit margin, reflecting its efficient operations and robust business model.
- **Market Position:**
- **Global Presence:** TCS operates in 150 locations across 46 countries, serving clients in various industries, including banking, retail, telecommunications, and manufacturing. citeturn0search1
- **Client Base:** The company has established long-term relationships with major corporations worldwide, contributing to its stable revenue streams.
- **Recent Developments:**
- **Strategic Partnerships:** In February 2025, TCS partnered with Salesforce to leverage artificial intelligence for manufacturers and semiconductor suppliers, aiming to enhance operational efficiencies. citeturn0search0
- **Industry Recognition:** TCS was ranked as Europe's #1 IT services provider for customer satisfaction in February 2025, underscoring its commitment to quality service delivery. citeturn0search0
**Technical Analysis:**
- **Stock Performance:**
- **Current Price:** As of February 24, 2025, TCS's share price is ₹3,500.
- **52-Week Range:** The stock has traded between ₹3,200 and ₹3,800 over the past year, indicating a stable performance within this range.
- **Support and Resistance Levels:**
- **Support Level:** The immediate support is around ₹3,400.
- **Resistance Level:** The immediate resistance is near ₹3,600.
**Conclusion:**
TCS continues to exhibit strong financial performance and maintains a leading position in the global IT services industry. Its strategic partnerships and industry recognitions reflect its commitment to innovation and customer satisfaction. The stock's stable performance and favorable technical indicators suggest a positive outlook for investors.

best strategies for swing trading Swing trading focuses on capturing short- to medium-term gains within a trend, typically holding positions for a few days to a few weeks. Here are some strategies to consider for effective swing trading:
### 1. **Trend Following Strategy**
- **Concept**: This strategy relies on identifying and trading with the prevailing trend. Swing traders use technical analysis to spot the direction of the market and enter trades at the early stages of the trend.
- **Tools**: Moving averages (e.g., 50-day and 200-day), trendlines, and price action.
- **Steps**:
- Identify the trend direction (uptrend or downtrend).
- Wait for a pullback or consolidation.
- Enter at the beginning of a new leg of the trend (using tools like the RSI or MACD to confirm momentum).
- **Risk Management**: Set stop-loss orders just below recent swing lows in an uptrend (or above swing highs in a downtrend).
### 2. **Range-Bound Trading Strategy**
- **Concept**: This strategy works well in a sideways or consolidating market. Traders identify key support and resistance levels and trade within this range.
- **Tools**: Bollinger Bands, RSI, Stochastic Oscillator, and support/resistance zones.
- **Steps**:
- Identify strong support and resistance levels.
- Buy near support and sell near resistance.
- Use indicators like RSI to confirm overbought or oversold conditions for entry and exit points.
- **Risk Management**: Place stop-loss orders just outside the support/resistance levels.
### 3. **Breakout Strategy**
- **Concept**: Swing traders often look for breakouts from consolidation patterns (e.g., triangles, flags, or channels). A breakout occurs when the price moves beyond a key support or resistance level.
- **Tools**: Price patterns, moving averages, volume.
- **Steps**:
- Identify key consolidation patterns.
- Wait for the price to break out of the pattern with high volume.
- Enter when the breakout is confirmed.
- **Risk Management**: Place a stop-loss below the breakout level (in an uptrend) or above (in a downtrend).
### 4. **Momentum Trading Strategy**
- **Concept**: This strategy focuses on stocks or assets that are moving strongly in one direction due to high momentum, often driven by news or strong earnings reports.
- **Tools**: Momentum indicators like the RSI, MACD, or the Average Directional Index (ADX).
- **Steps**:
- Look for stocks with strong momentum (high volume and significant price movement).
- Wait for pullbacks within the trend to enter the market.
- Ride the trend until momentum begins to wane.
- **Risk Management**: Set trailing stop losses to lock in profits as the trend develops.
### 5. **Reversal Trading Strategy**
- **Concept**: This strategy involves identifying potential reversals in trends and trading against the prevailing trend. The idea is to catch turning points when the market is due for a correction.
- **Tools**: Candlestick patterns (e.g., doji, engulfing), RSI, MACD, and Fibonacci retracement.
- **Steps**:
- Look for signs of trend exhaustion (e.g., divergence between price and RSI).
- Enter after spotting reversal candlestick patterns or overbought/oversold conditions.
- Monitor volume as a confirmation signal.
- **Risk Management**: Use tight stop-loss orders to limit potential losses if the reversal doesn't happen.
### 6. **Swing Trading with Fibonacci Retracement**
- **Concept**: Fibonacci levels are used to identify potential levels of support and resistance during a pullback within a trend. Traders can enter at these levels when the market is likely to reverse.
- **Tools**: Fibonacci retracement tool, moving averages.
- **Steps**:
- Plot Fibonacci retracement levels from the most recent swing low to swing high (for an uptrend) or high to low (for a downtrend).
- Enter when the price approaches key Fibonacci levels (38.2%, 50%, or 61.8%).
- Confirm entry with indicators like RSI or MACD for additional validation.
- **Risk Management**: Place stop-loss orders just outside the key Fibonacci levels.
### 7. **Volume-Based Strategy**
- **Concept**: Volume plays an important role in confirming trends and reversals. A surge in volume often indicates strong price movement, and traders can use volume analysis to identify potential swing trades.
- **Tools**: Volume indicators, moving averages, price patterns.
- **Steps**:
- Monitor volume spikes during breakouts or reversals.
- Look for confirmation of volume supporting price moves.
- Enter trades when volume increases in the direction of the trend.
- **Risk Management**: Set stop-loss levels based on recent price movements and volume analysis.
### 8. **Earnings Momentum Strategy**
- **Concept**: Traders may use earnings reports and upcoming earnings momentum to capture moves. Stocks often exhibit volatility around earnings releases, offering potential opportunities for swing traders.
- **Tools**: Earnings calendar, earnings estimates, technical indicators.
- **Steps**:
- Monitor earnings announcements and estimate earnings beats or misses.
- Trade in anticipation of a move post-earnings.
- Watch for price action and volume to confirm the direction after earnings are released.
- **Risk Management**: Ensure stop-losses are in place in case earnings results don’t move as expected.
### Additional Tips for Swing Trading:
- **Use stop-loss orders**: Protect yourself from large losses by setting stop-loss orders based on your risk tolerance.
- **Keep your trades small**: Avoid putting too much capital into any single trade to protect against risk.
- **Maintain discipline**: Don’t chase the market. Stick to your strategy and avoid emotional decisions.
- **Trade during optimal hours**: Liquidity and volatility are higher during market open and close hours, providing better opportunities for swing trades.
By combining these strategies with sound risk management, swing traders can take advantage of short-term price movements while managing their exposure.

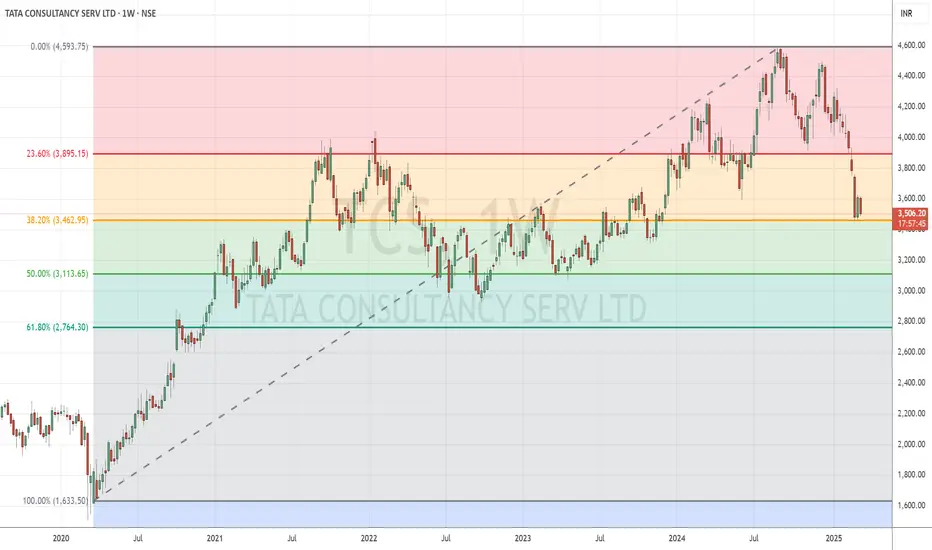
TCS Date 24.02.2025
TCS
Timeframe : Weekly
A combination of rsi 30 + 200 weekly ema has made bottom in the past twice, this time got extended support of 61.8% golden ratio as well
Regards,
Ankur

TCS : Heading DOWN Closer to SupportNifty IT index is in a downtrend, and another 4-5% fall in the index seems imminent, before some relief. Inspite of decent results and forecast, the TCS share prices are taking a beating too.
- It has decisively broken it Monthly support of 20month EMA line, and also the weekly support pivot, and is trading below it now. So, in the short term stock is expected to remain under pressure.
- TCS stock prices may find support near 3500 to 3700 zone now, where 200 week EMA and weekly support pivot is located, and just below it 3300 to 3400 levels are also strong support zone
- In case of any bounce, traders may decide to sell the stock again and level of 4000 to 4100 is also going to act as strong resistance in the TCS stock.
- RSI indicator is also suggesting weakness in the stock in short term.
- As volatility in the stock is inching UP, an option trade might be the best bet to trade this stock with lower risk.
#stoxsense #learntradingwithsudhir #learn_at_stoxsense #TCS #NiftyIT
