Mastering the Three White Soldiers Pattern: A Bullish ReversalHello Traders!
I hope you're doing great in your trading journey! Today, we will be diving into the Three White Soldiers chart pattern, a powerful bullish reversal pattern that can help you spot a potential trend shift. This pattern typically occurs after a downtrend, signaling a strong reversal. If you can spot it early, it offers a high-reward trading opportunity. Let’s break down the pattern and how to use it effectively.
What is the Three White Soldiers Pattern?
The Three White Soldiers pattern consists of three consecutive long bullish candles that close progressively higher. This pattern typically appears after a downtrend and signifies a potential reversal. The pattern shows a strong shift in market sentiment, where buyers are stepping in to push the prices higher.
Key Characteristics of the Three White Soldiers Pattern
Trend Reversal: The pattern forms after a strong downtrend, signaling a potential trend reversal.
Three Consecutive Bullish Candles: The pattern consists of three long bullish candles, each closing higher than the previous one.
Strong Closing Prices: Each candle should close near its high, indicating strong buying pressure.
Volume Confirmation: The pattern is more reliable when accompanied by increasing volume, showing strong interest in the reversal.
How to Trade the Three White Soldiers Pattern
Entry Point: Consider entering a long position once the third candle closes, confirming the reversal.
Stop Loss: Place your stop loss below the low of the first candle in the pattern to limit potential losses.
Profit Target: For setting targets, measure the height of the pattern (distance between the low of the first candle and the high of the third candle) and project this distance upwards from the entry point to set your profit target.
Real-World Application: TCS Case Study
In the chart of Tata Consultancy Services (TCS) , we see a clear Three White Soldiers pattern forming after a downtrend. The price closed progressively higher over three consecutive days, breaking key resistance levels and signaling a potential bullish trend. Traders entering after the confirmation of the pattern would have witnessed a substantial upward move, with a clear Stop Loss and Profit Target in place.
Risk Management Considerations
Position Sizing: Adjust your position size according to your risk tolerance and overall portfolio.
Stop Loss Placement: Place your stop loss below the low of the first candle to manage risk in case the pattern fails.
Volume Confirmation: Confirm the pattern with increasing volume to ensure the strength of the reversal.
What This Means for Traders
The Three White Soldiers pattern is an excellent tool for identifying trend reversals and can be a powerful signal when used in conjunction with other technical indicators. Remember to always look for confirmation with volume and manage your risk effectively.
Look for the pattern after a significant downtrend to identify potential bullish reversals.
Use volume to confirm the strength of the pattern and increase the reliability of your trade.
Implement stop loss placement to minimize risk while targeting a favorable risk-to-reward ratio.
Conclusion
The Three White Soldiers pattern is a reliable bullish reversal signal that can offer excellent trading opportunities when combined with other technical indicators. By understanding its key characteristics, waiting for confirmation, and managing risk appropriately, you can increase your chances of making profitable trades.
Have you traded using the Three White Soldiers pattern?
Share your thoughts and experiences in the comments below! Let’s keep learning and improving our trading strategies!
Trade ideas

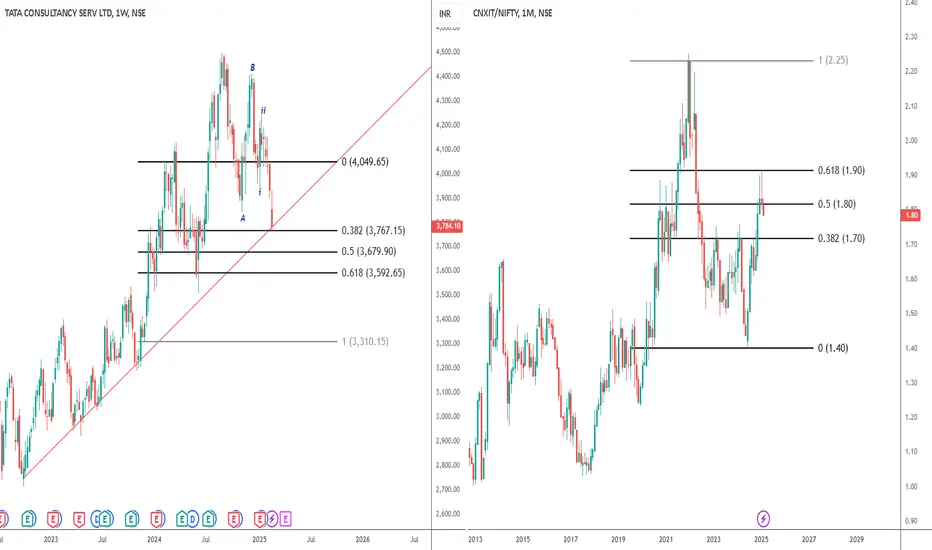
Correction not over in ITTCS CMP -3784
I had stated before that IT and Pharma is also weak and they will also correct. They have started late and will correct further.
Elliott- the iiird wave of C of the zig zag corrective pattern is underway. Below 3760 we will see 3680 and 3590.
Nifty IT vs Nifty 50 - on the right is the ratio chart. See how the IT performed better than Nifty during the sharp sell off. Now its time for Nifty 50 to do better. Which also means the correction in IT is still not done.
Three Black Crows: How to Spot and Profit from Bearish ReversalsHello Traders!
I hope you’re all doing great! Today, we’ll discuss the Three Black Crows candlestick pattern, one of the most reliable bearish reversal patterns you can find in technical analysis. If you're serious about identifying potential trend reversals, understanding this pattern is essential.
The Three Black Crows is a powerful bearish signal that typically marks the end of an uptrend. It consists of three consecutive long red (or black) candles that close progressively lower, showing strong selling pressure and a shift in momentum. This pattern is particularly effective when it forms at a key resistance level, and it can lead to significant price declines.
What is the Three Black Crows Pattern?
The Three Black Crows candlestick pattern signals the reversal of an uptrend. The pattern forms when:
The first candle is a large red candle, closing near the low of the day.
The second candle opens below the first one and closes lower.
The third candle opens lower than the second one and closes near its low.
Each candle in the sequence is characterized by strong bearish price action, and their alignment suggests that bears are gaining control.
Key Characteristics of the Three Black Crows Pattern
Bearish Trend Reversal: Three long red candles following an uptrend suggest a shift in momentum from buyers to sellers.
Strong Resistance Zone: The pattern is more reliable when it forms near a strong resistance level, where the price has struggled to move past in the past.
Closing at the Low: Each of the three candles closes near their respective lows, showing increasing selling pressure.
Volume Confirmation: Volume should ideally increase with each successive candle, confirming that bears are taking control.
How to Trade the Three Black Crows Pattern
Entry Point: After the formation of the third candle, consider entering a short position once the price breaks the low of the third candle. This confirms the bearish trend.
Stop Loss: Place your stop loss just above the high of the third candle to minimize risk in case of a false breakout.
Profit Target: Measure the distance from the high of the pattern to the low of the third candle. Project this distance downward from the breakout point to estimate your profit target.
Real-World Application: Tata Consultancy Services Case Study
In the chart of Tata Consultancy Services (above), we can see a classic example of the Three Black Crows pattern. The price formed a resistance zone and then saw the three consecutive bearish candles break the support, confirming the bearish trend reversal. The huge fall after the pattern’s confirmation indicates the power of this candlestick formation.
Risk Management Considerations
Position Sizing: Adjust your position size based on your risk tolerance and make sure it fits within your overall portfolio strategy.
Stop Loss Placement: Place your stop loss above the third candle to avoid potential losses from a false breakout.
Confirmation with Volume: Always wait for volume confirmation before entering the trade. Volume should increase as the pattern forms.
What This Means for Traders
The Three Black Crows is an excellent pattern to spot potential trend reversals, especially after an uptrend. This pattern works best when combined with other technical indicators like trendlines, support and resistance, and moving averages to confirm the trend reversal.
Look for the pattern at resistance levels to identify high-probability bearish reversals.
Confirm with volume to increase the reliability of the pattern.
Use proper stop loss placement to manage your risk and ensure a favorable risk-to-reward ratio.
Conclusion
The Three Black Crows candlestick pattern is a reliable bearish reversal signal that can help traders capitalize on price declines. By identifying the pattern correctly, waiting for confirmation, and applying solid risk management strategies, you can improve your trading success.
Have you traded using the Three Black Crows pattern?
Share your experiences in the comments below! Let’s keep learning and growing together!

TCS RISING WEDGEFalling wedge support line has broken and retesting thar line
and the following demand zones are very important for consideration and accumulation.
demand zone 1 - 3600
demand zone 2 - 3330
demand zone 3 - 3000
This analysis is my own idea.
I don't recommend taking trade based on this idea.
consult your SEBI registered adviser to Know the market risk before.

TCS Breakdown Next Support 3600 17/02/2025Timeframe : Daily , Exchange : NSE ,Symbol : TCS I was predicted 21/01/2025 TCS on big support line 12/02/2025 TCS Breakdown the line .Today TCS trade down the line. Next TCS support 3600

TCS trendline retest Tata Consultancy Services (TCS) is a leading global IT services and consulting company. Here's a detailed analysis of TCS's stock performance, focusing on the daily timeframe and recent trendline retests:
**Current Stock Price:**
As of February 14, 2025, TCS's share price is ₹3,934.85, reflecting a 0.63% increase from the previous day. citeturn0search0
**Recent Performance:**
- **1-Month Return:** The stock has declined by 7.04% over the past month. citeturn0search7
- **1-Year Return:** Over the last year, TCS's stock has decreased by 4.03%. citeturn0search7
**Technical Analysis:**
- **Trendline Retest:** TCS's stock has recently retested a significant trendline on the daily chart. This trendline has historically acted as a support level, and the recent retest suggests a potential for the stock to rebound if it holds above this line. Traders should monitor the stock's price action around this trendline to assess the likelihood of a sustained upward movement.
- **Support and Resistance Levels:** Key support is identified near ₹3,900, with resistance around ₹4,200. A break above ₹4,200 could signal a bullish trend, while a fall below ₹3,900 may indicate further downside.
- **Technical Indicators:** The Relative Strength Index (RSI) is currently at 45, indicating neutral momentum. The Moving Average Convergence Divergence (MACD) line is above the signal line, suggesting a potential bullish crossover. However, these indicators should be used in conjunction with price action for a comprehensive analysis.
**Analyst Insights:**
- **Price Target:** Analysts have set a price target of ₹5,620 for TCS, indicating a potential upside of approximately 42% from the current price. citeturn0search0
- **Dividend Yield:** TCS offers a dividend yield of 1.86%, reflecting a commitment to returning value to shareholders. citeturn0search7
**Conclusion:**
TCS's stock is currently testing a critical trendline support on the daily chart. Investors should monitor the stock's price action around this level to assess the potential for a rebound. While technical indicators suggest a neutral to slightly bullish outlook, it's essential to consider broader market conditions and company fundamentals when making investment decisions.
*Please note that stock market investments carry inherent risks. It's advisable to conduct thorough research or consult with a financial advisor before making investment decisions.*

TCS bearish or Bullish ??TCS retesting its long trend line. After retesting it may resume upward journey.
But at same time it is making Head and Shoulder pattern. It has beoken it. So in case of bearish h&s scenerio, stock can go to 3400 level.
At 3406 there is gap also.
Tell me weather TCS will retest trendline and will go to 4800 level or it will drop to 3400 level.

TCS retesting long trend lineTCS retesting long trend line. Lowest price expected is 3800. PE ratio is also near bottom (means stock is not much costly).
As per trend, one can start accumulation between 3780 and 3930, with target price of 4800 with one year timeline.
It is just for education purpose.

28/01/2025 TCS ON BIG SUPPORT LINETCS 7 Times hit it's trend line. Todays TCS closeing repects the Line.Fist time hit 17/04/2023 then 7 times closeing abve the line

TCS Apply That Chart In Your Mind Accumulate On VWAP Tata Consultancy Services (TCS) is an Indian multinational technology company specializing in information technology (IT) services and consulting. Established in 1968 and headquartered in Mumbai, Maharashtra, TCS is a subsidiary of Tata Sons Pvt Ltd and operates in 150 locations across 46 countries.
**Services and Solutions:**
TCS offers a comprehensive range of services, including:
- **IT Infrastructure Services**
- **Engineering and Industrial Services**
- **Business Intelligence**
- **Business Process Outsourcing**
- **Consulting Services**
- **Cloud Services**
- **Quality Engineering**
- **Blockchain**
- **Enterprise Solutions**
- **Internet of Things (IoT)**
These services cater to various industries such as finance and banking, insurance, telecommunications, transportation, retail, manufacturing, pharmaceuticals, and utilities.
**Financial Performance:**
For the fiscal year ending March 31, 2024, TCS reported consolidated revenues of US$29.1 billion.
**Workforce:**
As of September 2024, TCS employed approximately 612,724 individuals, making it one of the largest employers globally.
**Leadership:**
- **Chairman:** Natarajan Chandrasekaran
- **Managing Director & CEO:** K. Krithivasan
**Market Position:**
TCS is the second-largest Indian company by market capitalization and was ranked seventh on the Fortune India 500 list in 2024. In September 2021, TCS became the first Indian IT company to achieve a market capitalization of US$200 billion.
**Sponsorships and Community Engagement:**
TCS actively sponsors major marathons worldwide, including the Toronto Waterfront Marathon, London Marathon, Amsterdam Marathon, Mumbai Marathon, Lidingöloppet, and New York City Marathon. In India, it sponsors the World 10K held annually in Bangalore. Additionally, TCS conducts an annual IT quiz for high school students called TCS IT Wiz and sponsors Jaguar Racing in Formula E and Nakajima Racing in Super Formula.
With a strong global presence and a diverse portfolio of services, TCS continues to be a leader in the IT services and consulting industry, driving innovation and transformation for businesses worldwide.

tcs is ready for 3650after continue falling and retesting it is confirm that it will
reach to 3650 .
making lower low again and again

TCS Stock has formed a green candle in today's session.
#TCS
Stock has formed a green candle in today's session.
The stock is closing above its
middle BB for the last 2 days.
Target 4390/4490
Stop loss 4180
I am just representing my views
For educational purposes only.

VIEW ON TCSStock has formed a green candle in today's session
Stock is closing above its middle BB since last 2 days
Target 4390/4490
Stop loss 4180
I am just representing my views
For educational purpose only.

2 Breakout and 1 Support trading stocks for 13 Jan markets I daily make educational content videos for swing / positional trading
We discuss 2 Breakout trade ideas in Nureca and Medico, 1 Large cap support idea of Tcs ,and 1 unique pattern formation in Srf

TCS BULLISH PATTERN SEENTCS BULLISH Pattern is possible if "W" Pattern is completed by TCS.
There should be a Stop loss at level 3994 for a Possible up move till target 4628.

TCS Surges 6% Post Q3 ResultsTopic Statement: TCS has surged 6% following its third quarterly results, with the stock creating a gap.
Key Points:
1. Stock has created a gap during the recent upward move and the price has crossed over the 180-day moving average.
2. Heavy support at the 4000 level.
3. Frequent resistance at the 4500 level.

TCS trading in support zone TCS trading in support zone at 4038 on 09.01.2025 it can reverse from this crucial point will see result within 2-3 days

VIEW ON TCSBreakdown on the stock
Stock below its DEC 31 lows
Target 3965/3920
Stop loss 4095
I am just representing my views
For educational purpose only.

TCS Q3 Result on 9th January trading strategy The price is currently approaching the lower end of the channel, near support. The price is testing support near ₹4,000, a critical psychological and technical level. Volume appears relatively low, suggesting a lack of strong participation during the recent pullback. This could mean limited selling pressure.
Support Levels:
₹4,000 (current level, coinciding with trendline support).
₹3,800 (next major support, below the trendline).
Resistance Levels:
₹4,400 (immediate resistance).
₹4,600-₹4,800 (upper channel resistance).
Suggested Trading Strategy ~ Long
If the stock holds ₹4,000 and starts to reverse:
Entry Point: Around ₹4,000–₹4,050.
Stop-Loss: ₹3,950.
Target Levels: ₹4,400 (initial) and ₹4,600 (secondary).
Suggested Trading Strategy ~ Short
If the stock breaks below ₹3,950:
Avoid buying, and consider shorting with a target of ₹3,800.
Stop-Loss: ₹4,050.

TCS Tested Demand Zone ObservedTCS is currently trading at ₹4090, near its tested demand zone between ₹4092.45 and ₹4024, established on 22nd November 2024. Since this zone has been tested previously, traders may exercise caution and monitor for additional confirmation signals before considering actions.
Disclaimer: This analysis is for informational purposes only and should not be considered as financial advice. Please conduct your own research or consult a financial advisor before making any investment or trading decisions.

Bullish Reversal - Inverse Head & Shoulders PatternInstrument: TATA Consultancy Services (TCS) - NSE
Timeframe: 1 Hour
Pattern : An Inverse Head and Shoulders pattern has formed, indicating a potential bullish reversal.
Key Observations :
The Inverse Head and Shoulders pattern is still forming, but entering early at the Right Shoulder can provide an improved risk-reward ratio
Early Entry Plan:
Entry: Near the Right Shoulder level at ₹4,080.
Stop Loss: Below the Head level at ₹3,990 (key support).
Target 1: ₹4,130 (Neckline resistance).
Target 2: ₹4,280 (mid-term target).
Target 3: ₹4,400 (pattern target).
Rationale for Early Entry:
Entering near the Right Shoulder minimizes the stop-loss distance while allowing for participation in the potential breakout.
Risk-Reward Ratio: Early entry improves the ratio significantly compared to waiting for a neckline breakout.
Indicators for Confirmation:
RSI Divergence: Look for RSI to stay above 40 to confirm bullish momentum.
Volume: Accumulation near the right shoulder level indicates stronger bullish interest.
Caution:
If price breaks below ₹3,990 (Head level), it invalidates the pattern.

TCS Support & Resistance As of January 1, 2025, Tata Consultancy Services Limited (TCS) is trading at ₹4,114.10, reflecting a 0.47% increase from the previous close of ₹4,094.40.
Support and Resistance Levels:
Daily Support: ₹4,009.48
Daily Resistance: ₹4,117.38
Short-term Support: ₹4,153.41
Short-term Resistace: ₹4,315.60
These levels are crucial for traders to monitor, as a breach above resistance may indicate a bullish trend, while a drop below support could suggest bearish momentum.
Technical Indicators:
Pivot Points:
Standard Pivot Point: ₹4,145.82
Camarilla Pivot Point: ₹4,088.93
Fibonacci Pivot Point: ₹4,145.82
These pivot points can help identify potential reversal levels during intraday trading.
Analyst Insights:
According to , TCS is currently in a negative trend. They suggest that if you are holding short positions, continue to hold with a daily closing stop loss of ₹4,176. Fresh long positions can be initiated if TCS closes above ₹4,176 levels. Support levels are identified at ₹4,038, ₹3,981, and ₹3,930, while resistance levels are at ₹4,146, ₹4,197, and ₹4,254.

TCS Support & Resistance
As of December 30, 2024, Tata Consultancy Services Limited (TCS) is exhibiting the following technical levels:
Support Levels:
Immediate Support: ₹4,156.05
Short-Term Support: ₹4,168.41
Medium-Term Support: ₹4,131.00
Long-Term Support: ₹4,114.00
Resistance Levels:
Immediate Resistance: ₹4,189.75
Short-Term Resistance: ₹4,189.82
Medium-Term Resistance: ₹4,198.00
Long-Term Resistance: ₹4,215.00
These levels are derived from recent market data and technical analysis.
Traders and investors should monitor these levels closely, as they can provide insights into potential entry and exit points. However, market conditions can change rapidly, so it's advisable to conduct further analysis or consult with a financial advisor before making investment decisions.
