Educational Price Action AnalysisTechM is trading in a tight range since last 9 months, if it crosses its Quarterly EMA 20 i.e. 1120 then it can go to next reistance area i.e. 1360. SL 985
Trade ideas


TECHM - IT Sector - Reversal potential - Swing/InvestmentTECHM Weekly chart -
The analysis is done on weekly as well as on Daily TF hence price may take few weeks to few months in order to reach the targets.
Trade setup is explained in image itself.
The above analysis is purely for educational purpose. Traders must do their own study & follow risk management before entering into any trade
Checkout my other ideas to understand how one can earn from stock markets with simple trade setups. Feel Free to comment below this or connect with me for any query or suggestion regarding this stock or Price Action Analysis.

Shooting StarA shooting star occurs after an advance and indicates the price could start falling.
The formation is bearish because the price tried to rise significantly during the day, but then the sellers took over and pushed the price back down toward the open.
Traders typically wait to see what the next candle (period) does following a shooting star . If the price declines during the next period they may sell or short.
If the price rises after a shooting star , the formation may have been a false signal or the candle is marking a potential resistance area around the price range of the candle.
Script = Tech Mahindra
Time Frame = 15 min

#Techm cash : Looks good above 1040.10#Techm cash -Positional call
16.01.2023
Looks good above 1040.10
Stoploss 1015
Target 1065-1070/1115-1120
Cmp 1035

TechMPrice is moving between support & trend line resistance. Sustaining above the trend line is important to be bullish. Buy above 1018 with the stop loss of 1005 for the targets 1030, 1044 and 1062. Sell below 994 with the stop loss of 1006 for the targets 982. 970 and 956. I will take entry after understanding trend strength only.

Triangle pattern in TECHMThe volatility is now reducing and price is forming an ascending triangle pattern. So far breakout is pending on either side.

Chaos in TECHM priceTECHM is forming a double bottom pattern. With a base of 985-988. Although it broke the triangle pattern yesterday and fell down. Overall two patterns are contradicting each other.

Risky short trade in 15 mins time frameIt is dropped nicely in 15 mins and Triangle pattern falilure in upside
so expect further drop in price today and expecting risk / reward as 1:1
we can enter with minimum quantity on this trade.
SL , Target , entry mentioned in the chart

techm 1dtfVery meaningful downtrend looks like and targets are as mentioned in the charts and this is valid for upcoming week only

TechM Sell below 993Techm looks very weak below 993. It has taken continuously 3 days at exactly 993. breakdown of 993 can give fast momentum till 985 and 975. Pls note I am not SEBI certified advisor, please take advice of your financial advisor before taking trade.
TECH MAHINDRA TECH MAHINDRA has formed a inverted head and shoulder pattern in chart in 2 hours time frame. looking good for buy but stock yet to give breakout. take entry after candle close above 1030.

my investment idea only invest if u believe in the company i was waiting for a long time to invest in this comapany my targets on techmahindra are for two years

Breakdown in Tech Mahindra Ltd...Chart is self explanatory. Levels of breakdown, possible down-moves (where stock may find support) and resistances (close above which, setup will be invalidated) are clearly defined.
Disclaimer: This is for demonstration and educational purpose only. This is not buying or selling recommendations. I am not SEBI registered. Please consult your financial advisor before taking any trade.


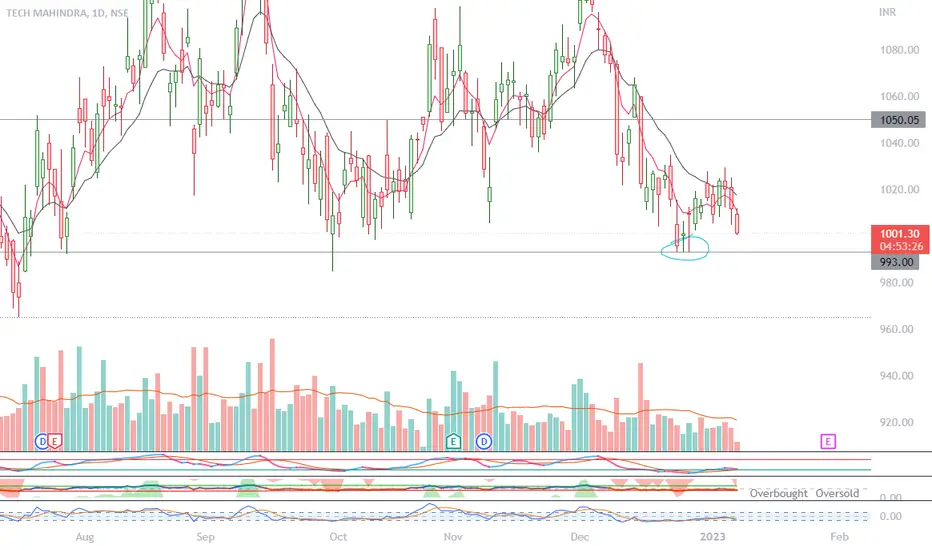
TECHM 1DTECHM: Break Support Test 5th time!!!
We can go for Short opportunity in TECHM.
Wish you Happy & safe Trading.
Cheers,
AS_Vishwakarm
Please Note:
I am not SEBI registered analyst.
My studies are for educational purpose only.
Please consult your financial advisor before Trading or Investing.
I'm not responsible for any kinds of your Profits & Losses.

TECHM 45 min chart with consolidation waiting for breakoutNSE:TECHM TECHM taken support at base level with less stoploss.

Long TECHMTECHM stock has been consolidating between 1000 and 1100 since June this year. This 100 point range has provided a good base for next rally higher.
One can go long TECHM at current market price of 1100, with a stoploss of 997
The target for this trade is 1400, 1500 & 1600
The timeframe for this trade is 31-Jan-2023

Bearish flag pattern reversal in TECHMTECHM
Key highlights: 💡⚡
📊On 1H Time Frame Stock Showing Reversal of bearish flag pattern reversal.
📊 It can give movement upto the Reversal target of below 1030-.
📊There have chances of breakdown of support level too.
📊 After breakdown of Support level this stock can gives strong downside rally upto below 450.

Tech Mahindra-Harmonic PatternTech Mahindra forming ABCD Bullish Harmonic pattern with breakout from box and reclaim of 200 EMA in daily chart. Can move 1500+ levels very soon.

