#Techm cash : Looks good above 960.10#Techm cash
17.05.2021
Looks good above 960.10
stoploss 950
Target 967/984
Cmp 953.35
Trade ideas

Buying Opportunity in TechMFormed double bottom near 940 - 944 Support Zone.
15 min closing above 955 will give good upside move till 970-980

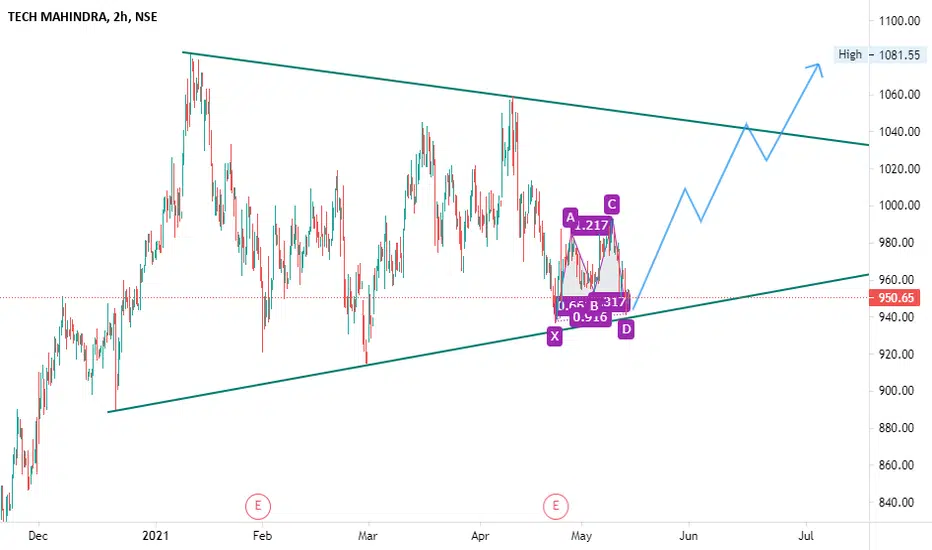


TECH MAHINDRA - Upper Triangle BreakoutBuy once price crosses triangle base with strong candle and good volume


TECHM 15MIN for 11/05/2021THIS VIEWS ARE ONLY FOR EDUCATIONAL PURPOSE , NEVER FOLLOW ANYONE BLINDLY , TRADE WISLEY !
HAPPY TRADING !

Tech Mahindra forming W pattern ready to long positionsTech Mahindra forming W pattern ready to long positions


TECHM CHANNEL BREAKOUTThe stock has consolidated more than 5days and now the stock gave a break out buy above the immediate resistance with the target 1030++

Tech M longGood close after 11 long days! Inside Bar for 8 candles! Gap up or move above 988 shall bring 1030! Ultimate booking zone 1045-1050 (harmonics D)!
buy above 988 for 1030 sl 976


TECHM High Volumes Poor ResultTECHM High Volumes Poor Result
Moving in Symmetrical Triangle
RSI (14) taking Support at 40


TECH MAHINDRAHEY
Its tech mahindra
1) double bottom
2)up trend
if u like it plz
like,follow and share
