TEJASNET 1 Month Time Frame 📊 Current Price Snapshot (Approx)
Last traded price ~ ₹330-₹345 on NSE/BSE during late Jan 2026, after recent volatility and sell-offs.
📉 1-Month Timeframe — Key Levels
🔻 Support Levels (Downside)
These are levels where the stock could find buyers or pause losses on a 1-month chart:
Support Zone Significance
₹320 – ₹325 Immediate support; recent intraday floor (current price region)
₹301 – ₹315 Secondary support zone from pivot breakdowns
₹285 – ₹300 Deeper support if broader bearish momentum continues
📈 Resistance Levels (Upside)
Resistance Zone Importance
₹355 – ₹360 1st resistance from short-term moving average relevance
₹370 – ₹375 Next resistance cluster near recent intraday reactions
₹390 – ₹395 Higher resistance if bounce gains strength
🧠 Technical Indicator Context (1-Month)
📉 Trend Bias: Bearish overall, price trading significantly below major moving averages (20-day, 50-day, etc.).
📊 RSI: Near oversold but not confirmed bottom — suggests bearish momentum but potential for short-term rebounds.
📉 MACD & STOCH: Bearish signals persist, indicating weak price action on the 1-month chart.
🗂 Summary — 1-Month View
⚠️ Bearish Bias: The stock is in a short-term downtrend, trading below key moving averages and suffering weak momentum.
🛑 Support in Focus: ₹320-₹315 first; further deeper zone near ₹285-₹300 if bears intensify.
📈 Resistance Roadblock: ₹355-₹360 key for initial bounce; stronger rally needs break above ₹370+.
📉 Bearish Technicals: RSI not strongly indicating reversal yet; MACD remains bearish.
Tejas Networks Ltd.
No trades
What traders are saying
TEJASNET 1 Month Time Frame 📊 Current Price Context (as of mid‑January 2026)
Tejas Networks is trading around ₹370‑₹375 on NSE/BSE.
The stock recently hit a 52‑week low near ₹364 after weak quarterly earnings and sales decline.
📉 Short‑Term Technical Levels (1‑Month View)
🔻 Immediate Support Zones
These are levels where the stock could find buyers or stall further declines:
₹366‑₹370 — current short‑term support (intraday pivot & recent low).
₹362‑₹366 — lower pivot/secondary intraday support.
~₹356‑₹362 — deeper support if momentum remains weak.
📈 Resistance Levels (Upside Hurdles)
For any bounce or recovery attempt:
₹377‑₹380 — near current pivot/resistance range.
~₹390‑₹395 — next resistance zone (prior price congestion).
₹405‑₹410+ — stronger resistance (short‑term target for recovery).
🧠 Trading/Price Action Tips (1‑month)
Bullish Scenario (countertrend bounce):
A break above ₹380‑₹390 with good volume could shift short‑term sentiment and target ₹405‑₹410+.
Bearish/Continued downtrend:
If support at ₹366‑₹370 breaks convincingly, the next zone near ₹362 then ₹356–₹360 becomes focus.
TEJASNET 1 Day Time Frame 📌 Recent Price & Context
According to a live quote on 9 Dec 2025, Tejas Networks is trading around ₹471–₹476.
Recent technical‑indicator feeds (on daily chart) show oversold conditions: e.g. RSI ~ 20 (oversold), MACD negative, ADX high — indicating downward momentum + volatility.
On weekly‑timeframe classification, some aggregator sources rate the trend as “strong sell.”
So at this moment, the bias is bearish to neutral, unless a reversal catalyst emerges.
🎯 Weekly Pivot / Key Levels (Support & Resistance)
Using the most recent weekly pivot analysis:
Level Price (Approx)
Weekly Pivot (central) ₹503.7
Support Zone 1 (S1) ~ ₹482.5
Support Zone 2 (S2) ~ ₹470.9
Resistance 1 (R1) ~ ₹515.3
Resistance 2 (R2) ~ ₹536.5
Resistance 3 (R3) ~ ₹548.0–₹550+
Interpretation
The pivot at ₹503.7 marks the “line of neutrality.” Weekly closes above this level would shift bias more bullish.
As of now, with price ~ ₹472–₹476, the stock is well below weekly pivot → bearish / consolidation regime.
Downside buffer / support lies around ₹470–₹482; a breakdown below that could open further downside risk (unless long‑term support zones hold).
Upside resistance cluster lies at ₹515 → ₹536 → ₹548. To regain bullish momentum, price needs to first clear ₹503–₹515 zone, then aim higher.
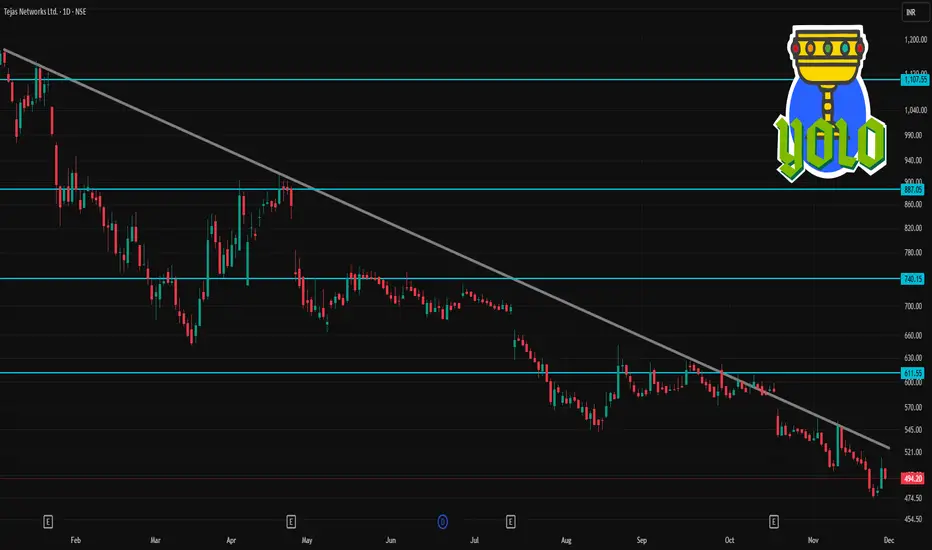
TEJASNET 1 Day Time Frame 📌 Current Price & Context
Recent data shows TEJASNET trading around ₹494–₹496.
52-week range: Low ~ ₹474.45, High ~ ₹1,402.70.
On 1-day/short-term technicals: the consensus remains “Sell / Strong Sell”.
So — the stock is near its lower end of the 52-week range, but short-term momentum is weak.
✅ What This Means for Traders (1-Day / Intraday)
As of now, bias on 1-day timeframe remains bearish / neutral. Unless there is a strong positive catalyst, further downside or consolidation is more likely than a sustained bounce.
The zone around ₹484–₹486 (and possibly down to ₹471–₹475) is critical support — a breakdown below could open a bigger downside swing.
On the upside, watch ₹511–₹512 and then ₹520–₹525 for any meaningful resistance breaks — only a close above these may suggest short-term relief.
Because moving averages are well above current price, any upside rally may remain limited unless volume and market-wide sentiment improve.
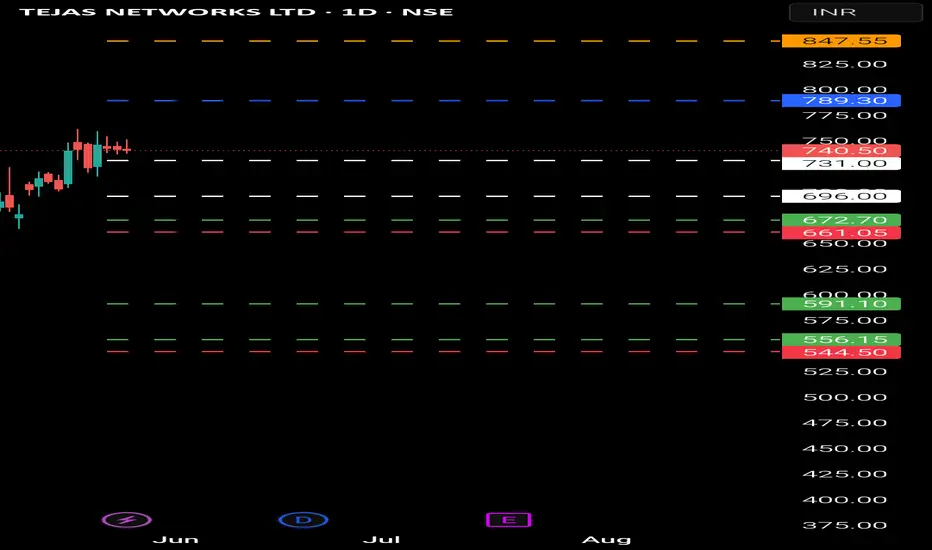
Tejas Networks Ltd (TEJASNET)- Analysis Bullish Levels -if sustain above 789 (early entry risky) then 847 (safe entry if sustain above this for a week) target can be around 952 then 967 or 1010 or 1022 first target, if sustain above for a week or two then we expect more upside and wait for targets around 1800
Bearish levels :- if sustain below 731 then 696 the 672 good support with SL of 661 then 551 to 556 again good support with SL of 544 to below this more bearish.
**Consider some Points buffer in above levels
**Disclaimer -
I am not a SEBI registered analyst or advisor. I does not represent or endorse the accuracy or reliability of any information, conversation, or content. Stock trading is inherently risky and the users agree to assume complete and full responsibility for the outcomes of all trading decisions that they make, including but not limited to loss of capital. None of these communications should be construed as an offer to buy or sell securities, nor advice to do so. The users understands and acknowledges that there is a very high risk involved in trading securities. By using this information, the user agrees that use of this information is entirely at their own risk.
Thank you.
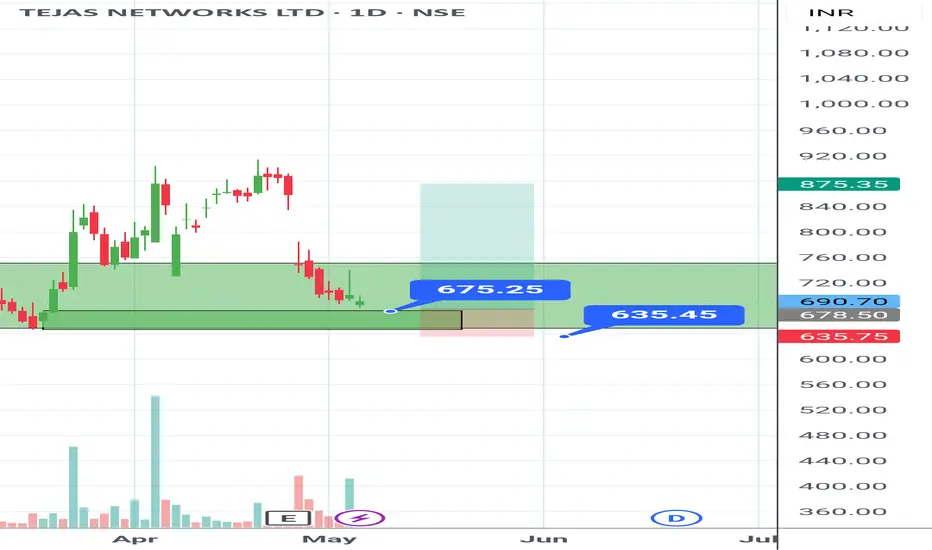
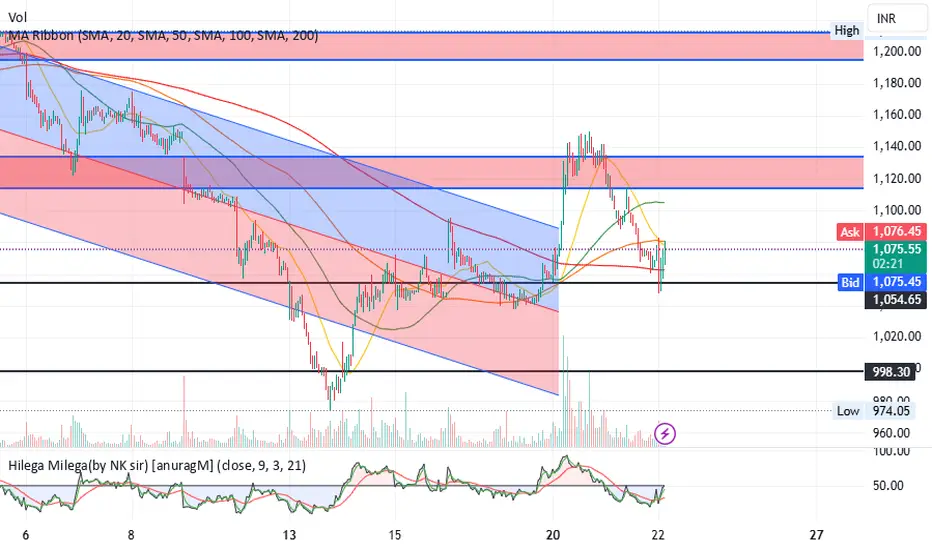
Tejas Network important zone Entry and stoploss point are marked.
Risk reward = 1:4
If stopped out , check for a re-entry with 1-2% risk
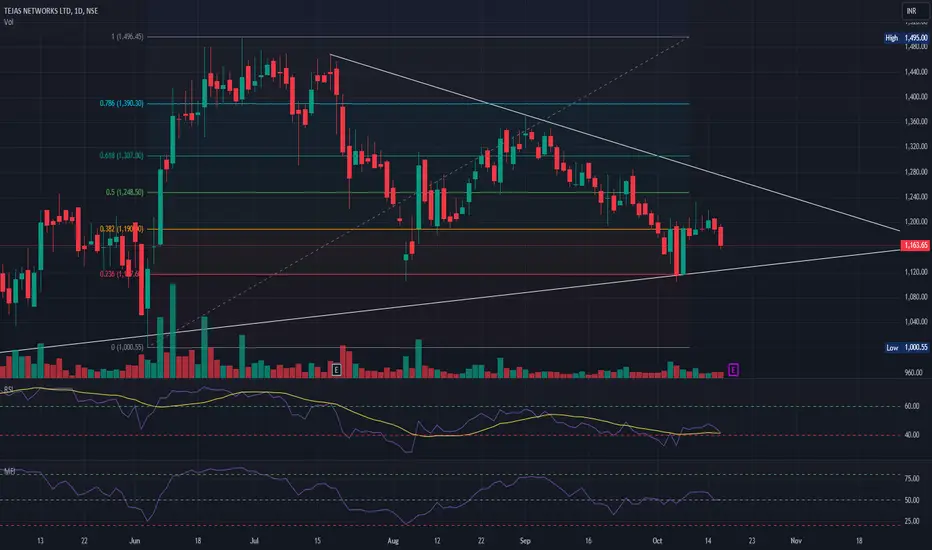
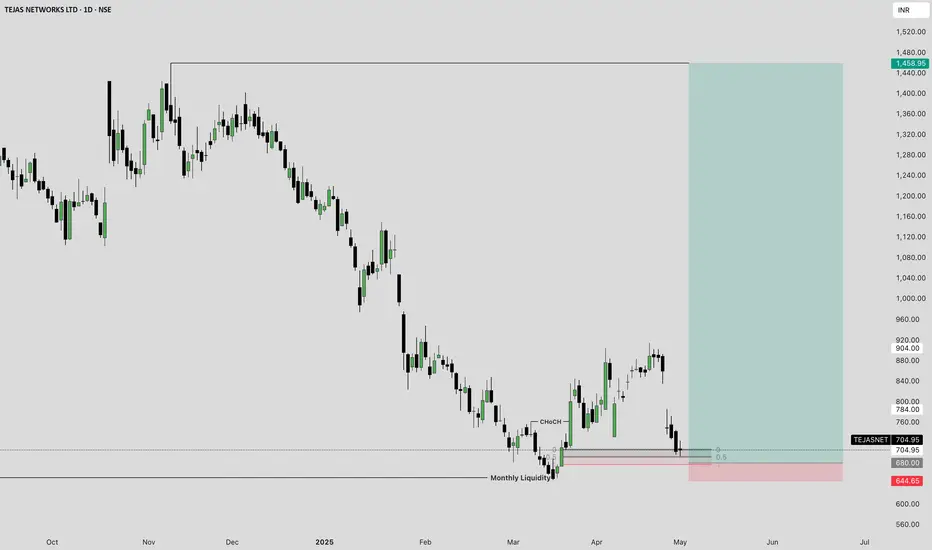
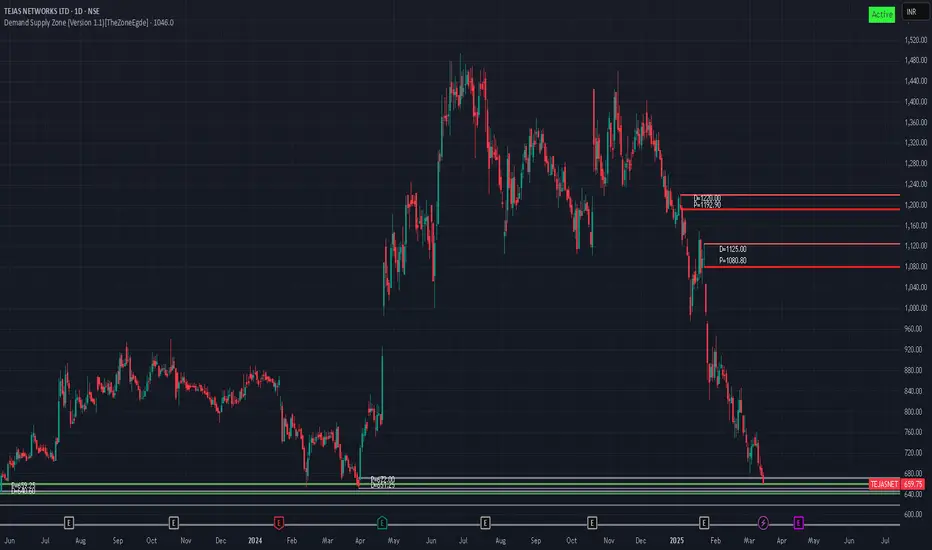
Tejas Networks: Bullish Reversal at Key Support, Targeting 1,450Trading Idea:
Stock: Tejas Networks Ltd (TEJASNET)
Timeframe: Daily (1D)
Current Price: 704.95 INR
Key Levels:
Monthly Liquidity Zone: Support at around 644.65 INR.
Target Zone: Potential upside towards 1,440.00 INR to 1,458.95 INR.
Trade Setup:
Entry: Buy around 644.65 INR (near the support level) for a possible bounce, especially if the price confirms a reversal from this level.
Stop Loss: Place a stop just below 644.65 INR, considering it’s a key support zone.
Target: Aim for the price to reach the target zone between 1,440 INR to 1,458.95 INR. Watch for price action at these levels for possible further action.
Reasoning:
The chart shows a strong sell-off followed by a potential reversal at monthly liquidity support.
The CHoCH (Change of Character) pattern suggests a shift in trend direction, which could provide an opportunity for an upward move.
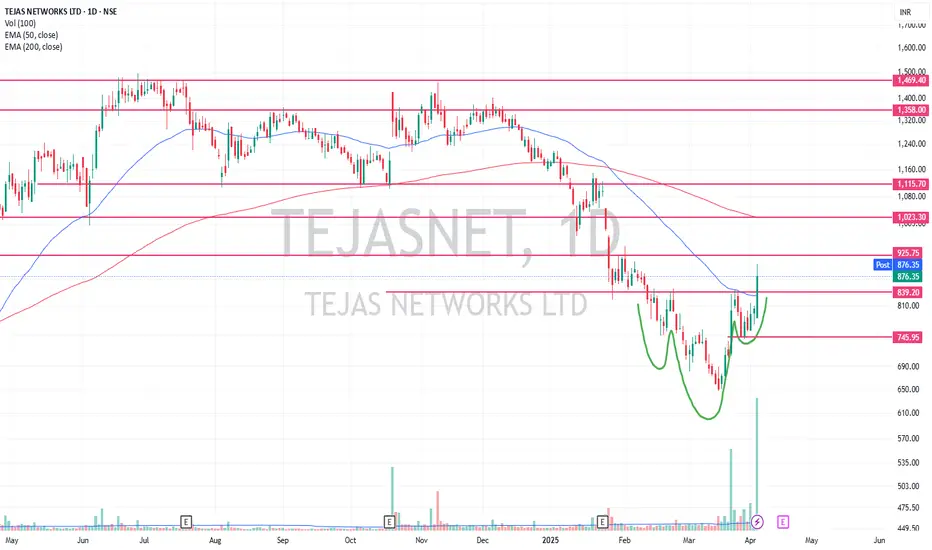
tejas networkThis stock is showing good volumes and it has given an inverted head and shoulders pattern breakout and the breakout candle shows good volume sl can be placed based on your risk appetite either below the low of the shoulder i.e. 740 (closing basis or prominent closing) or below the bo candle of 780(on closing basis or a prominent closing)…targets can 975,1100,1350 and 1500 …breaking 1500 which is the all time high can take it to a new territory
TEJASNET Trading Within Demand Zone (672.0-651.25)The stock TEJASNET is currently trading at 659.75, within its demand zone ranging from 672.0 to 651.25. The last leg out occurred on 2024-04-01.
Disclaimer: This analysis is for informational purposes only and should not be considered financial advice. Please perform your own due diligence or consult a financial advisor before making any investment or trading decisions.

Touched it first Support Zone. Need to wait if it is bouncing from here.
This is for educational purposes only.

Just a result play on TEJAS Network Seeing the forthcoming result of Tejas network a trade can be initiated in TEjas with samll sl around 1030 for targets of 1150++ 1240+++ 1350+++1450+++
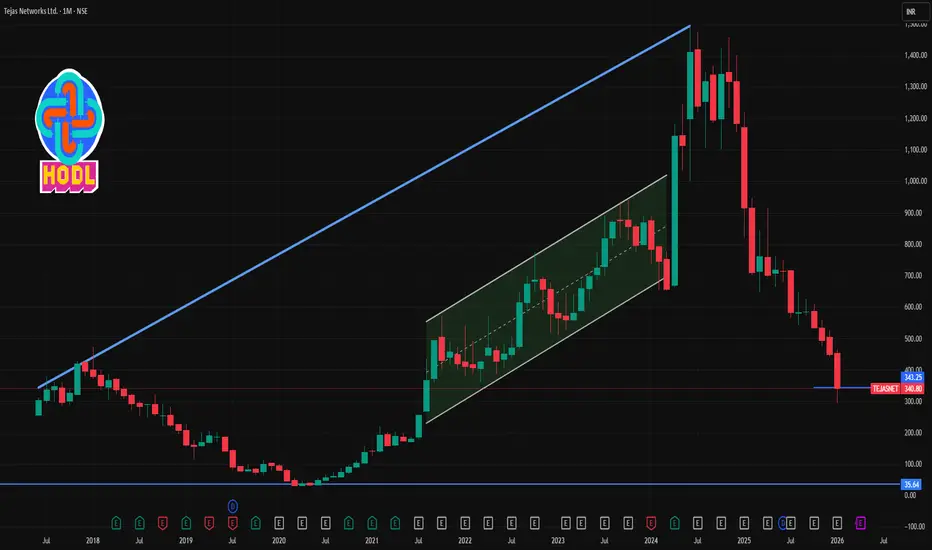
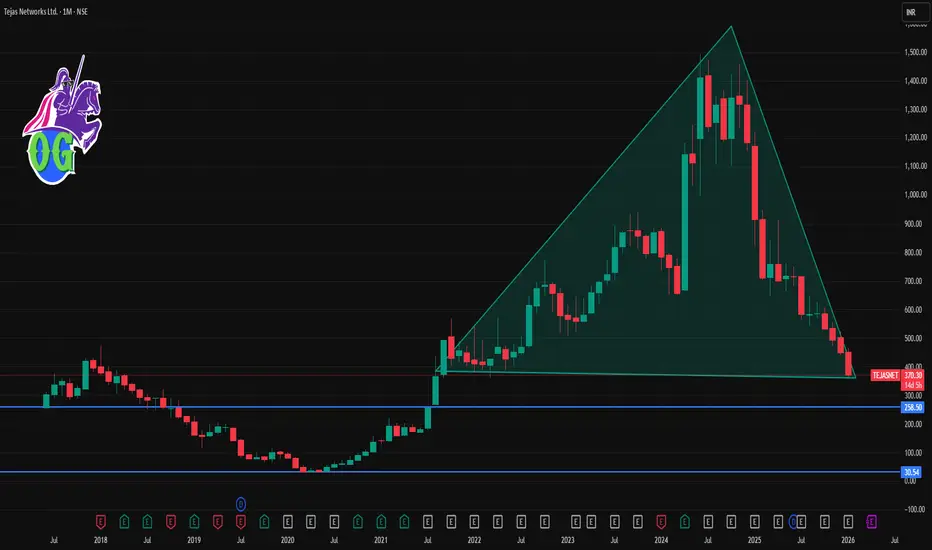
Tejas Network in weekly timeframePattern repetition in Tejas Network on weekly tf- will the pattern repeat itself again?

Tejas Network in weekly timeframePattern repetition in Tejas Network on weekly tf- will the pattern repeat itself again?

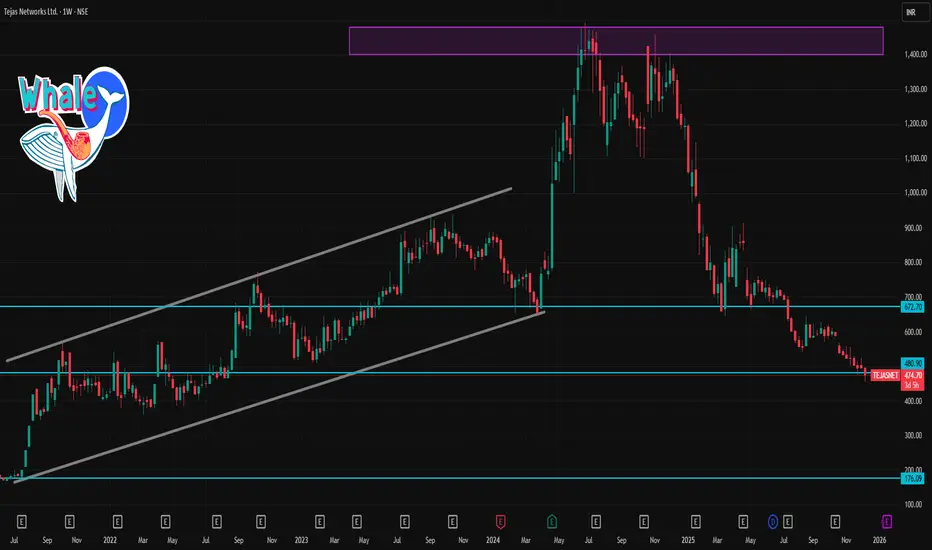
Tejas Network on weekly timeframeAttempting for falling trendline breakout again with immediate support around 1320.
For the past 6 weeks it's within the range of 21st October week candle- in that case, base support is at 1230 and if it breaksout, sustaining above 1426 is very important.

Tejas holding support range 1240--- 1270 long ??A long trade can be initiate wih sl around 1180 for target of 1350+++ 1380+++ 1450++++ 1550++++ 2000+++++ and so on

Tejas will get doubled as per my study A long trade on tejas network around 1350-1370 levels for target of 1500+++ 1718++++ and so on maintaing sl around 1275

Big Base getting ready + Big Base getting ready
+ Trading above Key EMAs
+ Explained on the chart
Disc : Charts are shared for educational Purposes only.

Tejas Network ready for breakout ?????? around 1320-1340 levelsA long trade can be initiated in Tejas network around 1320-1300 levels for target of 1450+++ 1534++++ 1680+++ 1775++++ and so on with strict sl around 1220-1240 levels A very strong counter in telecom sector.

Diwali Pick-3 : TejasnetDiwali Pick-3 :: TejasNet
Channel Breakout Possibility
Looks great above 1375 with support at 1320 and 1230
Breaking 1480 will open up Higher avenues for this

Turning Bullish: Tejas NetworksTejas Networks has been trading in a box range between 1345.00 and 1190.00 Since Aug 2024.
It gave a strong breakout yesterday with good volume.
Support levels: 1265, 1104, 1000
Resistance Levels; 1400, 1470

2000 levels on tejas network ????????A long trade can be initiated in tejas network around 1150-1180 levels even added around 1100 levels with sl around 1050-1003 levels for target of 1360+++ 1457+++ 1700+++ final target of 2000 within a year ..

SOBSector is weak, can sell this share till it cross ₹1230
Disclaimer: Educational Purpose only. consult your adviser.