THYROCARE 1 Week Time Frame 📈 1-Week Performance Snapshot
Current Price (Oct 10, 2025): ₹1,264.00
Weekly Gain: Approximately +4.76%
Weekly Range: ₹1,205.80 – ₹1,270.50
This upward trend is supported by increased trading volume, indicating strong investor interest.
🔍 Technical Indicators
Support Levels: ₹1,246.35 and ₹1,208.21
Next report date
—
Report period
—
EPS estimate
—
Revenue estimate
—
24.10 INR
915.10 M INR
6.87 B INR
15.28 M
About Thyrocare Technologies Ltd
Sector
Industry
CEO
Rahul Franklin Guha
Website
Headquarters
Navi Mumbai
Founded
1996
ISIN
INE594H01019
FIGI
BBG00BT3H632
Thyrocare Technologies Ltd. engages in provison of indepedent diagnostic and pathological laboratory services. It operates through the following segments: Diagnostic Testing Services, Imaging Services and Others. The Imaging Services segment represents PET-CT scan and sale of radio pharmaceuticals used in imaging services. The Others segment represents trading and other related business activities. The company was founded by A. Velumani in 1996 and is headquartered in Navi Mumbai, India.
Related stocks
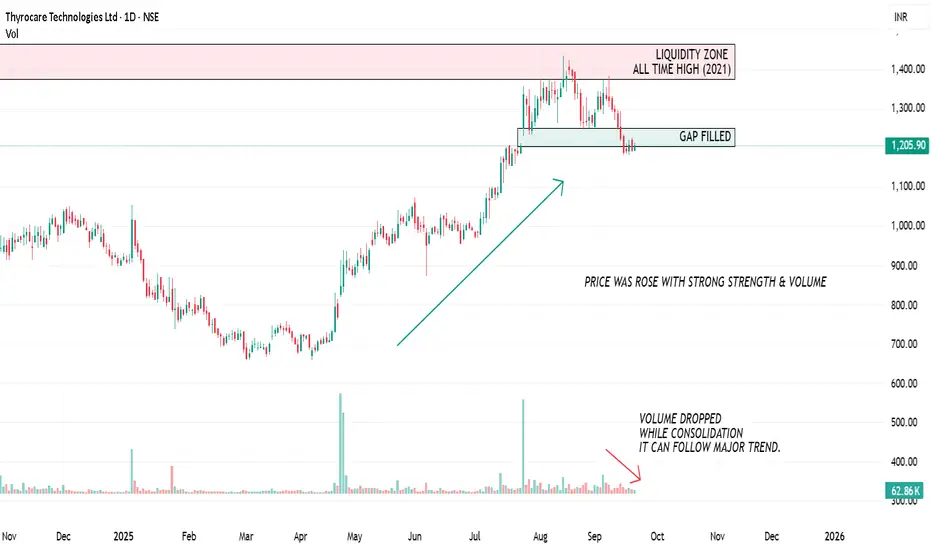
THYROCARE TECHNOLOGIES (GAP FILLED) (MY PERSONAL VIEW)Daily Chart- THYROCARE - NSE
My personal view indicates the price rose with substantial strength and volume. The gap between 1205 and 1251 has now been completely filled. Volume has declined during the current consolidation phase, which historically can precede a major trend movement. I will only c
BUY TODAY SELL TOMORROW for 5%DON’T HAVE TIME TO MANAGE YOUR TRADES?
- Take BTST trades at 3:25 pm every day
- Try to exit by taking 4-7% profit of each trade
- SL can also be maintained as closing below the low of the breakout candle
Now, why do I prefer BTST over swing trades? The primary reason is that I have observed that

THYROCARE TECH LTD ANALYSISFOR LEARNING PURPOSE
THYROCARE TECH LTD - The current price of THYROCARE TECH LTD is 1085.45 rupees
I am going to buy this stock because of the reasons as follows-
1. Its coming out from a good consolidation base
2. It broke a strong resistance zone of 2.5 year

Suggested Buy for the target for 1300/1320Based on the price action, the trend reversed and the previous resistance breakout happen on Daily chart analysis. Next he is trying to reach the target of next resistance 1300/1320. Suggested to invest/sip on dips.

BUY TODAY SELL TOMORROW for 5%DON’T HAVE TIME TO MANAGE YOUR TRADES?
- Take BTST trades at 3:25 pm every day
- Try to exit by taking 4-7% profit of each trade
- SL can also be maintained as closing below the low of the breakout candle
Now, why do I prefer BTST over swing trades? The primary reason is that I have observed that

THYROCARE at a Make-or-Break Level: Strong Rejection Expected?🧠 Technical Overview
THYROCARE has recently approached a strong supply zone , which is formed by a classic Drop-Base-Drop structure — footprints of institutional players.
When price enters such zones, it often encounters heavy selling pressure due to pending sell orders placed by big players (
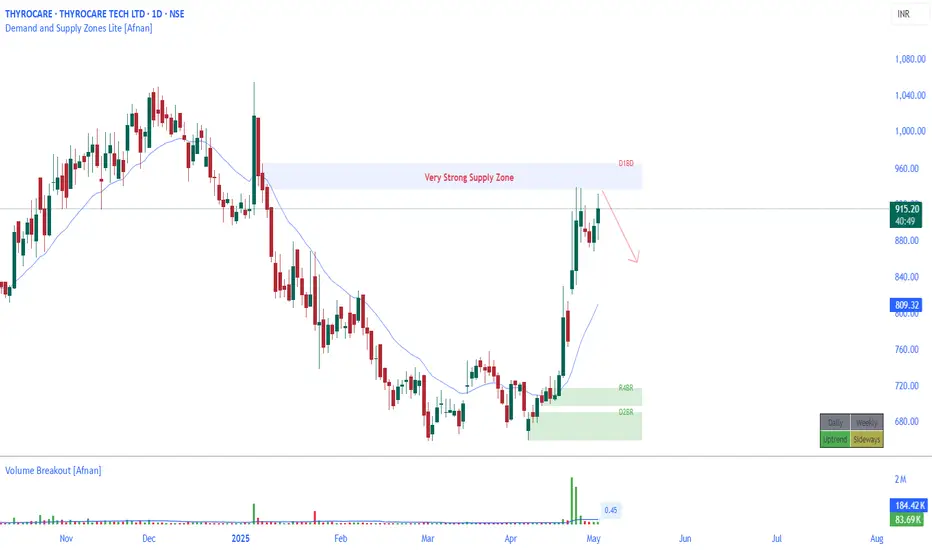
THYROCARE Trading Above Demand Zone (665-630)THYROCARE is currently trading at 676.6, above its demand zone range of 665 to 630. Investors may watch for potential reactions or reversals from this level.
Disclaimer: This analysis is for informational purposes only and should not be considered financial advice. Please perform your own due dilig

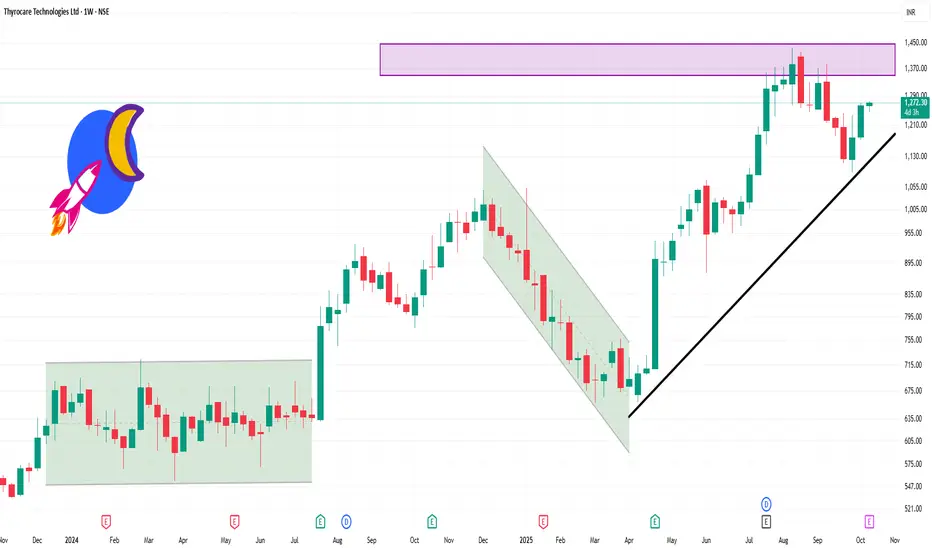
THYROCARE: Long Term ViewThe chart of THYROCARE provides delineates critical price thresholds that signify breakout point, along with specific support level that serve as indicators of where buying interest may manifest.
Additionally, the chart highlights regions likely to act as resistance point for future price ascensi

Thyrocare Bollinger blast on all the time frame Thyrocare after long consolidation above 20 SMA on monthly time frame. Its Bollinger band blasted on all the higher time frame like Monthly weekly and daily time frame.
Relative strength index above 65 on monthly time frame.
Positional possible target is 1152, 1306, 1444.
Stop loss
My views are pe

See all ideas
Summarizing what the indicators are suggesting.
Neutral
SellBuy
Strong sellStrong buy
Strong sellSellNeutralBuyStrong buy
Neutral
SellBuy
Strong sellStrong buy
Strong sellSellNeutralBuyStrong buy
Neutral
SellBuy
Strong sellStrong buy
Strong sellSellNeutralBuyStrong buy
An aggregate view of professional's ratings.
Neutral
SellBuy
Strong sellStrong buy
Strong sellSellNeutralBuyStrong buy
Neutral
SellBuy
Strong sellStrong buy
Strong sellSellNeutralBuyStrong buy
Neutral
SellBuy
Strong sellStrong buy
Strong sellSellNeutralBuyStrong buy
Displays a symbol's price movements over previous years to identify recurring trends.
Frequently Asked Questions
The current price of THYROCARE is 1,243.90 INR — it has decreased by −2.49% in the past 24 hours. Watch Thyrocare Technologies Ltd stock price performance more closely on the chart.
Depending on the exchange, the stock ticker may vary. For instance, on NSE exchange Thyrocare Technologies Ltd stocks are traded under the ticker THYROCARE.
THYROCARE stock has risen by 2.13% compared to the previous week, the month change is a 4.35% rise, over the last year Thyrocare Technologies Ltd has showed a 38.07% increase.
We've gathered analysts' opinions on Thyrocare Technologies Ltd future price: according to them, THYROCARE price has a max estimate of 1,875.00 INR and a min estimate of 1,560.00 INR. Watch THYROCARE chart and read a more detailed Thyrocare Technologies Ltd stock forecast: see what analysts think of Thyrocare Technologies Ltd and suggest that you do with its stocks.
THYROCARE reached its all-time high on Jun 25, 2021 with the price of 1,465.00 INR, and its all-time low was 407.15 INR and was reached on Jul 31, 2019. View more price dynamics on THYROCARE chart.
See other stocks reaching their highest and lowest prices.
See other stocks reaching their highest and lowest prices.
THYROCARE stock is 3.31% volatile and has beta coefficient of 0.39. Track Thyrocare Technologies Ltd stock price on the chart and check out the list of the most volatile stocks — is Thyrocare Technologies Ltd there?
Today Thyrocare Technologies Ltd has the market capitalization of 67.55 B, it has increased by 3.00% over the last week.
Yes, you can track Thyrocare Technologies Ltd financials in yearly and quarterly reports right on TradingView.
Thyrocare Technologies Ltd is going to release the next earnings report on Jan 30, 2026. Keep track of upcoming events with our Earnings Calendar.
THYROCARE net income for the last quarter is 479.90 M INR, while the quarter before that showed 389.30 M INR of net income which accounts for 23.27% change. Track more Thyrocare Technologies Ltd financial stats to get the full picture.
Thyrocare Technologies Ltd dividend yield was 3.09% in 2024, and payout ratio reached 121.55%. The year before the numbers were 3.04% and 134.66% correspondingly. See high-dividend stocks and find more opportunities for your portfolio.
As of Oct 17, 2025, the company has 1.95 K employees. See our rating of the largest employees — is Thyrocare Technologies Ltd on this list?
EBITDA measures a company's operating performance, its growth signifies an improvement in the efficiency of a company. Thyrocare Technologies Ltd EBITDA is 2.29 B INR, and current EBITDA margin is 28.16%. See more stats in Thyrocare Technologies Ltd financial statements.
Like other stocks, THYROCARE shares are traded on stock exchanges, e.g. Nasdaq, Nyse, Euronext, and the easiest way to buy them is through an online stock broker. To do this, you need to open an account and follow a broker's procedures, then start trading. You can trade Thyrocare Technologies Ltd stock right from TradingView charts — choose your broker and connect to your account.
Investing in stocks requires a comprehensive research: you should carefully study all the available data, e.g. company's financials, related news, and its technical analysis. So Thyrocare Technologies Ltd technincal analysis shows the buy rating today, and its 1 week rating is buy. Since market conditions are prone to changes, it's worth looking a bit further into the future — according to the 1 month rating Thyrocare Technologies Ltd stock shows the strong buy signal. See more of Thyrocare Technologies Ltd technicals for a more comprehensive analysis.
If you're still not sure, try looking for inspiration in our curated watchlists.
If you're still not sure, try looking for inspiration in our curated watchlists.