TN petro interesting setup over last few yearsTN petro after a huge rally few years back has been range bound touching 0.618 fibo retracement before marginally going above multi year breakout levels. quite decent daily and weekly volume on the charts and worth tracking.
Weakness only below 115, final resistance incoming
Tamilnadu Petro Products Ltd.
No trades
12.01 INR
583.50 M INR
18.27 B INR
44.96 M
About Tamilnadu Petro Products Ltd.
Sector
Industry
CEO
Senthikumar Dharmar
Website
Headquarters
Chennai
Founded
1984
Identifiers
2
ISININE148A01019
Tamilnadu Petro Products Ltd. manufactures and markets petrochemicals products. It offers linear alkyl benzene, heavy alkylate, epichlorohydrin, caustic soda, chlorine, hydrochloric acid, ammonium chlorine and sodium hypo chlorite. The company was founded on June 22, 1984 and is headquartered in Chennai, India.
Related stocks

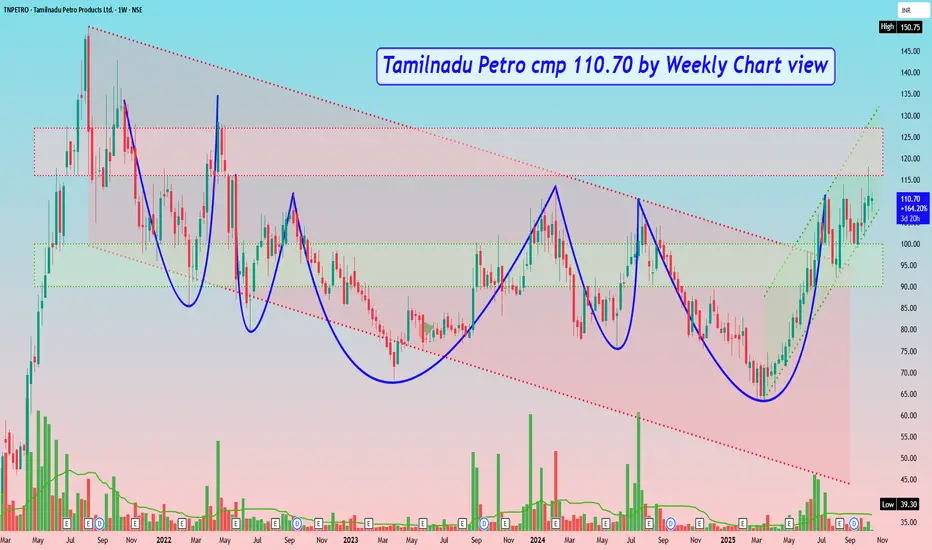
Tamilnadu Petro cmp 110.70 by Weekly Chart viewTamilnadu Petro cmp 110.70 by Weekly Chart view
- Weekly basis : Support Zone 90 to 100 Price Band
- Weekly basis : Resistance Zone 116 to 127 Price Band
- Multiple Bullish Rounding Bottoms around Support Zone and by Resistance Zone neckline
- Price was traversing in Falling Parallel Price Channel
short term trading opportunity in tnpetro for 20% upsideHi,
NSE:TNPETRO has given a Bullish Flag Breakout on Weekly charts with very good volume.
MACD is also on the bullish side on Daily, Weekly and Monthly time frames. RSI is also on the bullish side on daily, weekly and monthly time frames.
In the current market scenario, I am expecting that the

TN petroMarket cap 925 CR
Almost debt free co
Book value 95
PE 15.4
ROE: 7.23
Looking good for long term investment

TNPETRO bullish; above 111 ? - Monday 5th Feb.The above information does not constitute investment/trading recommendation and it is purely for educational purpose. Please check the Strategy below...
SWING Trading Strategy:
Position is created, only upon stock closing above the entry price on day closing basis and is held on for 5-10 trad

Tamilnadu Petro: Forming rounding bottom patternTamilnadu Petro is looking good on weekly time frame. Seems stock is forming rounding bottom pattern. Keep on radar.

Tamil Nadu Petro Products Ltd| A Momentum StockTamil Nadu Petro Products Ltd| A Momentum Stock
Tamilnadu Petroproducts Limited, headquartered at Chennai, Tamilnadu, India is jointly promoted by Southern Petrochemical Industries Corporation Limited (SPIC) and Tamilnadu Industrial Development Corporation Limited (TIDCO) and is engaged in the busi

TNPETRO 1D 1W TFIt may going to blast , so make use of it guys,
I am not a call provider and this is for education propose only

Tamil Nadu Petro: Inverse Head & Shoulder BO on WTFTamil Nadu Petro is looking good on weekly time frame. Stock is trading near inverse head & shoulder breakout level. Keep on radar.

BULLISH ON TNPETRO+ve Correlation with Oil Marketing Companies (Sector of the year 2024)
Excellent Technicals
Gann Time Cycles positive
Steady Fundaments
Regular cash inflows

See all ideas
Summarizing what the indicators are suggesting.
Oscillators
Neutral
SellBuy
Strong sellStrong buy
Strong sellSellNeutralBuyStrong buy
Oscillators
Neutral
SellBuy
Strong sellStrong buy
Strong sellSellNeutralBuyStrong buy
Summary
Neutral
SellBuy
Strong sellStrong buy
Strong sellSellNeutralBuyStrong buy
Summary
Neutral
SellBuy
Strong sellStrong buy
Strong sellSellNeutralBuyStrong buy
Summary
Neutral
SellBuy
Strong sellStrong buy
Strong sellSellNeutralBuyStrong buy
Moving Averages
Neutral
SellBuy
Strong sellStrong buy
Strong sellSellNeutralBuyStrong buy
Moving Averages
Neutral
SellBuy
Strong sellStrong buy
Strong sellSellNeutralBuyStrong buy
Displays a symbol's price movements over previous years to identify recurring trends.
Frequently Asked Questions
The current price of TNPETRO is 106.05 INR — it has decreased by −0.26% in the past 24 hours. Watch Tamilnadu Petro Products Ltd. stock price performance more closely on the chart.
Depending on the exchange, the stock ticker may vary. For instance, on NSE exchange Tamilnadu Petro Products Ltd. stocks are traded under the ticker TNPETRO.
TNPETRO stock has risen by 2.51% compared to the previous week, the month change is a 1.00% rise, over the last year Tamilnadu Petro Products Ltd. has showed a 32.15% increase.
TNPETRO reached its all-time high on Aug 9, 2021 with the price of 150.75 INR, and its all-time low was 6.70 INR and was reached on Dec 3, 2008. View more price dynamics on TNPETRO chart.
See other stocks reaching their highest and lowest prices.
See other stocks reaching their highest and lowest prices.
TNPETRO stock is 1.76% volatile and has beta coefficient of 0.98. Track Tamilnadu Petro Products Ltd. stock price on the chart and check out the list of the most volatile stocks — is Tamilnadu Petro Products Ltd. there?
Today Tamilnadu Petro Products Ltd. has the market capitalization of 9.56 B, it has decreased by −1.97% over the last week.
Yes, you can track Tamilnadu Petro Products Ltd. financials in yearly and quarterly reports right on TradingView.
TNPETRO net income for the last quarter is 342.40 M INR, while the quarter before that showed 352.50 M INR of net income which accounts for −2.87% change. Track more Tamilnadu Petro Products Ltd. financial stats to get the full picture.
Yes, TNPETRO dividends are paid annually. The last dividend per share was 1.20 INR. As of today, Dividend Yield (TTM)% is 1.13%. Tracking Tamilnadu Petro Products Ltd. dividends might help you take more informed decisions.
Tamilnadu Petro Products Ltd. dividend yield was 1.74% in 2024, and payout ratio reached 18.50%. The year before the numbers were 1.54% and 21.57% correspondingly. See high-dividend stocks and find more opportunities for your portfolio.
As of Dec 24, 2025, the company has 1.16 K employees. See our rating of the largest employees — is Tamilnadu Petro Products Ltd. on this list?
EBITDA measures a company's operating performance, its growth signifies an improvement in the efficiency of a company. Tamilnadu Petro Products Ltd. EBITDA is 1.33 B INR, and current EBITDA margin is 3.67%. See more stats in Tamilnadu Petro Products Ltd. financial statements.
Like other stocks, TNPETRO shares are traded on stock exchanges, e.g. Nasdaq, Nyse, Euronext, and the easiest way to buy them is through an online stock broker. To do this, you need to open an account and follow a broker's procedures, then start trading. You can trade Tamilnadu Petro Products Ltd. stock right from TradingView charts — choose your broker and connect to your account.
Investing in stocks requires a comprehensive research: you should carefully study all the available data, e.g. company's financials, related news, and its technical analysis. So Tamilnadu Petro Products Ltd. technincal analysis shows the buy rating today, and its 1 week rating is buy. Since market conditions are prone to changes, it's worth looking a bit further into the future — according to the 1 month rating Tamilnadu Petro Products Ltd. stock shows the buy signal. See more of Tamilnadu Petro Products Ltd. technicals for a more comprehensive analysis.
If you're still not sure, try looking for inspiration in our curated watchlists.
If you're still not sure, try looking for inspiration in our curated watchlists.