Positional or Longterm Opportunity in TridentGo Long above 40.4 for Targets of 45.3, 50.2, and 55.1 with SL 35.5
Reasons to go Long :
1. On a Weekly timeframe if we draw the Fibonacci retracement tool from the recent swing low (point A) to the recent swing high (point B) then we see stock took support from the 0.5 Fibonacci level.
2. In addition to this a bullish candlestick pattern Bullish Engulfing (marked with orange color) is formed around the 0.5 Fibonacci level.
3. Also there is a strong Trendline (marked with green color), from which the stock is taking support and moving up.
Trade ideas

Long at demand areaDirect entry at demand area. Has the probability of taking out all the liquidity on the upside. Weekly looks bearish and might retrace to the weekly premium area after bearish impulse move.

Trident BullishIt seems that Trident has completed a Flat 3-3-5 correction with wave 5 of C ended in ED.... Now it has started new Impulse or give a corrective wave B..... So it can be bought from here or on dips, as if it will cross 41 we can see immidiate Targets of 57-60.

Trident Target Trident broke its triangle pattern. have revised my target.
1:4 risk reward.
*Not an investment advise*

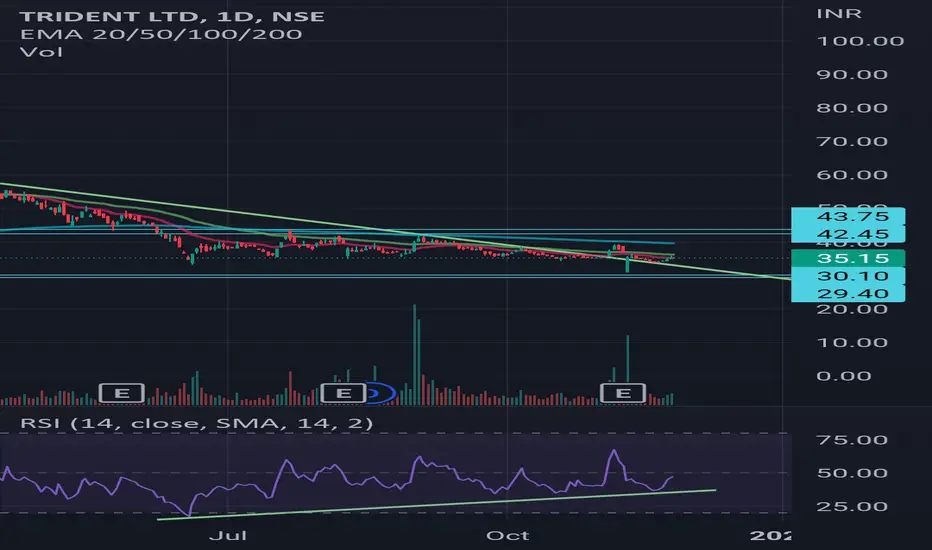
Will RSI show save TridentKnown the bears are coming back and the market in dilemma but Trident has a chance
Look at the divergence, Hope its saves with its strength !
Let see how it works

Trident 🔱 Analysis Currently Side ways
Closing above 44 on Daily and Weekly Time Frame
Strong buying may come

TRIDENT - 09.11.2022 - DAILY CHART - BAHAVAN CAPITALTRIDENT as per day chart analysis Stock Above 39.20 Target 40.20
Happy Profitable Trading to all...

GO longPrice break the trend line with good volume ,and price take a support from 50 SMA ,wait for a retest ,then go for long .

TRIDENT Finally Breaks TrendlineTRIDENT today broke the almost 1 year falling trendline with great volume.
Earnings are scheduled for 14-Nov, so looking for a good up move of 21-55%. There is a strong support at 33-35 region
Entry - 37-38
Target 1 - 46
Target 2 - 56
SL - 32.50
Study the stock clearly before entering.


Trident Buy Price : 29.35
(My opinion but BUY at your own RISK)
CMP : 35+
@starksgroup #stockmarket #stockmarketindia #stocks #stock #marketnews #news

This Stock Can change your Furture
Hey this is some thing that is going to make you millonare
Yes this is a millonare Stock
So......
NSE:TRIDENT

TRIDENT 10% UPSIDE SEEMS Trident is looking good on daily chart by breaking a falling trendline resistance and closed above by following a closing above on it's 20 day moving average too with good gaining volumes so we can see coming good um moves in this stock very soon.
Cause of long-:
1- Falling trendline resistance breakout.
2- 20 days moving average breakout.
3- Nicely gaining volumes.

Bearish flag and pole pattern in trident
In weekly chart, Trident is showing weakness and forming bearish flag pattern.
Now consolidating since 3 months, if break down of its flag then new support at 23-27 as mentioned in chart itself. Keep eye on it.
Quarterly results is also squeezing.

Trident about to break 42.Trident may breakout soon. After touching it's resistance for three times now it's ready to break 42 level.

TRIDENT NSE:TRIDENT Looks Bullish for Short Term on Daily Charts. BUY TRIDENT @ Rs 39.50 Targets Expected are Rs. 45.50 in the next 15 - 20 Trading day Stoploss placed below @ Rs. 36.50 NSE:TRIDENT

Super Buying Opportunity in "TRIDENT".The chart show the wonderful short term strength. If tomorrow stock cross 43 mark with good amount of volume, then it may give good amount of return in short term.
Disclaimer: -
The above article is my personal opinion & it may be wrong, please do your research before investing.

Wedge breakout in trident on weekly chartTrident has formed a wedge patttern on weekly chart and given a breakout.Trident can be added positionally for a target 1 of 44.25 then second target of 49.1 with a sl of 35.

Trident wedge breakoutTrident has given a wedge breakout by giving closing above 39 . it can be added for positional target of 44 then second target of 49 with a sl of 35.

TRIDENT LTD BREAKOUT WITH VOLUME Trident weekly breakout with high volume 2 targets with roi of 8- 20%
This is only for educational purpose.

#Trendline breakout in tridentTrident trendline breakout with huge spike in volumes and target marked on charts and to get more this types of trade kindly follow me on front page@ahesanalirajedia

Breakout in TRIDENTBreakout in TRIDENT
Entry: CMP
Targets: 44 & 50
DISCLAIMER: The ideas shared are only for educational purpose. The markets are very volatile, so plan your trades accordingly. Please trade with stop loss. I am not SEBI registered.
