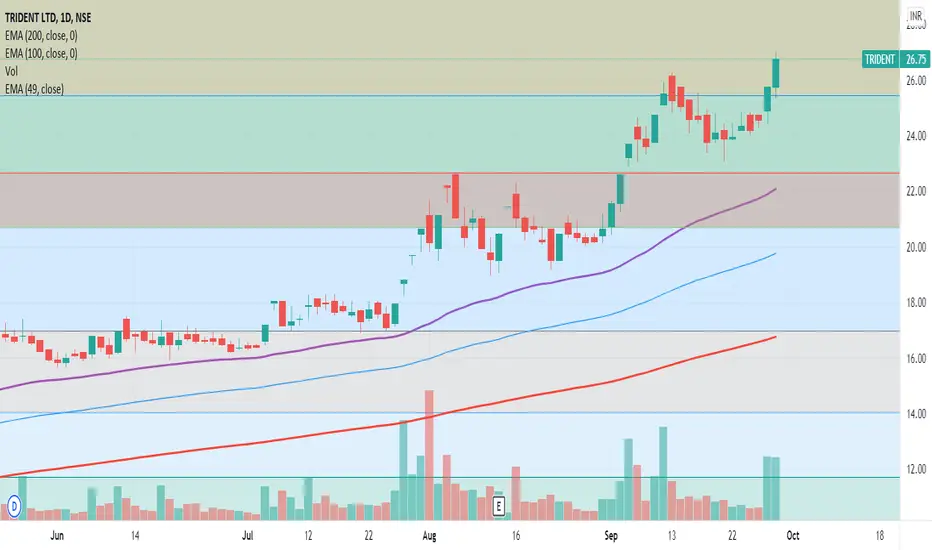
TRIDENTTextiles + Paper + Chemicals + Yarn. All sector are hot currently. It has presence in all these sectors. Enjoy the ride !
Trade ideas

on Uncharted territory, Can hit 39 pretty quickly! Keep On RadarDisclaimer: NOT SEBI registered. Charts produced here are for personal reference only and not any recommendations.
(hidden gem) trident will skyrocket*for educational purpose only ,i's not a call .Do your own analysis.
highly bullish on trident buy and forget for months.
thanks


Trident Chart AnalysisBuy directly if a bullish crossover is seen here and both K and D line are above 20


Bullish fkag pattern in Trident…This flag pattern can show huge breakout… Add on your positions on dips and hold for long…

Good time to pick up for targets!10% in a short time frame.
This pattern has occure in past for 2 times it mat continue again.
alredy given a breakout and susutaing can go higer also trail stoploss once tagert are achived.


Symmetrical triangle formation - upside possibleChart is self explanatory. Levels mentioned may be used as stop loss

Trident 5% upper circuit today *For educational purpose only it's not a call do your own analysis. We won't be responsible for Any profit or loss.
Chart Posted yesterday today stock hit 5% Upper circuit.

Trident Ltd 1D #Symmetrical triangle Disclaimer :-
*For educational purpose only, it's not a call do your own analysis.
Stock may see a good up move in coming days.
Thanks!
#Breakouttrades.....

Rising Wedge formation ✨Currently Trident is showing up Wedge pattern wait for breakout.. thats is after 23.


trident chart analysisbuy near 19 or below for target of 24 .
very good chart pattern moving like stairs.

trident Trident stock looks good to me with targets of Rs 20 and 22 in shortterm.
It has given a breakout and will move on AGM News.

Tridenttweezer bearish 21.15
if this is not taken out by bulls in near future then it could be bearish


