Triveni Engineering and Industries Limited
No trades
Next report date
—
Report period
—
EPS estimate
—
Revenue estimate
—
11.95 INR
2.43 B INR
56.87 B INR
72.90 M
About Triveni Engineering and Industries Limited
Sector
Industry
Website
Headquarters
Noida
Founded
1932
Identifiers
2
ISININE256C01024
Triveni Engineering & Industries Ltd. engages in the manufacture of sugar and engineered mechanical equipment, steam turbines, and high speed gears. It operates through the following business segments: Sugar, Engineering, and Others. The Sugar segment involves in the manufacture of white crystal sugar and offers co-generation, and distillery. The Engineering segment focuses on high speed and niche low speed products, and supply of new equipment as well as providing replacement solutions for power sector. The company was founded on July 27, 1932 and is headquartered in Noida, India.
Related stocks
TRIVENI - opportunity for quick 2% gainsNSE:TRIVENI
cmp 388
there is an opportunity for getting quick 2% gains in this stock.
on hourly timeframe there is trendline breakout plus positive diversion on the RSI
I will be looking for entry at cmp 388 with target of 394
SL will be 372
The objective of this analysis is knowledge sharing an

TRIVENI ENGKindly do your own study.
This stock is ready for bullish momentum.
Stock is in momentum in monthly, weekly and daily timeframe.
Monthly price has challenged upper BB
Monthly MACD-PCO stat
Monthly RSI is above 60
Weekly price has challenged upper BB
Weekly MACD has given positive crossover abov

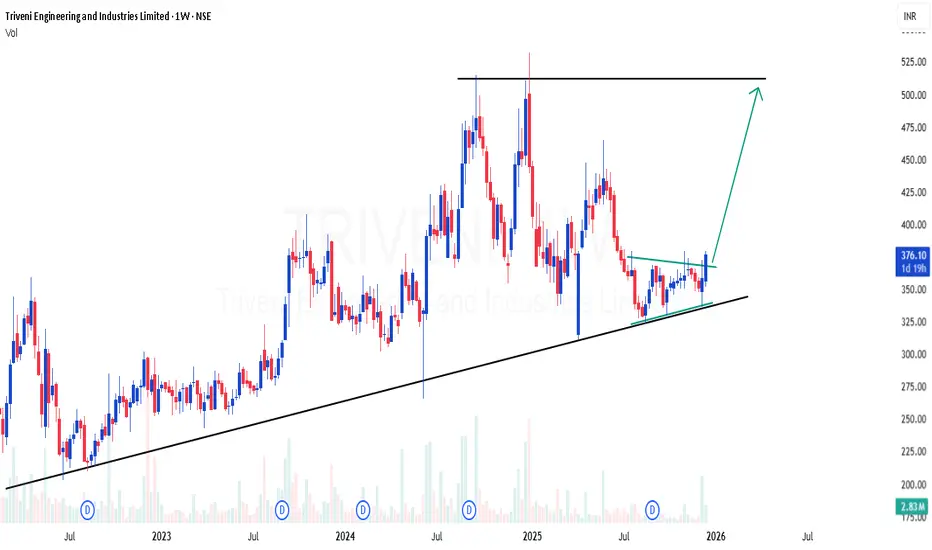
TRIVENITRIVENI showing very good strength with trend-line breakout along with quaterly highest volume. Seems it may take-off to new zone ahead. And also made a base nr 440-50 levels. Keep it in yr watchlist.

Falling Wedge Pattern Breakout.After the formation of Falling Wedge Pattern we saw a good Breakout, now it is a good time to Take a Long Entry on a Pull-back. Entry price is 430-433, Target 480-500-530+.

TRIVENI#TRIVENI
Wait for the pullback to retest the BO zone before entering the stock with a SL below 356.

TRIVENI Trading Within Tested Demand ZoneTRIVENI is currently trading at ₹377.5, positioned within its tested demand zone between ₹378.75 and ₹366, identified on 13th June 2024. This zone has already demonstrated support in the past, which may continue to attract buying interest. Investors could consider this level for potential accumulati

TRIVENI Currently in Fresh Demand Zone of ₹418.5-₹408.55TRIVENI is trading at ₹418.4, situated within the fresh demand zone of ₹418.5 to ₹408.55. This zone marks a potential accumulation phase, where the stock could attract buying interest, especially if it rebounds or breaks out of the range. Investors may look to monitor any price action from this leve

TRIVENI ENGG Rebounding from Trendline Support- Keep In RadarThe stock is rebounding from a strong trendline support near 440 showing potential for further upside. The price is trading above the 200 EMA indicating continued bullish momentum in the medium term.
The RSI is at 45 suggesting that the stock has room to rise before reaching overbought levels. A br

TRIVENI MAY BREAK WEEKLY TIME FRAME Closing strongly above 530 we may consider weekly breakout chanel pattern . volumes are building up. wait till this week candle to be close . educational purpose only

See all ideas
Summarizing what the indicators are suggesting.
Neutral
SellBuy
Strong sellStrong buy
Strong sellSellNeutralBuyStrong buy
Neutral
SellBuy
Strong sellStrong buy
Strong sellSellNeutralBuyStrong buy
Neutral
SellBuy
Strong sellStrong buy
Strong sellSellNeutralBuyStrong buy
An aggregate view of professional's ratings.
Neutral
SellBuy
Strong sellStrong buy
Strong sellSellNeutralBuyStrong buy
Neutral
SellBuy
Strong sellStrong buy
Strong sellSellNeutralBuyStrong buy
Neutral
SellBuy
Strong sellStrong buy
Strong sellSellNeutralBuyStrong buy
Displays a symbol's price movements over previous years to identify recurring trends.
SMALLCAP
Mirae Asset Nifty Smallcap 250 Momentum Quality 100 ETF Units Exchange Traded FundWeight
0.36%
Market value
291.06 K
USD
MOSMALL250
Motilal Oswal Nifty Smallcap 250 ETF Units Exchange Traded FundWeight
0.15%
Market value
22.39 K
USD
HESC
HSBC ETFs PLC - HSBC MSCI Emerging Markets Small Cap Screened UCITS ETFWeight
0.03%
Market value
14.90 K
USD
MULTICAP
Mirae Asset Nifty500 Multicap 502525 ETF Exchange Traded Fund UnitsWeight
0.04%
Market value
2.13 K
USD
Explore more ETFs
Frequently Asked Questions
The current price of TRIVENI is 398.50 INR — it has increased by 2.17% in the past 24 hours. Watch Triveni Engineering and Industries Limited stock price performance more closely on the chart.
Depending on the exchange, the stock ticker may vary. For instance, on NSE exchange Triveni Engineering and Industries Limited stocks are traded under the ticker TRIVENI.
TRIVENI stock has risen by 12.08% compared to the previous week, the month change is a 11.17% rise, over the last year Triveni Engineering and Industries Limited has showed a −12.74% decrease.
We've gathered analysts' opinions on Triveni Engineering and Industries Limited future price: according to them, TRIVENI price has a max estimate of 575.00 INR and a min estimate of 334.00 INR. Watch TRIVENI chart and read a more detailed Triveni Engineering and Industries Limited stock forecast: see what analysts think of Triveni Engineering and Industries Limited and suggest that you do with its stocks.
TRIVENI reached its all-time high on Dec 30, 2024 with the price of 536.00 INR, and its all-time low was 10.35 INR and was reached on Aug 28, 2013. View more price dynamics on TRIVENI chart.
See other stocks reaching their highest and lowest prices.
See other stocks reaching their highest and lowest prices.
TRIVENI stock is 3.11% volatile and has beta coefficient of 1.29. Track Triveni Engineering and Industries Limited stock price on the chart and check out the list of the most volatile stocks — is Triveni Engineering and Industries Limited there?
Today Triveni Engineering and Industries Limited has the market capitalization of 85.25 B, it has increased by 3.80% over the last week.
Yes, you can track Triveni Engineering and Industries Limited financials in yearly and quarterly reports right on TradingView.
Triveni Engineering and Industries Limited is going to release the next earnings report on Feb 4, 2026. Keep track of upcoming events with our Earnings Calendar.
TRIVENI net income for the last quarter is 259.00 M INR, while the quarter before that showed 44.10 M INR of net income which accounts for 487.30% change. Track more Triveni Engineering and Industries Limited financial stats to get the full picture.
Yes, TRIVENI dividends are paid annually. The last dividend per share was 2.50 INR. As of today, Dividend Yield (TTM)% is 0.64%. Tracking Triveni Engineering and Industries Limited dividends might help you take more informed decisions.
Triveni Engineering and Industries Limited dividend yield was 0.65% in 2024, and payout ratio reached 22.50%. The year before the numbers were 1.13% and 19.39% correspondingly. See high-dividend stocks and find more opportunities for your portfolio.
As of Dec 24, 2025, the company has 4.64 K employees. See our rating of the largest employees — is Triveni Engineering and Industries Limited on this list?
EBITDA measures a company's operating performance, its growth signifies an improvement in the efficiency of a company. Triveni Engineering and Industries Limited EBITDA is 5.05 B INR, and current EBITDA margin is 8.76%. See more stats in Triveni Engineering and Industries Limited financial statements.
Like other stocks, TRIVENI shares are traded on stock exchanges, e.g. Nasdaq, Nyse, Euronext, and the easiest way to buy them is through an online stock broker. To do this, you need to open an account and follow a broker's procedures, then start trading. You can trade Triveni Engineering and Industries Limited stock right from TradingView charts — choose your broker and connect to your account.
Investing in stocks requires a comprehensive research: you should carefully study all the available data, e.g. company's financials, related news, and its technical analysis. So Triveni Engineering and Industries Limited technincal analysis shows the strong buy rating today, and its 1 week rating is strong buy. Since market conditions are prone to changes, it's worth looking a bit further into the future — according to the 1 month rating Triveni Engineering and Industries Limited stock shows the buy signal. See more of Triveni Engineering and Industries Limited technicals for a more comprehensive analysis.
If you're still not sure, try looking for inspiration in our curated watchlists.
If you're still not sure, try looking for inspiration in our curated watchlists.